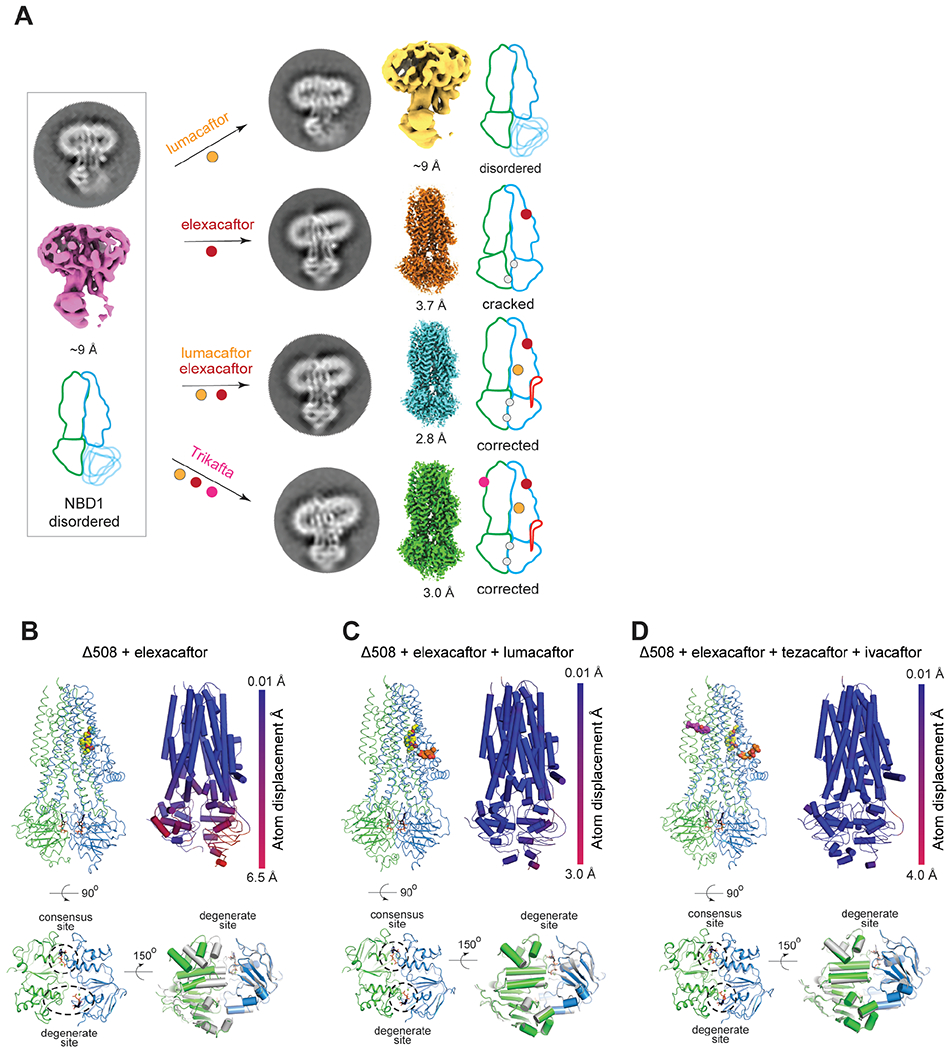
Fig. 2. Conformational changes induced by correctors in Δ508 CFTR.

(A) Summary of structural analysis of Δ508/E1371Q CFTR in the absence and presence of correctors. Average projection from 2D classification, final 3D reconstruction, and schematic representation shown for each structure. NBD1 and TMD1, blue; NBD2 and TMD2, green; R-domain, red; ATP, grey dot; CFTR modulators, colored dots. (B, C, D) Structures of Δ508/E1371Q CFTR in complex with modulators. Top left panels: the overall structure. Top right panels: Cα displacements of the Δ508/E1371Q compared to the WT/E1371Q CFTR (PDB, 7SVD). Lower left panels: zoomed-in view of the Δ508 NBD dimer. Lower right panels: superposition of the NBD structures of Δ508 (NBD1, blue; NBD2, green) and WT CFTR (grey). Drug molecules are represented as sphere models.
