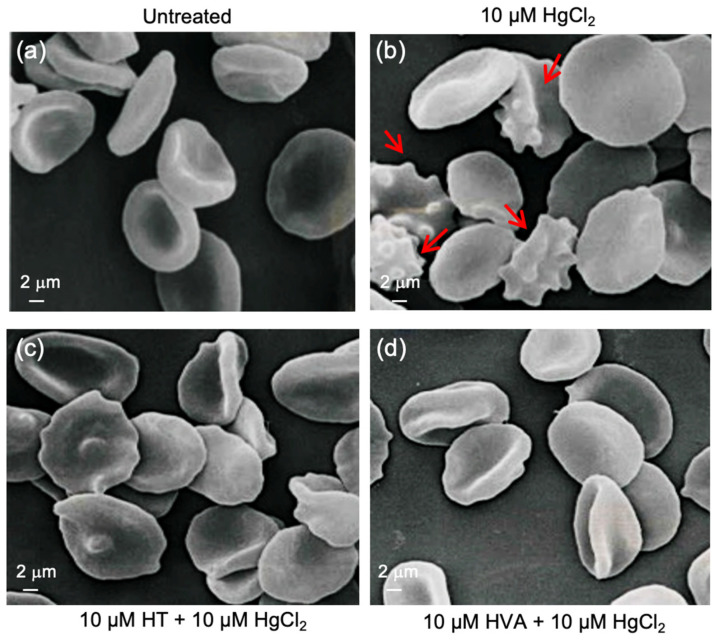
Figure 2.
Red blood cell morphology evaluation. Representative scanning electron microscopy images showing RBCs with a typical biconcave form (a) left untreated or, alternatively, with surface blebs (b) (acanthocytes, red arrows) (10 μM HgCl2). (c) and (d) Pre-treatment with HT and/or HVA (10 µM) attenuated the morphological changes compared to HgCl2 treatment. Magnification 3500×.

