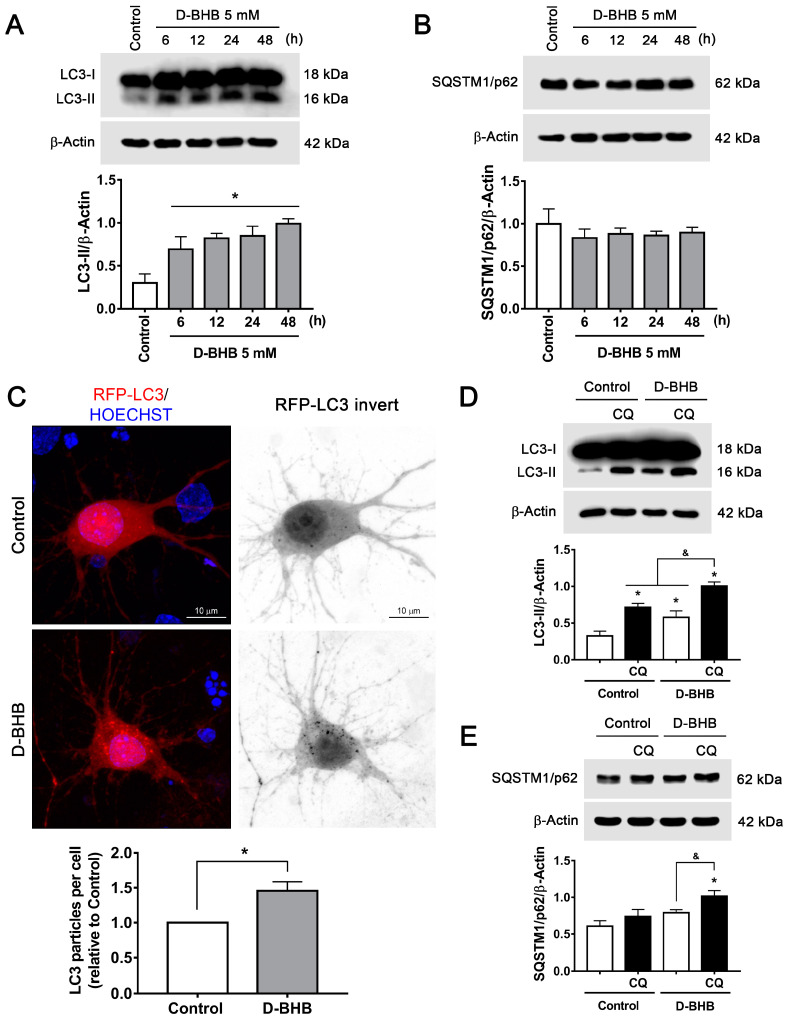
Figure 3.
D-BHB induces autophagy in cortical neurons. (A) Representative Western blot and quantification of LC3-II/β-actin. (B) Representative Western blot and quantification of SQSTM1/p62/β-actin. (C) Representative micrographs of neurons transfected with RFP-LC3 and treated and non-treated with 5 mM B-BHB for 24 h. Graph shows quantification of RFP-LC3 positive autophagic vesicles in neurons treated and non-treated with D-BHB. Data were normalized with respect to control. Representative Western blot and quantification of (D) LC3-II/β-actin and (E) SQSTM1/p62/β-actin from cultures treated or non-treated with D-BHB (5 mM) for 24 h with or without chloroquine (CQ, 20 μM) for 4 h. Data are expressed as Mean ± SEM from 4 independent experiments. Data were analyzed by one-way ANOVA followed by Fisher’s post-hoc test for A and B or analyzed by two-way ANOVA followed by Fisher’s post-hoc test for D and E. * p < 0.05 vs. control; & p < 0.05 vs. D-BHB + CQ. Data in C were analyzed by Student´s t-test. * p < 0.05 vs. control.

