Abstract
Ion mobility spectrometry/mass spectrometry (IMS/MS) is widely used to study various levels of protein structure. Here, we review the current state of affairs in tandem-trapped ion mobility spectrometry/mass spectrometry (tTIMS/MS). Two different tTIMS/MS instruments are discussed in detail: the first tTIMS/MS instrument, constructed from coaxially aligning two TIMS devices; and an orthogonal tTIMS/MS configuration that comprises an ion trap for irradiation of ions with UV photons. We discuss the various workflows the two tTIMS/MS setups offer and how these can be used to study primary, tertiary, and quaternary structures of protein systems. We also discuss, from a more fundamental perspective, the processes that lead to denaturation of protein systems in tTIMS/MS and how to soften the measurement so that biologically meaningful structures can be characterised with tTIMS/MS. We emphasize the concepts underlying tTIMS/MS to underscore the opportunities tandem-ion mobility spectrometry methods offer for investigating heterogenous samples.
Introduction
The focus of this review is tandem-trapped ion mobility spectrometry / mass spectrometry (tTIMS/MS).1 We provide an overview of currently existing implementations and emphasize the opportunities offered for analyses of biological systems. To this end, we showcase the various operational modes tTIMS/MS offers to the analyst and discuss case studies ranging from peptide assemblies2 to native protein systems3–5 and top-down analysis of intact protein systems.1,3,6 We exclude a detailed discussion of ion mobility spectrometry (IMS) and trapped ion mobility spectrometry (TIMS), on which several excellent reviews are available.7–12 The single exception we make here is that of ion heating in tTIMS: the topic of ion heating is of such paramount significance to any ion mobility study that our review would not be complete without its discussion.
The tTIMS/MS method1,13 is the result of joint efforts between the Bleiholder laboratory at Florida State University (Tallahassee, FL) and the laboratory of Melvin A. Park at Bruker Daltonics (Billerica, MA) that started in 2014. In many ways, however, tTIMS/MS goes back to the coupling of ion mobility spectrometry (IMS) with mass spectrometry (MS) by McDaniel,14 the application of the hyphenated IMS/MS technique to study ion structures by Bowers15–18 and Jarrold,19–22 and the tandem-drift tube measurements reported by Clemmer.23–25 These studies informed us that, except for the caveat of being a gas-phase method,4,26–28 IMS/MS should be ideally suited to study numerous biological processes. Because, at the molecular level, many cellular activities involve changes in the masses and/or structures of reactants, IMS/MS disentangles the complex in-solution steady-state by separating ions by differences in their structures and masses.29 Moreover, through measurements of momentum transfer cross sections, IMS/MS provides information related to the conformation of detected ions.16,30–33 These abilities prompted an array of structural studies of biological problems with IMS/MS, from peptide assemblies17,18,34–38 to proteins19,39–44 and protein complexes.45–50 Additionally, Clemmer demonstrated how specific isomers of the small protein ubiquitin can be isolated from a mixture of isomers and selectively interrogated by coupling collisional-activation with consecutive IMS-separation and mobility-selection steps (tandem-IMS).23–25 This ability of tandem-IMS/MS to selectively interrogate specific protein isomers from a mixture of isomers proved powerful because it showed that structural elements of the native state of ubiquitin are retained in ion mobility measurements.24
When our laboratories first conceived tTIMS/MS, our initial motivation was to advance Clemmer’s tandem-IMS measurements such that (1) interrogation of much larger biological systems, including viral spike proteins or ribosomal proteins, becomes possible; and (2) their primary, tertiary, and quaternary structures can be characterised in detail starting from intact, native-like structures. The TIMS method pioneered by Park and colleagues,51–62 offers benefits for tandem-IMS instrumentation because TIMS offers elevated resolving powers at a compact instrumental footprint. An additional attractive feature of TIMS is that it operates by trapping ions and thus enables experiments not easily conducted on traditional IMS systems. We thus started with the simple, coaxial coupling of two prototype TIMS analysers.1 These efforts were followed by characterizing the ability to preserve weakly-bound peptide assemblies2 and native-like protein structures4 in tTIMS/MS. Next, we demonstrated the potential of tTIMS/MS to characterise primary, tertiary, and/or quaternary structures of protein assemblies.3,4 More recently, to improve sensitivity and sequence coverage for top-down analysis of larger protein systems, we constructed an orthogonal tTIMS/MS instrument based on a commercial timsTOF Pro instrument (Bruker Daltonics, MA)5 and coupled it with UV photodissociation.6 This orthogonal tTIMS/MS instrument was designed to enable native complex-top-down studies using automated TIMS2-MS2 workflows by performing parallel-accumulation serial fragmentation (PASEF) on fragment ions generated from UVPD.63
We realize that an instrumental method enabling multiple ion activation, IMS separation, and ion selection steps prior to MS analysis offers untapped opportunities to analyse heterogenous samples outside the areas our own laboratories are working in. In this review we therefore emphasize the concepts underlying tTIMS/MS and various analytical workflows it enables. Our motivation here is to convey numerous opportunities tTIMS/MS offers to the analyst studying complex, heterogenous samples.
Why tandem-ion mobility spectrometry?
Tandem-IMS/MS methods conduct two or more ion mobility separations in series, either tandem-in-space or tandem-in-time, prior to mass analysis.1,23,64–71 The benefits offered by tandem-IMS/MS methods over the traditional IMS/MS methods72–76 that couple a single IMS device with MS become most obvious, in our view, by drawing the analogy to tandem-MS. The significance of tandem-MS77–80 arises from its ability to characterise individual components present in a heterogenous sample. To this end, compounds present in the sample are first separated by differences in their masses; subsequently, the separated compounds are dissociated and characterised by the masses of the generated product ions. Further, by separating the ionization process from that of the energetic activation of ions, tandem-MS enabled the coupling with various types of ion activation methods and tailoring of the activation process to the analytical problem.81
In analogy to tandem-MS, also tandem-IMS separates species present in a mixture but by differences in their ion mobilities instead of their masses; subsequently, the mobility-separated compounds are energetically-activated and characterised by the mobilities and/or masses of the produced ions.
In terms of energetic activation of ions by tandem-IMS, we underline two aspects. First, the ion mobility K is related to its momentum transfer cross section Ω via
where T is the buffer gas temperature, μ the reduced mass, q the ion charge, N the gas number density and kB the Boltzmann constant.10 Thus, the mobility of an ion is sensitive to its mass, charge, and structure. Hence, tandem-IMS methods are able to characterise ion structures without needing to dissociate them. This ability is widely exploited in collision-induced unfolding (CIU) measurements to characterise the structure of proteins using traditional IMS/MS approaches.21,82,83 Second, tandem-IMS methods are most naturally coupled with ion activation methods carried out at the elevated gas pressure of the ion mobility separation (i.e., ~1–10 mbar). Most ion activation methods, however, typically operate at gas pressures of less than 1 mbar because they were traditionally developed for coupling with tandem-MS. Hence, the limited number of methods reported for ion activation in the pressure regime of ion mobility spectrometry currently limits the analytical utility of tandem-IMS approaches.
Nevertheless, tandem-IMS methods have shown promise for studying heterogenous samples.3,23–25,71,84–88 This holds true particularly when tandem-IMS is coupled with a QqTOF mass spectrometer,1,64,85 as is the case for tTIMS/MS or cyclic IMS/MS instruments. For example, tTIMS/MS enables workflows that include two consecutive TIMS and MS separation and ion selection steps, thereby effectively enabling TIMS2-MS2 workflows.3 The cyclic IMS instrument enables IMSn workflows64 in analogy to MSn measurements conducted in ion traps.89,90 Such workflows appear beneficial for the analysis of complex, heterogenous samples as described.3,68
As we discuss in the following sections, tTIMS/MS enables analyses starting from a mixture of native, intact protein complexes, followed by selecting a particular species, and subsequently characterizing (1) its structure by collision-induced unfolding (CIU) and (2) its amino acid sequence and post-translational modifications by top-down analysis.1,3 Top-down protein analysis in tTIMS/MS is currently supported by collision-induced dissociation (CID)1,3 and UV photodissociation (UVPD) conducted in-between the TIMS-1 and TIMS-2 devices at 2–3 mbar of nitrogen gas (discussed below).6
TIMS/MS and tTIMS/MS
A. Overview of current TIMS and tTIMS implementations
Fig. 1 shows an overview of currently reported TIMS and tTIMS implementations. Two different types of TIMS analysers are known: (1) the prototype (research) versions52–62 comprising a 46 mm analyser tunnel; and (2) the TIMS implementation made commercially available by Bruker Daltonics (Billerica, MA) comprising a 96 mm long analyser tunnel.8,63 We refer the reader to excellent recent reviews for a comprehensive discussion of these devices.7–9 Here, we wish to underline that the main difference between these TIMS implementations is the location in which ions are accumulated. The 46 mm prototype (research) version accumulates and mobility-separates ions in the same physical location within the tunnel. By contrast, the 96 mm (commercial) TIMS version accumulates ions in the first half of the tunnel and mobility-separates the ions in the second half. The result is a much greater duty cycle (up to essentially 100%) of the commercial 96 mm version.91 The increased duty cycle is critical for bottom-up proteomics workflows advanced by Mann63,92,93 as well as for other “omics” fields. By contrast, for most native MS studies it is most critical to minimize ion heating which is often easier accomplished with lower duty cycles.1,2,4,52,94–97 Nevertheless, also the commercial version in parallel accumulation mode enables native MS applications as described.5,6
Fig. 1.
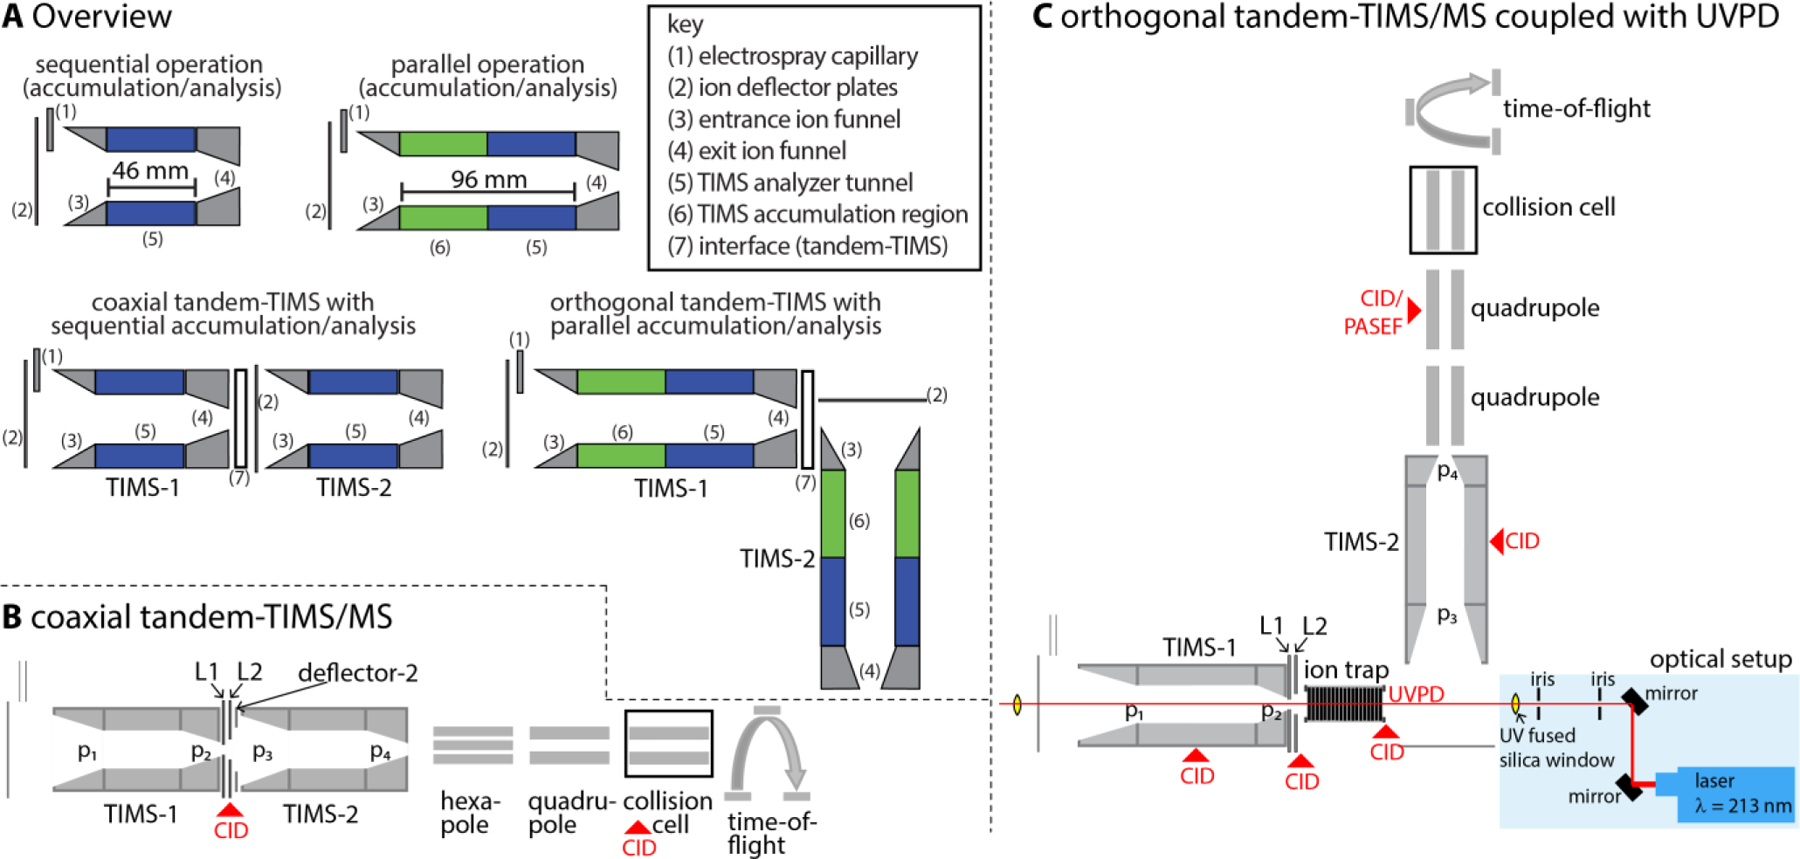
(A) Overview of TIMS and tTIMS implementations. Two TIMS versions were reported: a prototype version comprising a 46 mm analyser tunnel and the commercial version with a 96 mm analyser tunnel. Two tTIMS versions were constructed, the coaxial tTIMS instrument composed of prototype TIMS devices aligned in a coaxial fashion and the orthogonal tTIMS device composed of two commercial TIMS devices aligned in an orthogonal manner. (B) Coaxial tTIMS incorporated in a QqTOF mass spectrometer with ion apertures 1 (L1) and 2 (L2) and deflector-2 for ion gating and activation. (C) The orthogonal tTIMS incorporated in a QqTOF mass spectrometer with a linear ion trap and ion apertures (L1 and L2) inserted for ion storage, gating, and activation. This instrument enables UV photodissociation of ions stored in the trap and collision-induced dissociation of ions in several locations. (p1, p2, p3, p4: entrance and exit pressures of TIMS-1, TIMS-2). Figure 1A reprinted with permission from Anal. Chem. 2020, 92, 16329−16333 (ref 5). Copyright 2020 American Chemical Society. Figure 1C reproduced from ref. 6 with permission from John Wiley & Sons publishing company.
Figs. 1B–C further show schematics of the two tTIMS/MS instruments which are the focus of this review. We constructed the first tandem-TIMS instrument1 by coaxially aligning two prototype TIMS devices and interfacing them by two ion apertures (“coaxial tTIMS/MS”, Fig. 1B). These ion apertures permit differential pumping of the TIMS devices as well as ion mobility-selection and collisional-activation of the mobility-selected ions. Most of our current data regarding operation and application of tTIMS/MS were gained on this instrument. The second, more recent tTIMS/MS was constructed from a commercial timsTOF Pro instrument (Bruker Daltonics, Billerica, MA).5,6 This setup couples two commercial TIMS devices with 96 mm tunnels in an orthogonal manner (“orthogonal tTIMS/MS”, Fig. 1C). Additionally, we inserted a linear quadrupolar ion trap operating at 2–3 mbar in-between the two TIMS devices for coupling with ion activation methods other than collisional-activation. As indicated in Fig. 1C, the orthogonal tTIMS/MS is coupled with a laser operating at a wavelength of 213 nm for UV photodissociation (UVPD).6
B. TIMS operation
A detailed description of TIMS operation is found elsewhere.7–9,52–62 Briefly, a single TIMS cell comprises an entrance funnel, an analyser tunnel, and an exit funnel (Fig. 2). Ions traverse the entrance funnel and enter the “TIMS tunnel” region in which they are accumulated and/or mobility-separated; subsequently the ions traverse the exit funnel to elute from the TIMS device for mass analysis. As mentioned above, the prototype TIMS devices both accumulate and mobility-separate ions in the same physical location of the 46 mm TIMS tunnel shown in Fig. 2. By contrast, accumulation and mobility-separation occur in separate regions of the 96 mm (commercial) TIMS devices.63,91 The operator induces a gas stream through the tunnel with velocity vgas by controlling the pressures at the tunnel entrance and exit (pent and pexit). The operator further controls the voltages on the first and last electrodes of the analyser (vstart and vexit), thereby creating an electric field profile that counteracts the ion motion due to the gas flow: while the gas flow “drags” the ions towards the analyser exit, the electric field pushes them back towards the entrance. As a result, ions are trapped in the TIMS tunnel at the location where the two opposing forces cancel, i.e. ions with different mobilities are trapped at different locations inside the tunnel (Fig. 2). Ions are then eluted from the analyser as the operator decreases the electric field strength at rate β, and are subsequently detected by the mass spectrometer. The mass spectrometer is typically a QqTOF but coupling with an Fourier transform ion cyclotron resonance (FT-ICR) mass spectrometer was also reported.53,98 Ion mobilities and cross sections are obtained by TIMS via a calibration procedure. For small, rigid ions with well-defined structures, the calibrated ion mobilities usually agree within better than 1% of mobilities measured on electrostatic drift tube instruments (which yield cross sections without calibration procedure).54,99 Note that structurally flexible analytes, such as proteins and protein complexes, can adopt slightly different structures depending on the details of the measurement conditions (sample preparation, ionization source, ion heating, measurement time-scale, etc). Hence, ion mobilities (cross sections) measured for such systems typically agree between different laboratories only to within ~5%.1,3,52,94,100–103 Resolving powers observed for TIMS are generally high compared to other types of IMS,7,8,55,56,59,98,104–107 although it should be kept in mind that TIMS resolving powers depend on the mobility of the ion55,57 whereas no such mobility dependence may exist for other types of IMS.11 Additionally, because ion mobility resolving powers generally depend on the measurement conditions (i.e. drift velocity, ion heating, etc), it is not straightforward to directly compare resolving powers measured on different types of IMS instruments. Nevertheless, TIMS does command a significant resolving power combined with a compact instrumental footprint, the combination of which makes TIMS ideally suited for tandem-IMS instruments.
Fig. 2.
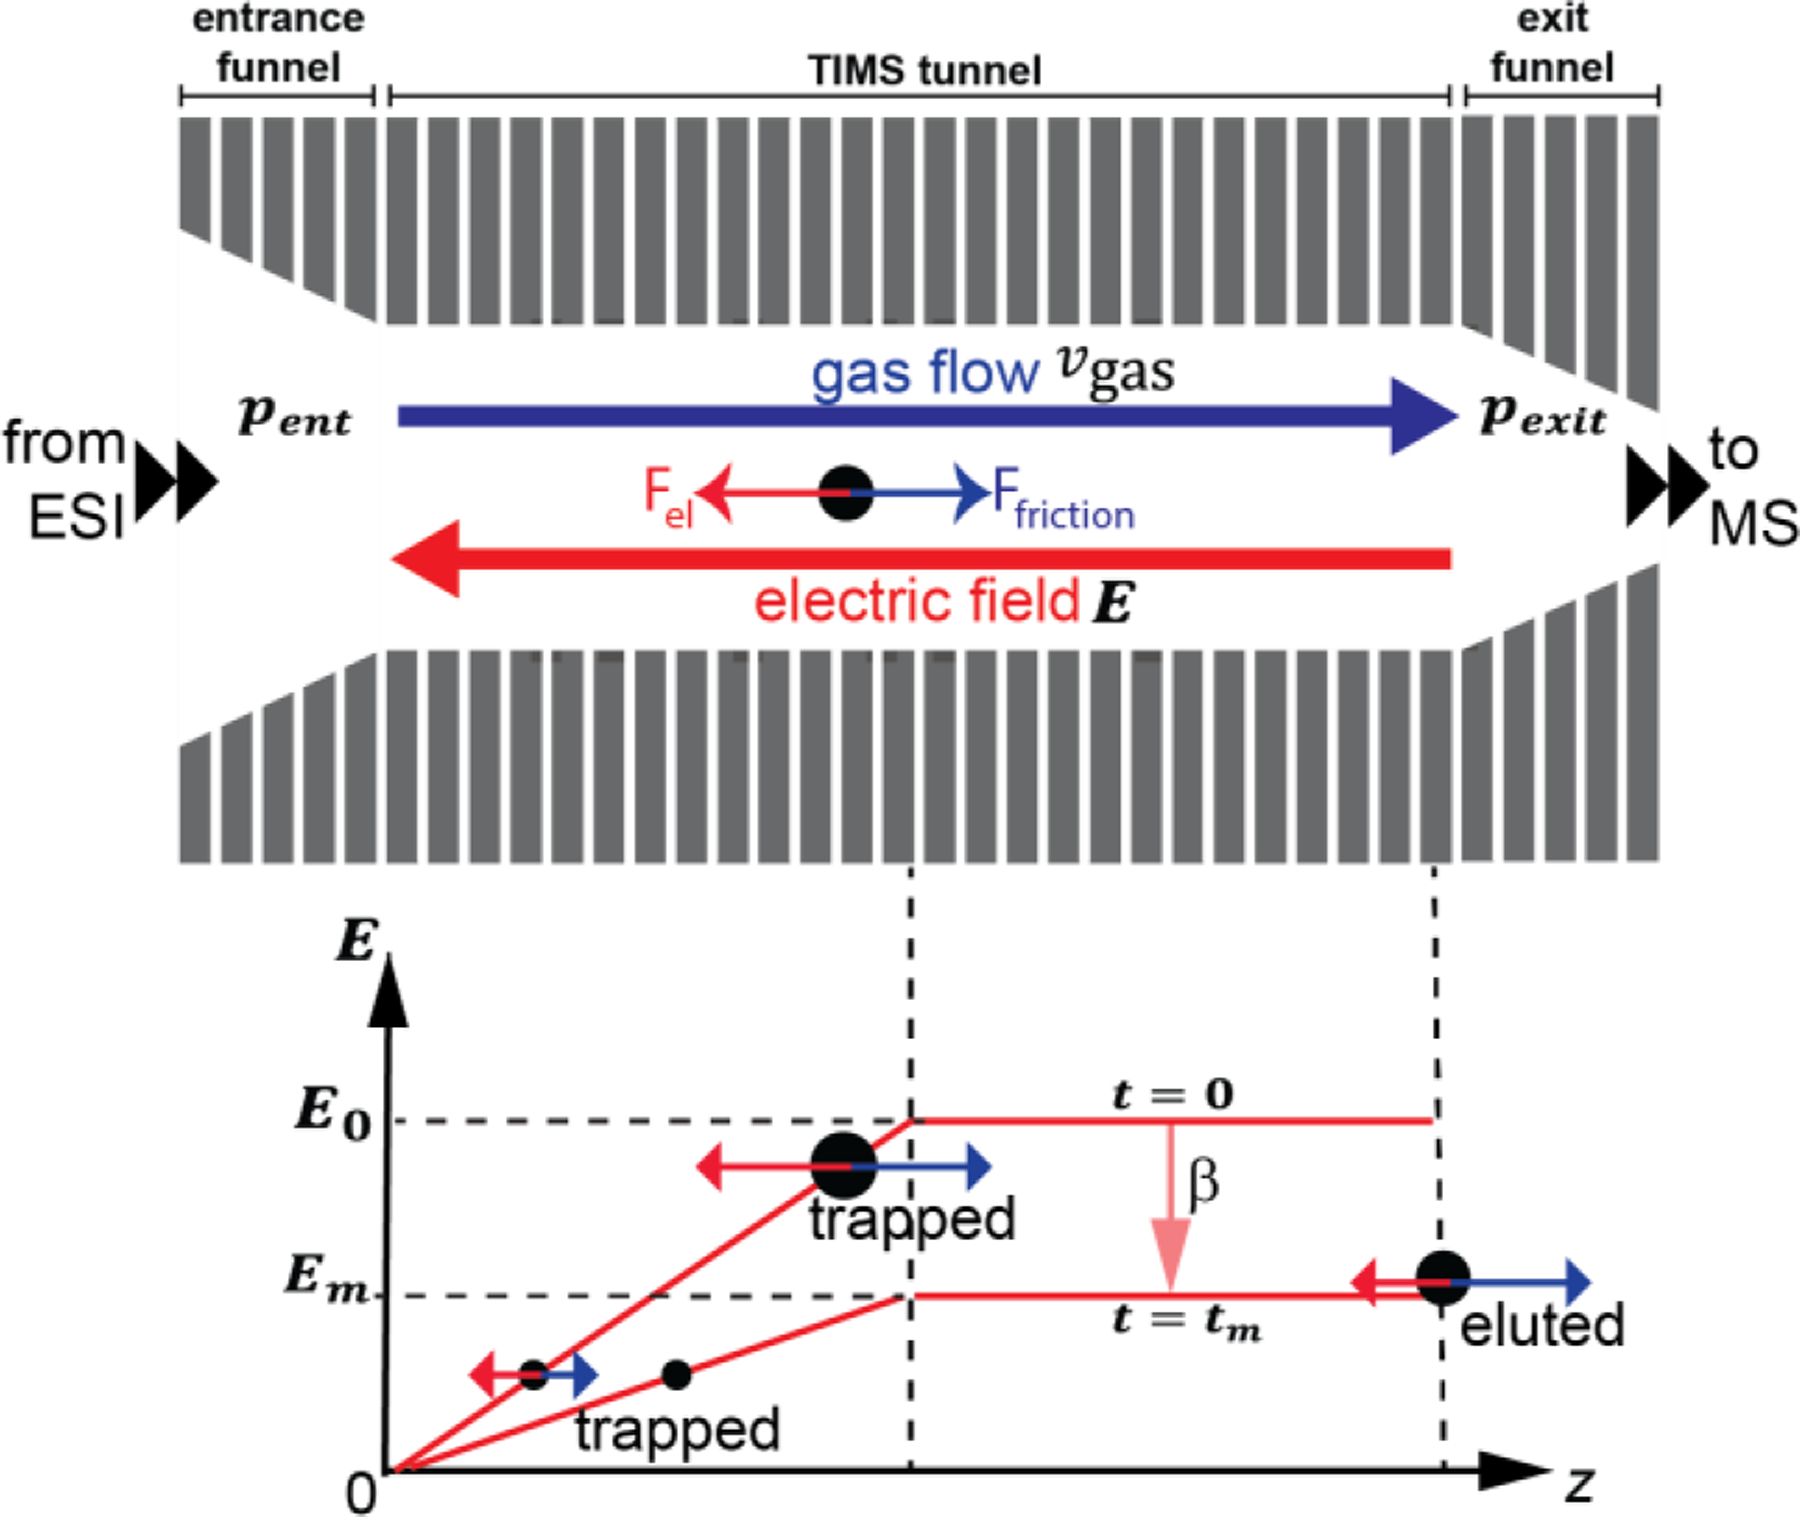
TIMS operation. Ions enter the analyser via the entrance funnel. The pressure difference between the tunnel entrance and exit induces a gas flow that drags ions to the exit (Ffriction, blue). The voltages applied to the first and last electrodes of the analyser tunnel create a force on the ion (Fel, red) that opposes the drag force. The electric field strength increases in the first half of the tunnel and remains constant in the second half. Ions are trapped where the forces cancel, i.e. Ffriction = −Fel. Ions elute from TIMS when the electric field strength is reduced at rate β; ions that no longer experience force-balance move onto the plateau region, and elute from the TIMS analyser via the exit funnel for mass analysis. For clarity, the figure shows a 46 mm TIMS prototype version. Adapted with permission from Anal. Chem. 2018, 90, 9040−9047 (ref 54). Copyright 2018 American Chemical Society.
C. Tandem-TIMS (tTIMS) operation
The tTIMS/MS instruments couple two TIMS devices (Fig. 1). Hence, ions sequentially traverse two TIMS devices. These two TIMS devices are individually controlled and differentially pumped.1,6 The two main considerations of operating any tTIMS/MS instrument are thus (1) how to define the gas-flow through the device; and (2) how to time the operation of each of the TIMS devices and the interface between the two devices (i.e. apertures, ion trap).
In terms of the gas-flow, differential pumping between the two TIMS analysers allows for control of the entrance and exit pressures of TIMS-1 (p1 and p2, see Fig. 1B–C) independently from those of TIMS-2 (p3 and p4, see Fig. 1B–C). Hence, there are two different ways to set the relative magnitude of the exit pressure of TIMS-1 relative to the entrance pressure of TIMS-2. In “forward flow”, the exit pressure of TIMS-1 is larger than the entrance pressure of TIMS-2 (p2 > p3). Ions are then passively transported through the interface region as they are dragged towards TIMS-2 by the flowing gas. This “forward flow” mode limits the entrance pressure of TIMS-2, thereby limiting the TIMS-2 resolving power because it scales with the difference between the entrance and exit pressures (p3 and p4).57,61 Nevertheless, “forward flow” appears most appropriate for native mass spectrometry applications because of the gentle transport of ions through the interface. In “reverse flow” operation, by contrast, the exit pressure of TIMS-1 is lower than the entrance pressure of TIMS-2 (p2 < p3). Hence, the entrance pressure of TIMS-2 is not limited by the exit pressure of TIMS-1 in “reverse-flow” mode, which means that higher resolving powers can be achieved in TIMS-2 than in “forward-flow” mode (Fig. 3). However, ions traversing the interface region are pushed back towards TIMS-1 by the gas flowing through the interface. An accelerating electric potential is thus needed to actively force ions through the interface region in “reverse-flow”. This may activate ions due to energetic ion-neutral collisions in the interface, in analogy to the injection effects reported for drift tubes.28 Hence, “reverse-flow” is rarely used in the Bleiholder laboratory for studies of native protein systems. Nevertheless, the higher resolving power makes “reverse-flow” the natural choice for studies where high resolving powers are critical.
Fig. 3.
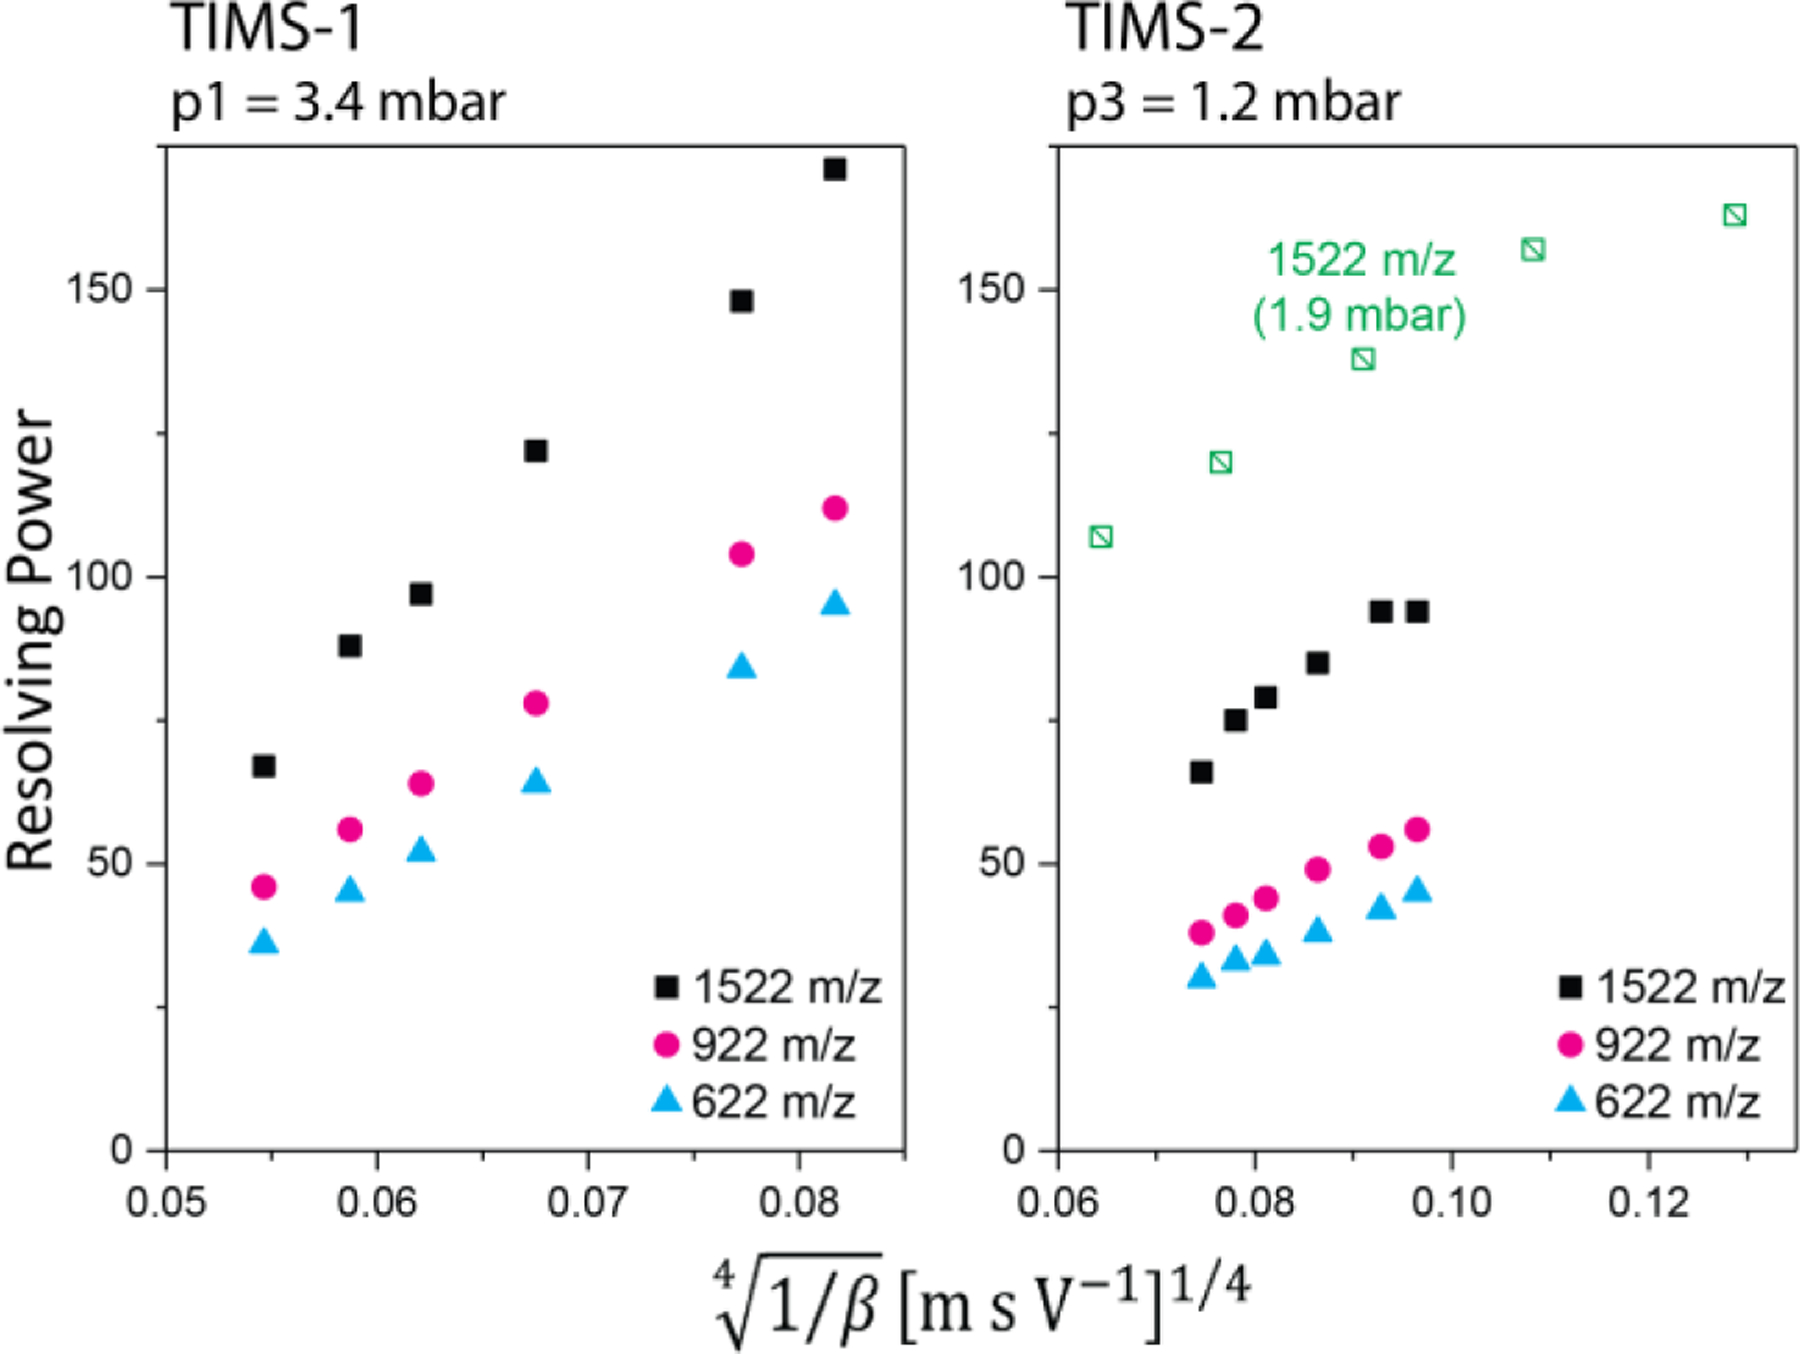
Resolving powers measured for TIMS-1 and TIMS-2 of the coaxial tTIMS/MS for different phosphazenes contained in Agilent ESI tuning mix as a function of the ramp rate β. Greater resolving powers in TIMS-2 are achieved in “reverse-flow” (green squares) than in “forward-flow” mode (black squares, pink circles, blue triangles). Reproduced from ref. 1 with permission from the Royal Society of Chemistry.
In terms of operational modes,1 both TIMS analysers in a tTIMS instrument are individually operated to either (1) transmit ions (without mobility-separation), (2) to mobility-separate ions, or (3) to simultaneously mobility-separate and trap ions over extended time frames. Additionally, the interface region can be set to simply (1) transmit ions, (2) to select ions with mobilities of interest, and/or (3) to activate the ions traversing the interface. Finally, these operational modes can be combined with those of the QqTOF mass spectrometer.3,6 The result is that tTIMS/MS is flexible in terms of the types of analyses it offers and the workflows can often be tailored to the analytical problem at hand (Fig. 4).
Fig. 4.
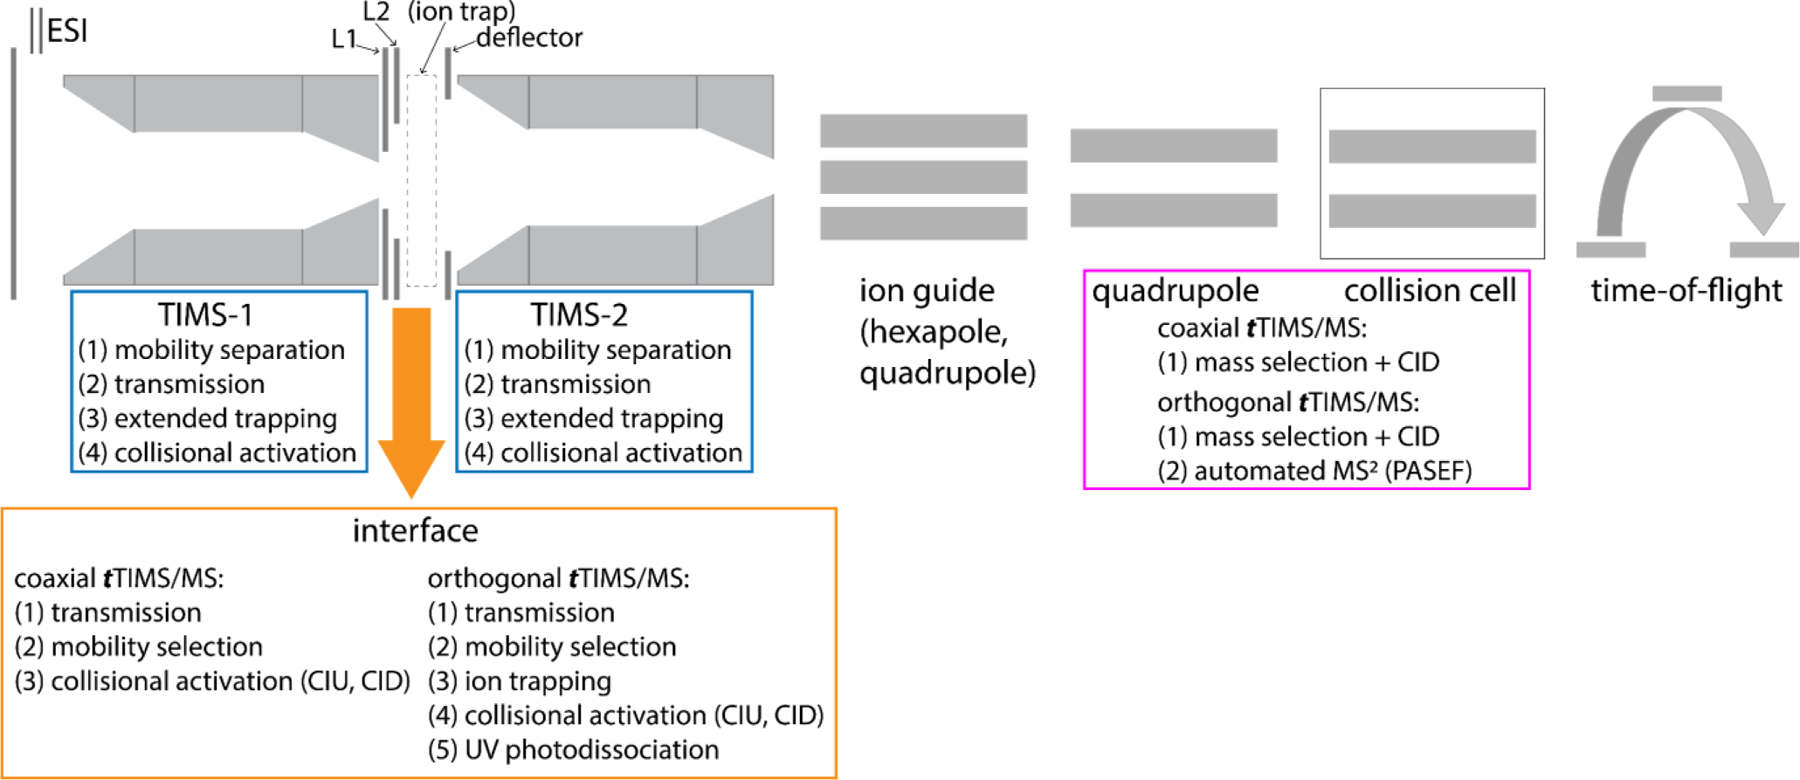
Overview of operational modes offered by tTIMS/MS instruments. By combining operational modes of the various instrument components (i.e. TIMS-1, interface, TIMS-2, QqTOF), tTIMS/MS instruments offer a variety of analysis workflows. The tTIMS/MS operational modes depicted in the Figure are showcased in this review.
D. Technical novelties in tTIMS/MS
Two of the most useful assets of tandem-IMS instrumentation in general are the abilities to select ions with specific mobilities and to subsequently energetically activate the mobility-selected ions. Hence, technical advancements must be made in tTIMS/MS to facilitate mobility selection and ion activation in the interface between the two TIMS cells under the pressure conditions compatible with ion mobility analysis.
In the coaxial tTIMS/MS,1 mobility-selection and energetic activation is accomplished by timing the potentials on three ring electrodes (aperture-1 (L1), aperture-2 (L2), and the deflector electrode of TIMS-2). The two ion apertures L1 and L2 with diameters of 2 mm and 5 mm, respectively, were inserted at short distances (1–2 mm) between the exit funnel of TIMS-1 and the deflector of TIMS-2 (Fig. 1B). DC-only elements are present in the interface to ensure a pure dc electric field. Ion gating is carried out by applying either a transmitting dc bias or a blocking dc bias at the ion apertures. The short distances between the electrodes allow collisional-induced activation of protein systems even at relatively low dc voltages.1 To enable collisional activation of larger proteins such as avidin (64 kDa), two nickel microgrids were subsequently installed at aperture-2 and deflector-2 to increase the electric field strength experienced by the ions traversing the interface.3 We stress that the pressure in this interface is compatible with ion mobility measurements (2–3 mbar) and significantly higher than what is common for CID.81
In the orthogonal tTIMS/MS,5,6 mobility-selection is conducted at ion apertures L1 and L2 between TIMS-1 and the linear ion trap in a manner analogous to the coaxial tTIMS/MS (Fig. 1). Ion activation, however, can be achieved in the orthogonal tTIMS via collisional activation at several locations and additionally via UV photodissociation (UVPD) as indicated in Fig. 1C. UVPD was implemented by installing a linear quadrupolar ion trap between ion aperture L2 and the deflector of TIMS-2, and by attaching a UV laser setup to the ion trap (Fig. 1C). The linear ion trap consists of 75 PCBs with a quadrupolar RF electric field. Ions are stored when a blocking dc field is applied at the last electrode of the ion trap. The pressure regime utilized in the ion trap (2–3 mbar) is compatible with those of the TIMS analysers. This ensures gentle ion transport through the entire tTIMS for native MS studies because injection of ions from a lower-pressure into a higher-pressure region is unnecessary. The softness of the linear quadrupolar ion trap was demonstrated by trapping ubiquitin 7+ ions for up to ~1 s which revealed negligible unfolding of the stored ions. The setup for UVPD6 includes a solid-state nanosecond Nd:YAG laser (λ = 213 nm), two dielectric coated mirrors and two iris diaphragms (Fig. 1C). UV photons were created with an energy of up to 0.2 mJ/pulse at a repetition rate of 1000 Hz and enter the tTIMS instrument via a UV fused silica window proximal to the linear ion trap. Irradiation of the ions stored in the trap by the UV photons generated a significant number of fragment ions (discussed below).6
Retention of native-like structures in TIMS/MS and tTIMS/MS
A. Softness as a figure of merit in ion mobility spectrometry and its significance for structural studies of biological systems
The first general point we wish to make relates to “softness” of an ion mobility measurement. The “softness” in ion mobility refers to the internal energy that is imparted into analyte ions during the measurement process due to acceleration by the applied electric fields and translational-vibrational energy transfer arising from inelastic ion-neutral collisions. The “softness” is a critical figure of merit in any ion mobility measurement because of the following two reasons.
First, if one is interested in studying solution structures of biological species defined by weak noncovalent interactions, such as peptide or protein systems, one must eliminate all factors that energize these systems during the ion mobility measurement (Fig. 5).28,108 The reason why “softness” is so critical here is that, given enough time and energy, biological molecules assume vastly different structures in the gas phase of an ion mobility spectrometer than they do in their native biological environment (Fig. 5).26–28,109 Due to the high dielectric constant of their native environment,110,111 conformations of biomolecules tend to expose hydrophilic regions to the solvent but bury hydrophobic regions in the interior (“hydrophobic core”). The opposite occurs in the gas phase, where the dielectric constant is low. Here, hydrophilic regions are “charge-solvated” in the interior while hydrophobic patches are exposed on the molecular surface.26,109 Nevertheless, practice has shown that solution-phase structures can be studied by IMS/MS when the ions become kinetically trapped close to their solution structures.4,24,28,49,67,112–114 On a qualitative basis, the kinetic trapping of solution phase structures can be rationalized by presuming a large activation barrier associated with breaking and then re-forming hydrogen-bonds and salt-bridges during the structural denaturation process.4,109
Fig. 5.
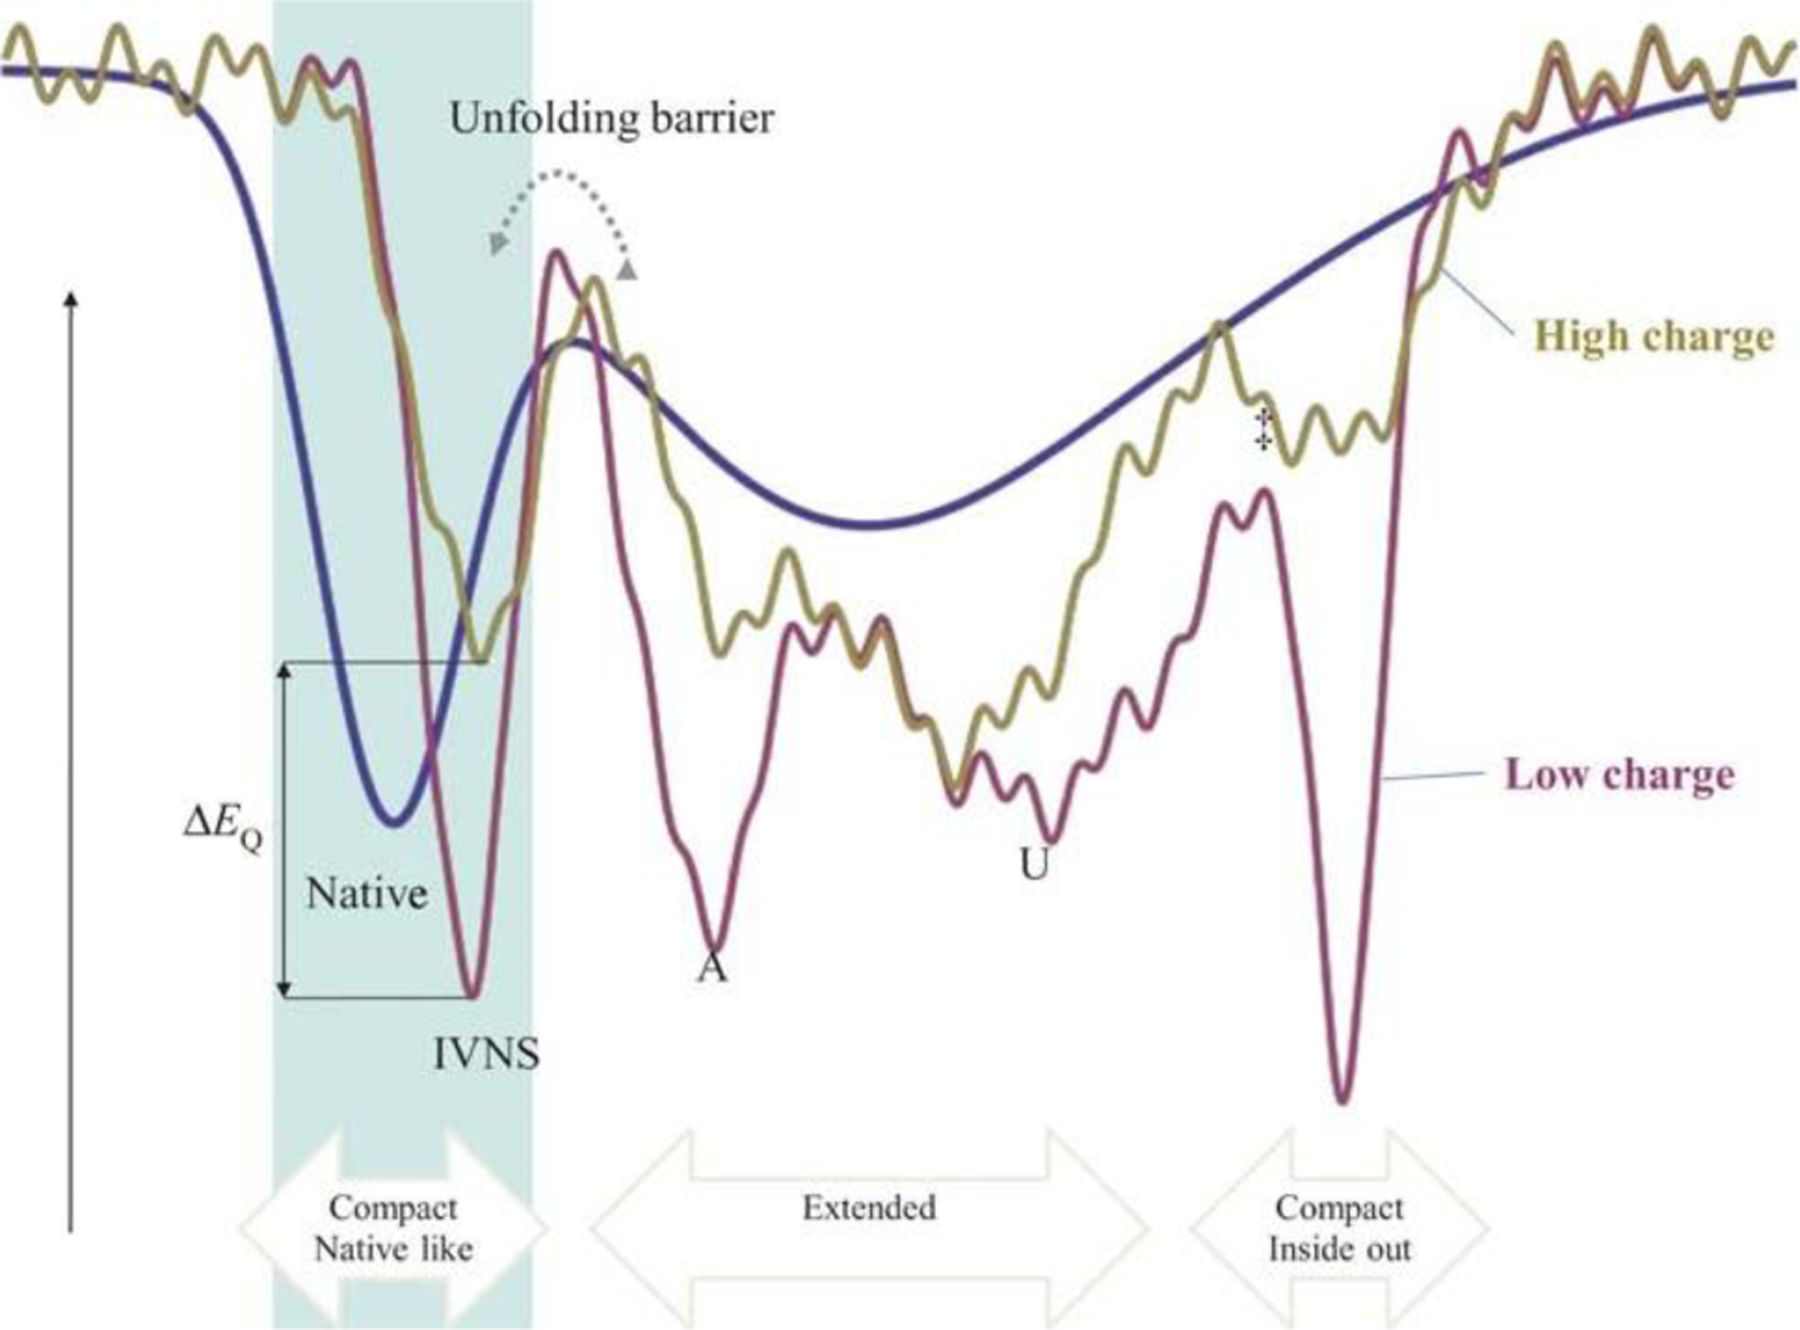
Structure-relaxation of a protein structure in the gas phase after desolvation. Protein native structures are metastable in “soft” ion mobility spectrometry experiments but are not retained close to their solution structure in “harsh” experiments. The time-scale of the denaturation reaction depends on the charge state of the protein ion. Reproduced from ref. 109 with permission from John Wiley & Sons publishing company.
Following from the above considerations, the key to retaining native-like structures of biological macromolecules by IMS/MS is to reduce the efficiency of structural rearrangements in the gas phase. This can be accomplished by minimizing the kinetic energy gain between two ion-neutral collisions. As discussed,52 the kinetic energy gain ΔEkin due to an applied dc-electric field between two collisions scales according to
| (1) |
where q and m are the charge and mass of the ion, E is the electric field strength accelerating the ion, and δt the time between two collisions. Here, a dc-only electric field exerting a force on the ion was assumed but, at least conceptually, the extrapolation of Eq. (1) to a generic accelerating force F composed of contributions from ion-ion interactions, axial dc-, and radial rf- electric fields is straightforward (Fig. 6B–C). The mass and charge of the analyte ions can usually not be (trivially) modified and there are often constraints as to the range in pressure that the instruments can be operated under. Hence, the guiding principle to maximizing the softness in TIMS is to minimize the force F acting on the analyte ion due to the applied electric fields and ion-ion interactions.5,52,115
Fig. 6.
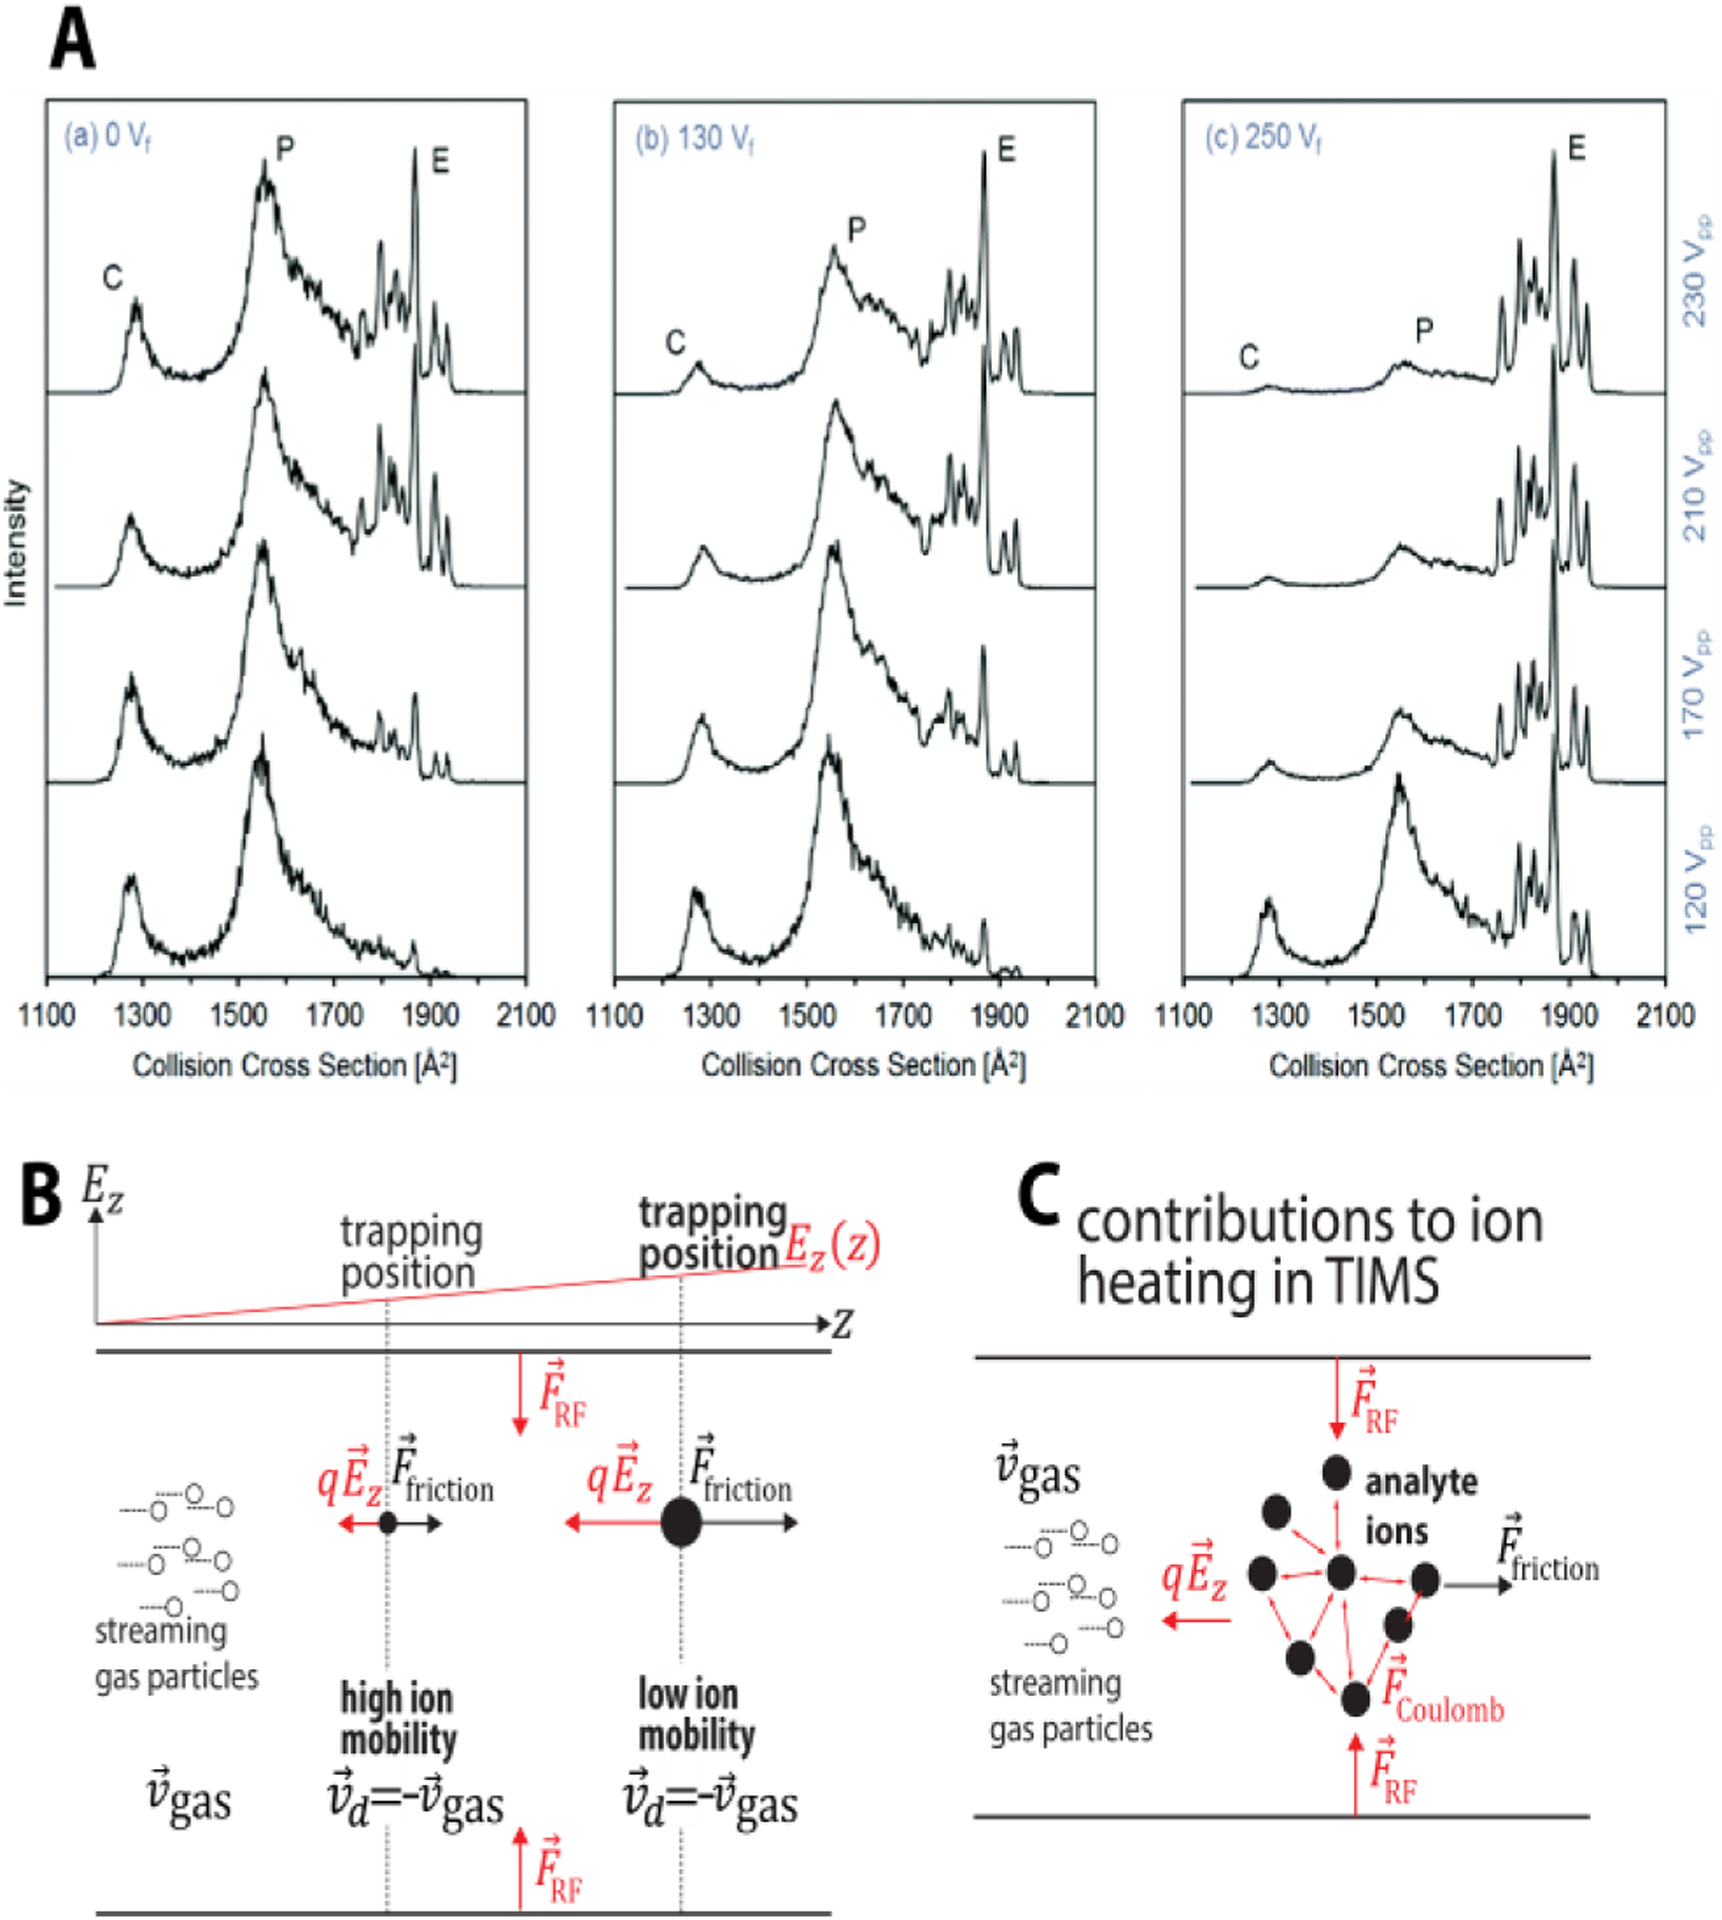
(A) Ion heating of the protein ubiquitin in the entrance funnel of TIMS for various applied dc voltage (Vf) and peak-to-peak rf voltage amplitude (Vpp) alters the distribution of compact (C), partially folded (P) and elongated (E) structures. (B) Ions are trapped axially and radially in TIMS. Axially, ions are trapped along an electric field gradient at different equilibrium positions z where the force on the ion due to Ez is offset by the friction caused by collisions with the gas particles. Radially, ions are trapped by an applied RF electric field. (C) DC field heating, long-range ion−ion repulsion and power absorption from the RF electric field may contribute to the ion-neutral collision energy, thereby contributing to the structural denaturation of biological analytes during the measurement. Figure 6A reproduced from ref 122 with permission from the Royal Society of Chemistry. Figure 6B–C reprinted with permission from Anal. Chem. 2020, 92, 16329−16333 (ref 5). Copyright 2020 American Chemical Society.
The second reason “softness” is critical is that the momentum transfer cross section of an ion (and thus its mobility) depends on the ion-neutral collision energy:10,58 the cross section decreases non-linearly with effective ion temperature (mean collision energy).33,113,116–121 Hence, when ion mobility measurements are conducted under different effective temperatures, their measured cross sections differ even in the absence of any structural changes. This dependency of the cross section on the ion-neutral collision energy could thus potentially introduce a systematic error for “omics” studies that seek to identify ions based on matching measured cross sections to reference cross sections tabulated in a database.
B. Maximizing softness / minimizing ion heating in TIMS/MS and tTIMS/MS measurements
As summarized,5 the collision energy in TIMS arises from forces due to the axial dc and radial rf electric fields and ion-ion interactions (Fig. 6B–C). Evidences suggest that the contribution of the axial field to the collision energy depends strongly on the location inside the TIMS devices.52,122 Significant ion heating due to the axial dc-electric field was reported for the entrance and exit funnel regions.52,122,123 As shown in Figure 6A, increasing the dc voltage and the peak-to-peak rf voltage amplitude in the entrance funnel significantly increases the abundance of elongated ubiquitin 7+ ions.122 On the other hand, the effect of axial dc-electric field on the ions trapped inside the analyser tunnel appear to be minor.52,122 Park calculated, and experimentally corroborated, that gas velocities in TIMS are on the order of ~120–150 m/s for typical pressure settings.61 As described,5 these gas velocities suggest that the axial electric field contributes to the translational ion temperature by ~15–25 K in nitrogen. Such minor contributions to the collision energy caused by the axial electric field in the tunnel region are supported by the facts that mobilities calibrated in TIMS52,54,60,94,122 and tTIMS1–6 are within the error of drift tube mobilities116,124 for protein systems and peptide assemblies. Our successfully developed sample-independent calibration method for TIMS54 lends further support for generally minor axial field heating.
Space-charge effects and the radial trapping by rf-electric fields can cause ion heating throughout the TIMS device (Fig. 6C) under certain conditions. These effects increase with the (charge) density of the trapped ions and the amplitude of the applied radially confining rf-electric potential.5,52,55,122 For example, we observed that charge state 7+ of the protein ubiquitin progressively unfolds due to space-charge effects and/or rf power absorption when the ion density in the TIMS analyser is increased.52 For the reason mentioned above, also “omics” studies are advised to pay attention to ion heating when utilizing cross sections for ion identification. Prior work suggests that a critical figure of merit in this context is the charge capacity of the TIMS device.8,91
Overall, however, the TIMS/MS and tTIMS/MS instruments shown in Fig. 1 can, in our experiences, be operated in a sufficiently “soft” manner to characterise native-like structures of protein systems. In fact, our work on the structure relaxation approximation (SRA) method underlines that even small proteins like ubiquitin4 and the chemokine CCL596 largely retain their native residue-residue interactions in TIMS/MS and tTIMS/MS when optimised, soft conditions are used. Note that instrument settings must generally be optimised for the biological analyte under investigation. We further underline that instrument parameters providing optimal “soft” settings are usually not the most favourable in terms of other analytical figures of merit, such as IMS or MS resolving power or instrument sensitivity.
C. Preserving native-like structures of monomeric proteins
We demonstrate the softness of TIMS/MS and tTIMS/MS instruments in Fig. 7, which depicts cross-section distributions recorded for the small proteins ubiquitin1,52 (8.6 kDa) and cytochrome c (12.4 kDa).115 For charge state 6+ of ubiquitin, all spectra exhibit a single feature with cross sections in close agreement with the value reported by Bowers from a drift tube measurement (1200 Å2, Fig 7A).116 One main peak and a broad feature are observed for charge state 7+; also these features show cross-sections in close agreement with one another and with the drift tube values reported by Bowers (1270 Å2, Fig. 7A and 7B). The spectra for charge state 8+ show one major sharp and one broad feature with cross sections again consistent with those reported by Bowers (1300 Å2 and 1670 Å2, Fig. 7A and 7B).116 Cross sections measured for a convex TIMS geometry, beneficial for studying high molecular weight species, are also consistent with drift tube cross sections.94 Overall, these observations strongly indicate that the TIMS operating conditions used to record the spectra shown in Fig. 7 largely prevent structural denaturation of ubiquitin ions in the gas phase.
Fig. 7.
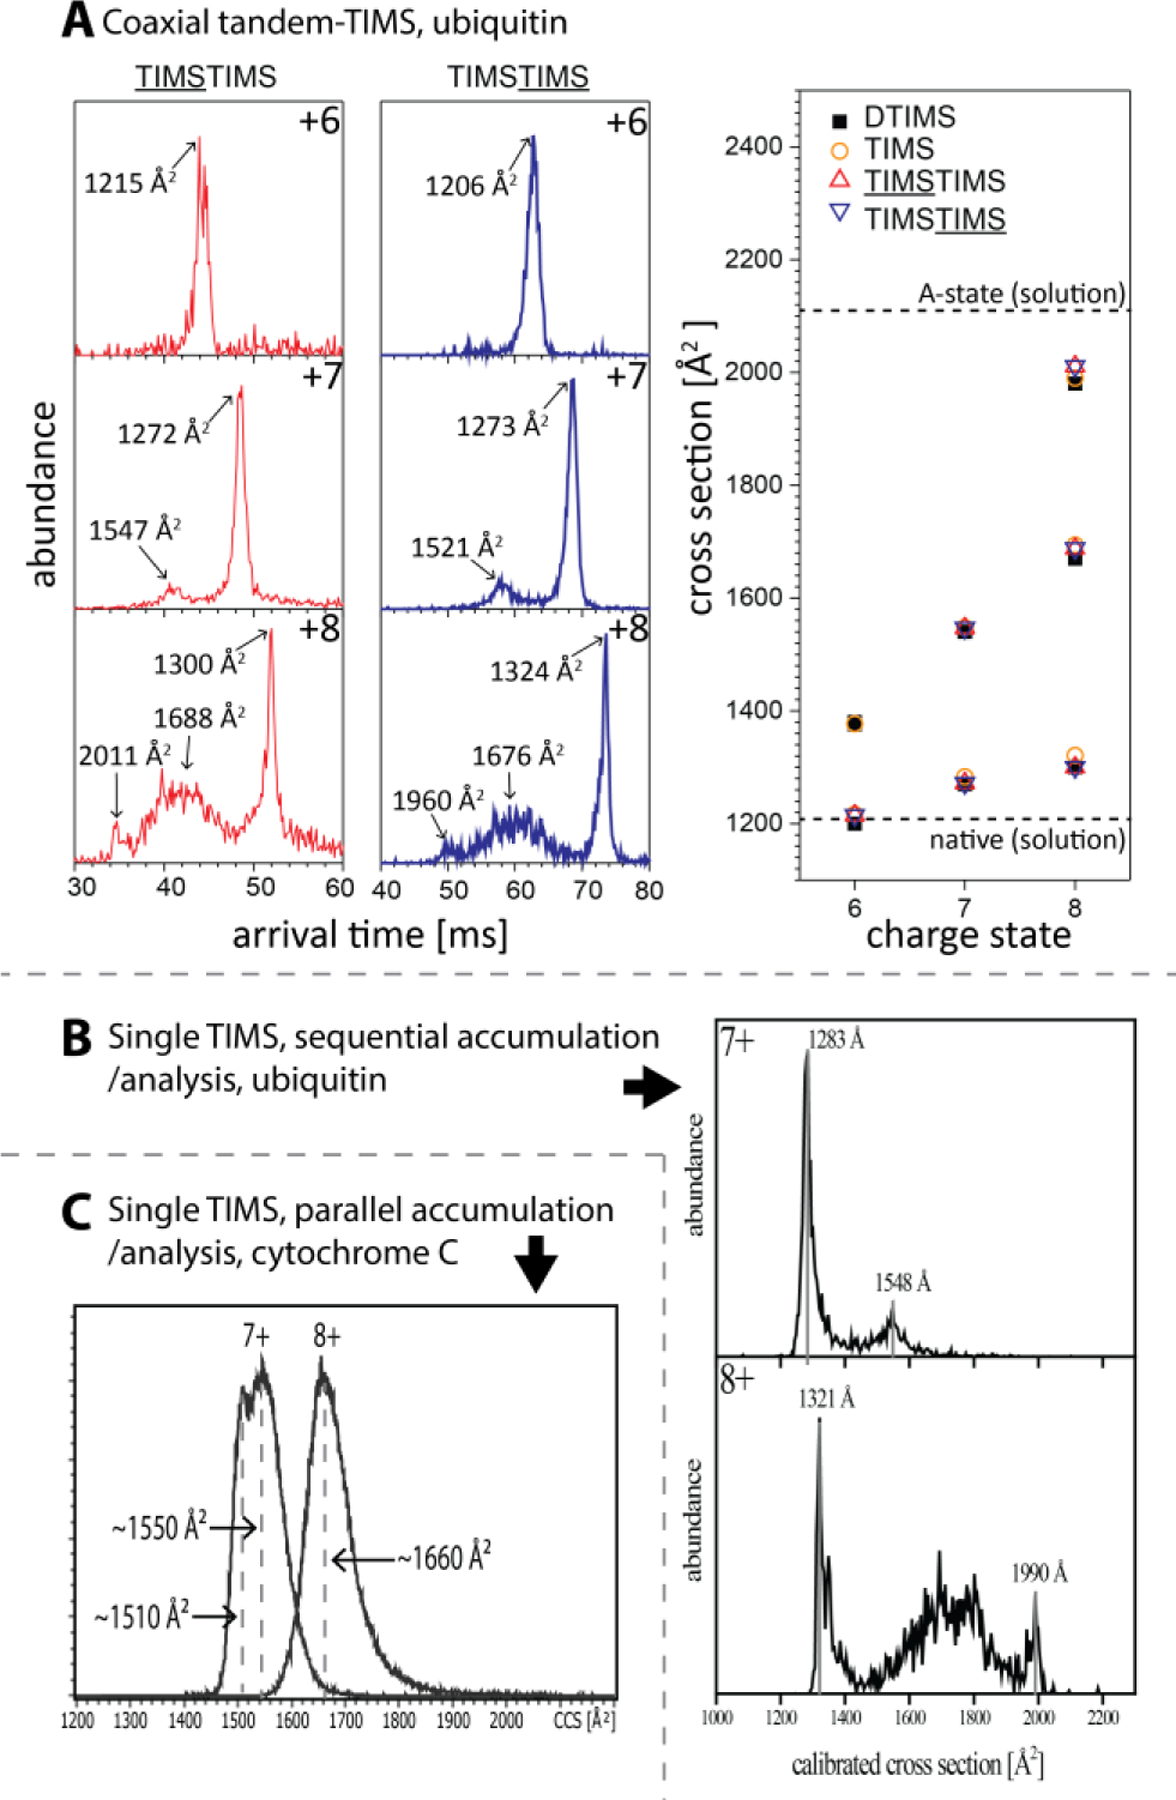
(A) “Soft” TIMS spectra recorded for charge states 6+, 7+, and 8+ of ubiquitin on the coaxial tTIMS instrument are consistent with those observed on “soft” drift tubes. (B) “Soft” TIMS spectra recorded for charge states 7+ and 8+ of ubiquitin (46 mm prototype TIMS) are consistent with those observed on “soft” drift tubes. (C) “Soft” TIMS spectra recorded for charge states 7+ and 8+ of cytochrome c on a commercial timsTOF Pro are consistent with those observed on “soft” drift tubes. Figure 7A adopted and 7B reproduced from refs. 1 and 52 with permission from the Royal Society of Chemistry.
Also the orthogonal tTIMS/MS instrument, which is built based on commercially available timsTOF Pro instrument, can be operated in a sufficiently soft manner to retain native-like protein structures.5,6 We recorded the ion mobility spectra for charge states 7+ and 8+ for cytochrome c on a commercial timsTOF Pro instrument using optimised soft settings (Fig. 7C). The spectrum for charge state 7+ shows a broad feature displaying two apexes at approximately 1510 Å2 and 1550 Å2. These cross sections are in line with cross sections of ~1550 Å2 and ~1590 Å2 observed on drift tube instruments,103,124 those recently reported from the Barran group100 using an Agilent 6560 showing two features at around 1481 Å2 and 1540 Å2, respectively, and the value of 1476 Å2 reported from a modified TIMS device.94 Our timsTOF cross sections for cytochrome c are further in close agreement with the cross section calculated for its native structure determined by x-ray scattering (~1565 Å2).103 For cytochrome c charge state 8+, the timsTOF spectrum displays a broad feature centred at ~1660 Å2 (Fig. 7C). Also, this cross section agrees well with the main feature of 1629 Å2 recorded by the Barran group for charge state 8+ on an Agilent 6560 instrument.100 We stress that, in contrast to prior reports using a timsTOF instrument,123,125 peaks with cross sections in the range of 1800 Å2 to 2300 Å2 corresponding to unfolded cytochrome c structures are not present in Fig. 7C. Further, we recently demonstrated that the orthogonal tTIMS/MS instrument6 produces spectra for charge state 7+ of ubiquitin (main peak at 1275 Å2) consistent with those reported by Bowers’ drift tube value (main peak at 1270 Å2). Overall, the available evidences indicate that timsTOF instruments can be operated sufficiently “soft” to enable native IMS/MS studies.
D. Preserving noncovalent peptide assemblies and protein complexes in TIMS/MS and tTIMS/MS measurements
When investigating weakly-bound, noncovalent assemblies of peptides and proteins, two separate issues regarding ion heating must be considered.108 First, suitable conditions must be found to retain the structure of the noncovalent assembly prior to and during the IMS separation. Additionally, however, the noncovalent assembly must also survive to detection after elution from the IMS device.
When intact peptide or protein assemblies elute from tTIMS operating in a “soft” manner, they traverse several instrument components before they arrive at the TOF mass analyser (Fig. 1). The assemblies can gain internal energy and dissociate while traversing these instrument components, in which case spurious ions are detected that have the ion mobility (K0) of the intact assembly precursor ion but the mass and charge (m/z) of the dissociated fragment ions.2 For example, if a dimer elutes from tTIMS and subsequently dissociates into a monomer in the collision cell, the operator detects ions with the masses and charges of the monomeric fragments but the ion mobility of the dimeric precursor. Obviously, such an ion does not exist and the detected signal thus corresponds to a spurious ion, obfuscating interpretation of the data. This is a general phenomenon observed also on other IMS/MS instruments.126,127 Based on our experiences, these dissociation reactions can occur in post-tTIMS instrument components that operate at intermediate pressure regimes;2 the operator should be particularly careful in tuning the region comprising the exit funnel and the hexapole ion guide where the pressures drop from ~1–2 mbar to ~10−5 mbar. Here, ion mean-free-paths can be sufficiently large such that ions would gain substantial kinetic energy between ion-neutral collisions even under seemingly low electric field strengths (see Eq. 1).
Nevertheless, even the tetramer of the nonapeptide bradykinin can be successfully retained using optimized “soft” instrument settings in post-tTIMS components (Fig. 8A, amino acid sequence RPPGFSPFR).2 While some ion dissociation in the collision cell of the tTIMS/MS instrument of some labile species is difficult to prevent, charge state 1+ of bradykinin shows the presence of singly-charged monomer, doubly-charged dimer, triply charged trimer, and a quadruply-charged tetramer. This spectrum is consistent with those reported by Bowers73 and Clemmer35 (except for the presence of a single spurious ion caused by partial dissociation of the triply-charged dimer in the collision cell).
Fig. 8.
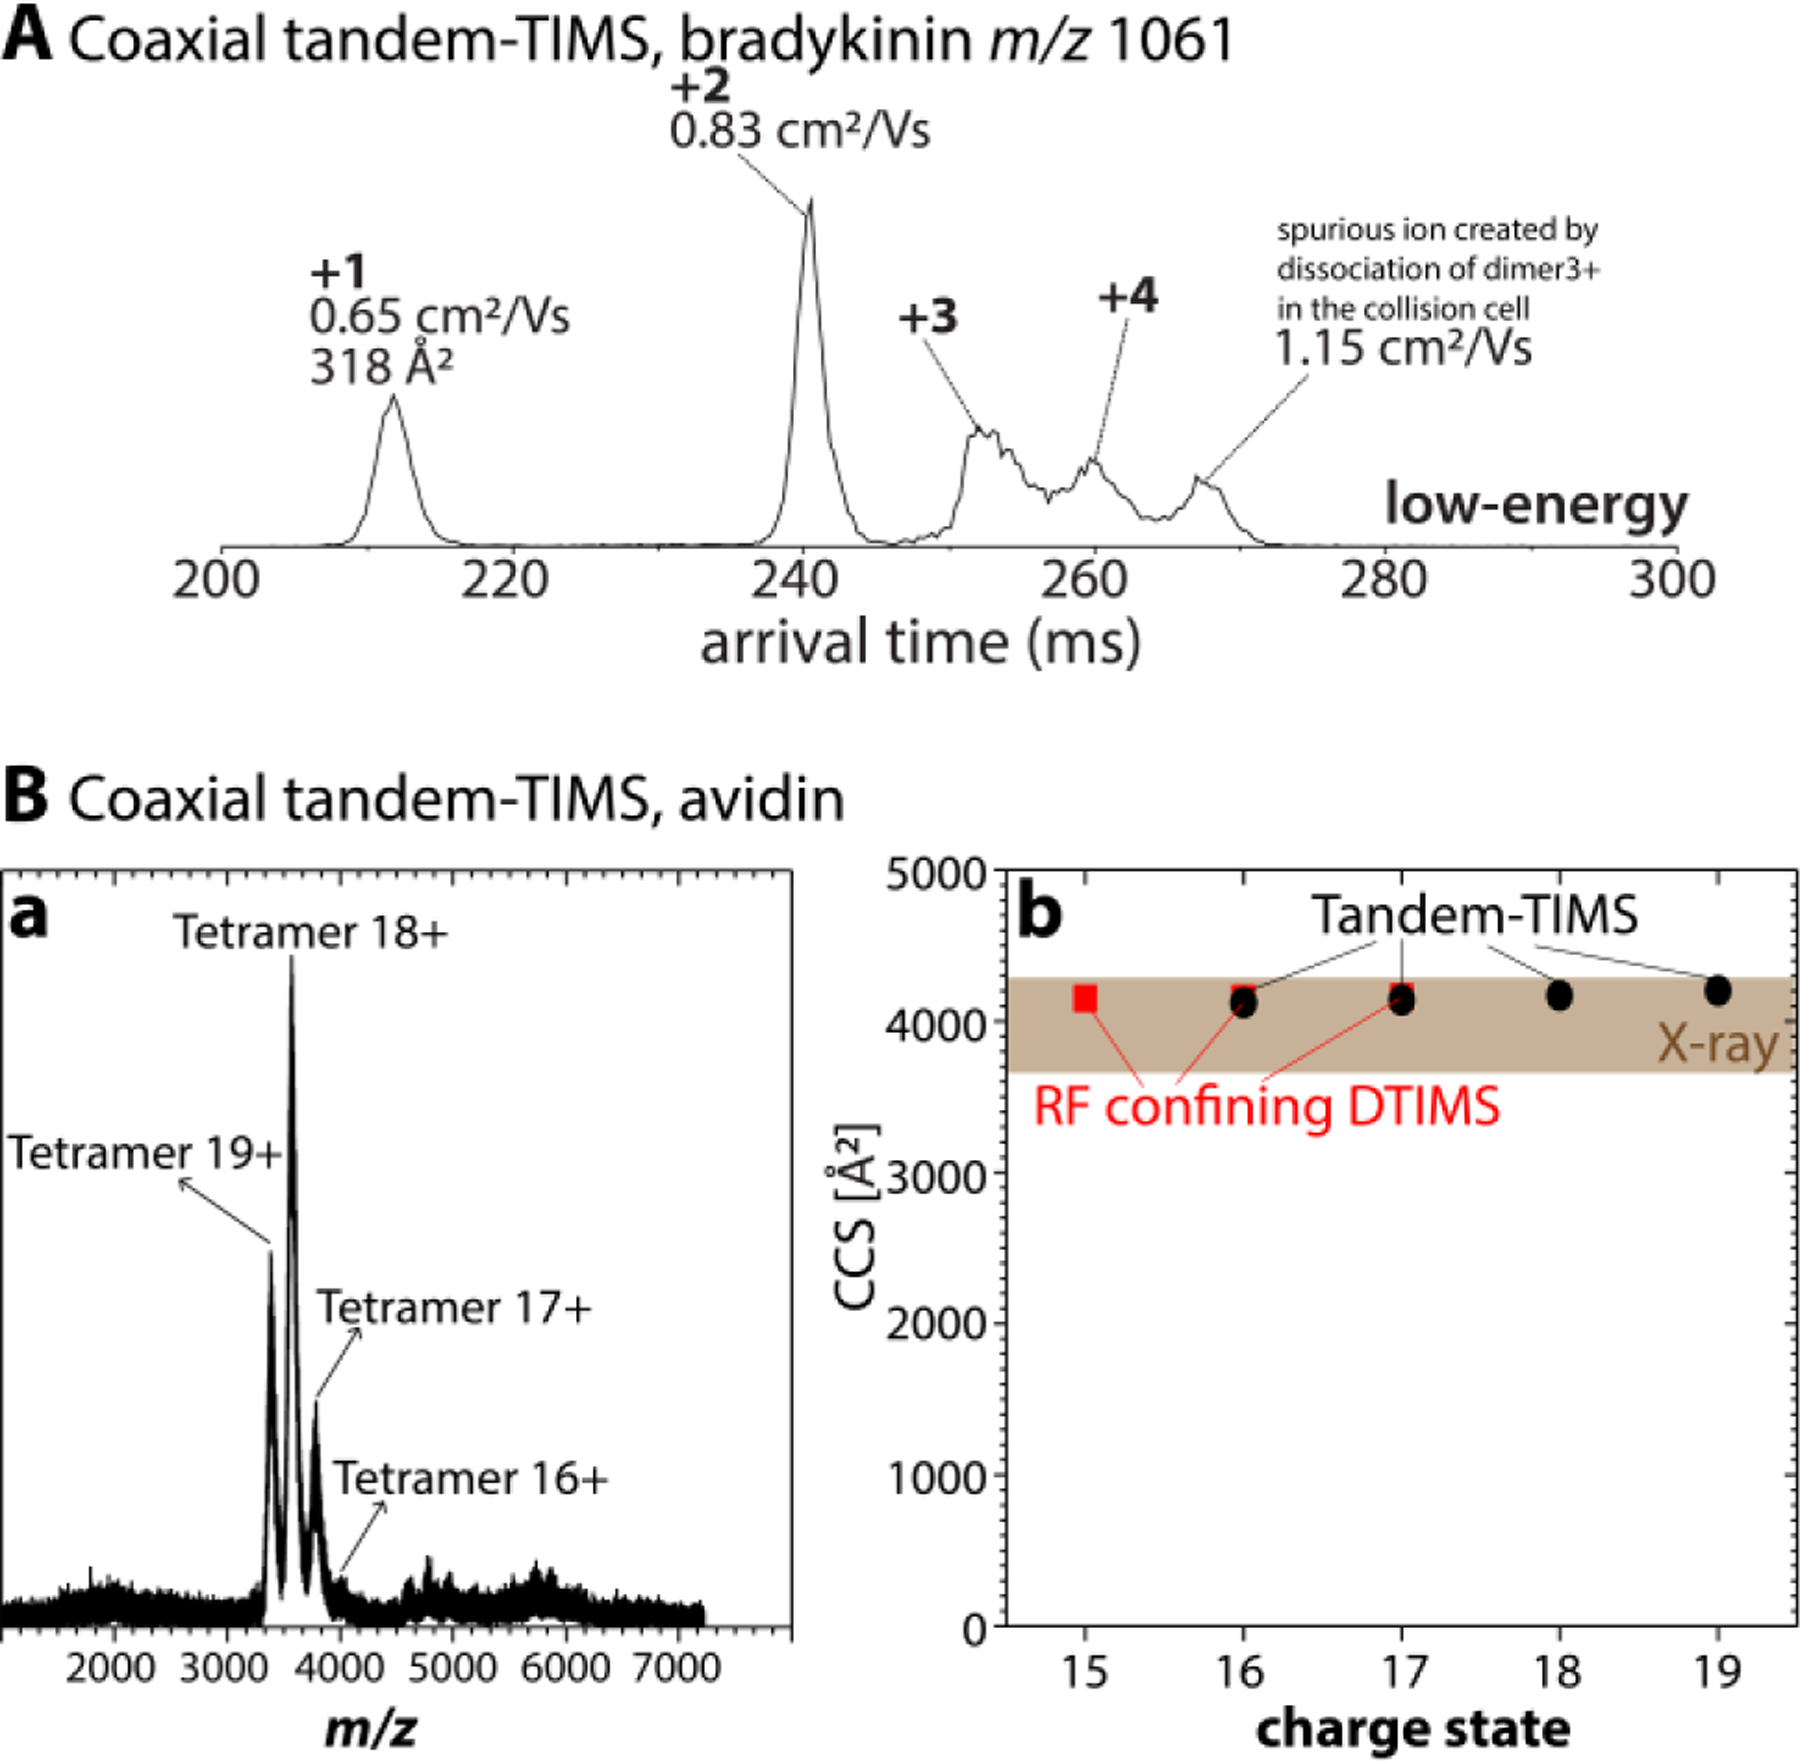
(A) Arrival time distribution recorded on the coaxial tTIMS/MS for m/z 1061 of bradykinin under “soft”-tuned post-tTIMS settings. The features correspond to bradykinin monomers, dimers, trimers, and tetramers. (Only a single spurious ion apparent as a compact monomer with a reduced ion mobility K0 ≈ 1.15 cm2/Vs is observed.) (B) Mass spectrum recorded on the coaxial tTIMS/MS shows intact avidin tetramers with charge states 17+ to 19+ predominating. Corresponding cross sections recorded by tTIMS (black circles) agree with cross sections obtained on a drift tube (red squares) and those calculated by the PSA method for the X-ray structures (shaded). Figure 8A adopted with permission from J. Am. Soc. Mass Spectrom. 2019, 30:1204–1212 (ref 2). Copyright 2019 American Chemical Society. Figure 8B reprinted with permission from Anal. Chem. 2020, 92, 4459−4467 (ref 3). Copyright 2020 American Chemical Society.
Assemblies of larger proteins are significantly more stable than the weakly-bound assemblies of the nonapeptide bradykinin. Fig. 8B shows the mass spectrum recorded on our coaxial tTIMS/MS instrument under optimized, “soft” settings for avidin,3 a homotetrameric protein complex exhibiting one of the strongest known binding constants. The mass spectrum shows three dominant peaks between ~3200 to ~4000 m/z that correspond to avidin tetramers with charge states 17+ to 19+; Fig. 8B further shows that the cross sections for these charge states (CCSN2 = 4089−4178 Å2 for 16+ to 19+, respectively) agree well with cross sections recorded on a drift tube (CCSN2 = 4150−4160 Å2, charge states 15+ to 17+)124 and those calculated by the projection superposition approximation (PSA) method32,128–130 for avidin tetramer x-ray structures. Furthermore, the cross sections observed by tTIMS/MS increase only marginally (<3 %) with increasing charge state (16+ to 19+). Overall, these observations imply that avidin is kinetically trapped in a folded, native-like conformation during these tTIMS/MS measurements. We stress that the orthogonal tTIMS/MS instrument constructed from a timsTOF Pro reproduces these cross sections as well.5 Overall, our experiences underline that both the coaxial and the orthogonal tTIMS/MS instruments are suited to investigate structures of noncovalent assemblies of peptides and proteins.
Selection of mobility-separated ions
A critical aspect of any tandem-IMS instrument is the ability to select ions with a specific ion mobility prior to energetic activation and subsequent mobility-separation.
In tTIMS/MS, selection of ions with specific ion mobilities is carried out by gating the ions immediately after they leave the exit funnel of TIMS-1 (see Fig. 1). We first demonstrated the ability of tTIMS/MS to select ions within a specific range of mobilities using the nonapeptide bradykinin (Fig. 9).1 To this end, bradykinin ions were mobility-separated in TIMS-1 and transmitted through the interface and TIMS-2. The resulting ion mobility spectrum of bradykinin charge state 1+ (m/z 1061) displayed multiple features which were assigned as the singly-charged monomer and multiply-charged oligomers of bradykinin (c.f. Fig. 8A). To select only the monomeric ion for transmission through the interface, the required delay and duration of the ion gate was determined from the arrival time distribution shown in Fig. 9A. In choosing the delay time and duration, it is important to note that the arrival times shown in Fig. 9A reflects the time (TOF pulse) at which the ions arrive at the detector whereas the ion selection occurs in the interface. Thus, the time t0 that the ions take to traverse through TIMS-2 and the mass spectrometer must be subtracted from the observed time when selecting the ion gate delay. The time t0 is typically on the order of ~5–10 ms on the coaxial tTIMS/MS. Hence, in the example shown in Fig. 9, a transmitting dc voltage was applied at aperture-2 between 7.2 ms and 17.3 ms, resulting in the selective transmission of the monomer peak detected between ~16 ms and ~26 ms (Fig. 9B).
Fig. 9.
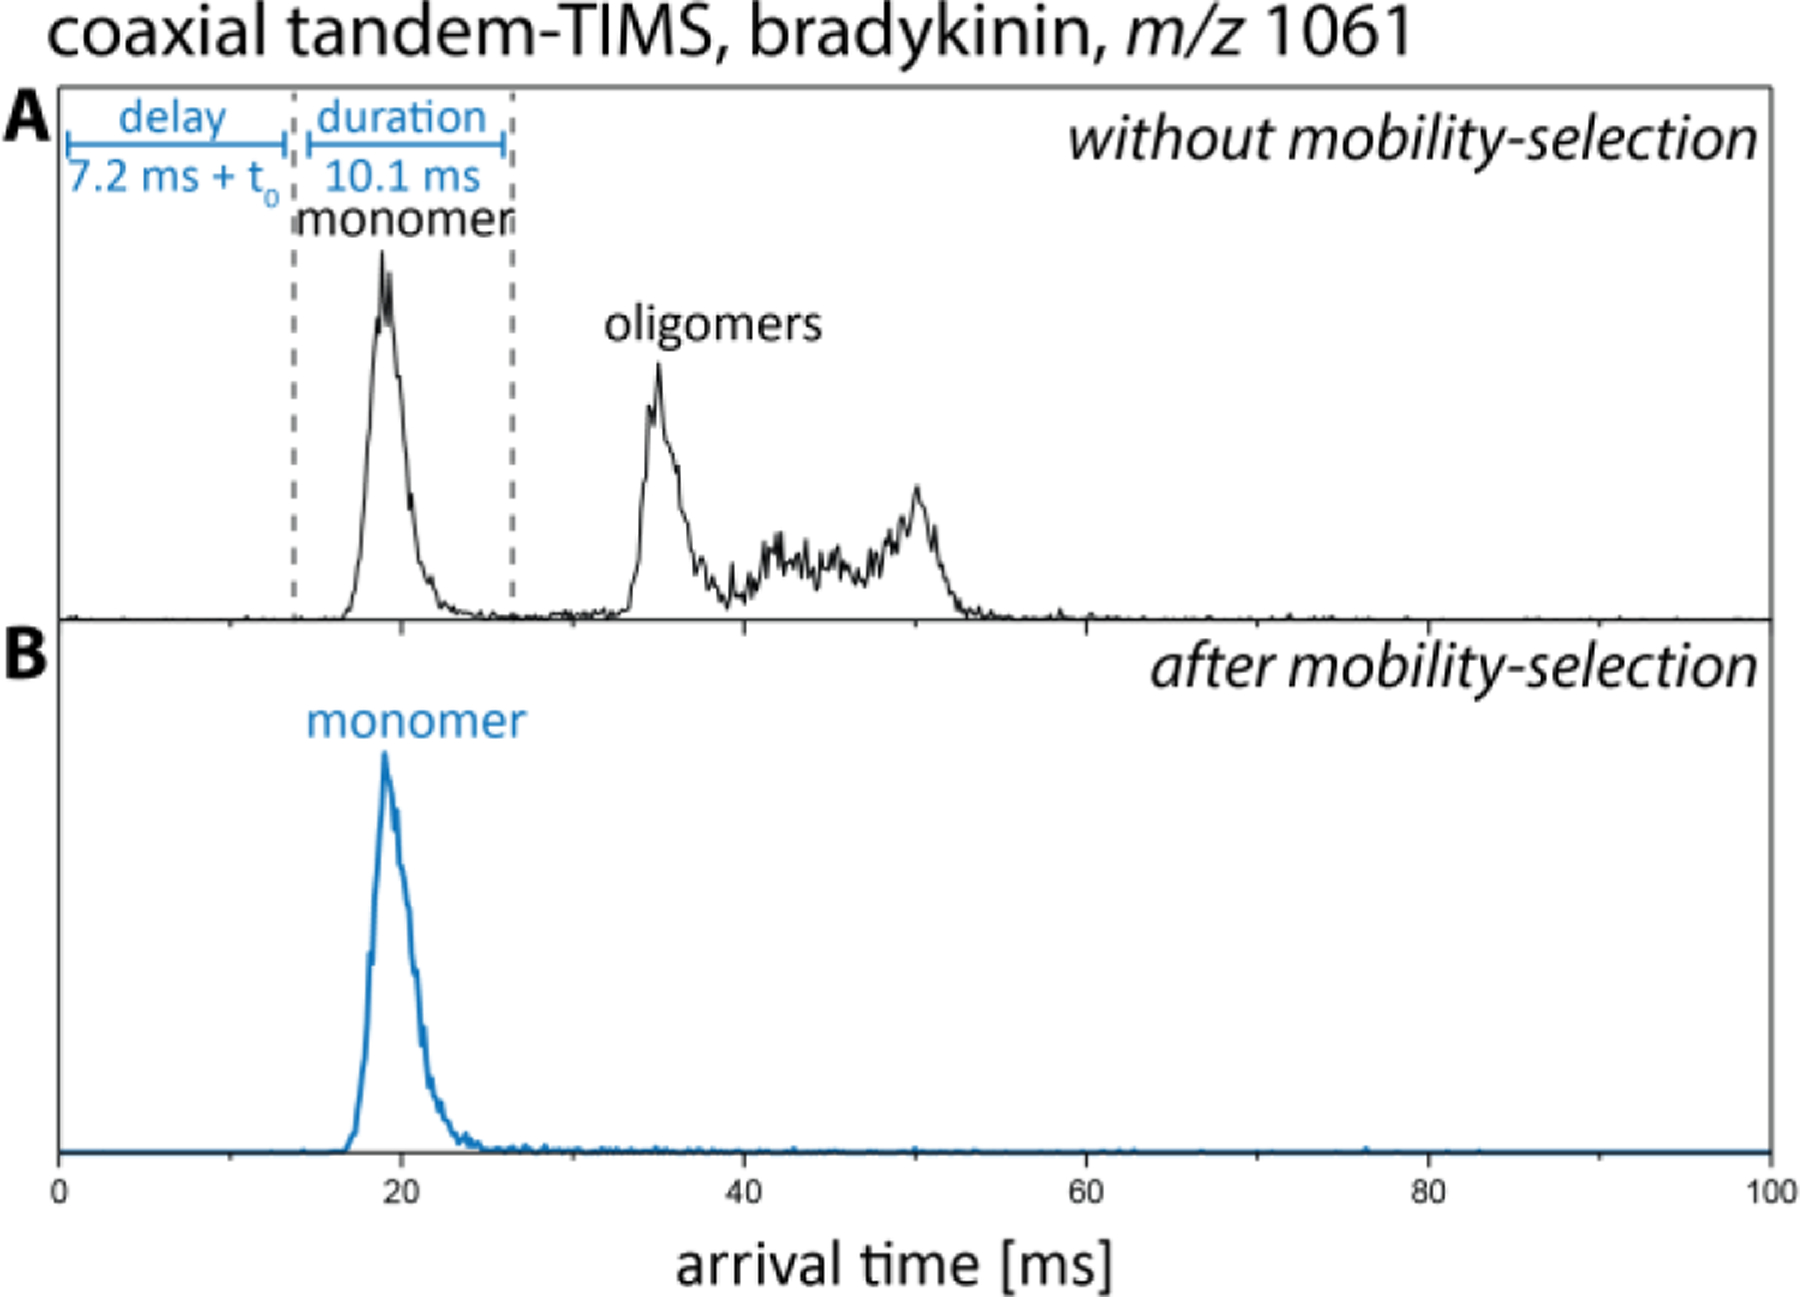
Mobility selection of singly charged bradykinin monomer in the coaxial tTIMS/MS. (A) Arrival time distribution of bradykinin 1+ shows several distinct peaks (black trace). (B) To select the monomer, a transmitting dc voltage is applied at aperture-2 for a duration of 10.1 ms after a delay time of 7.2 ms (blue trace). Reproduced from ref. 1 with permission from the Royal Society of Chemistry.
With respect to native IMS/MS applications, the most powerful application of mobility-selection is, in our view, the ability to pick out a specific conformational or constitutional isomer from a mixture of isomers and selectively interrogate its structure. In analogy to Clemmer’s prior work on the small protein ubiquitin,23–25 we thus applied tTIMS to mobility-select specific isomers of the avidin tetramer.3 Fig. 10a plots the arrival time distribution for charge state 18+ upon mobility separation in TIMS-1 but transmission-only in the interface region and TIMS-2. The resulting peaks in the ion mobility spectra are broad. Next, several regions within this broad peak were mobility-selected to allow only a specific set of ions to pass into TIMS-2. As shown in Fig. 10b, these mobility-selected “slices” reconstruct the shape of the original peak, underscoring the ability of tTIMS to probe ions with well-defined ion mobilities from a mixture of ions. Next, the structural changes of the mobility-selected ions were probed by conducting a second mobility analysis in TIMS-2. Fig. 10c compares the full avidin tetramer peak to nine selected “slices” upon mobility analysis in TIMS-2. The plot confirms that the full tetramer peak can be represented as a sum of individual mobility-selected regions. The data thus show that the selected ions retain their mobilities and relative abundances. Furthermore, the corresponding nested ion mobility-mass spectra of the selected ions show that an increase in cross section correlates with an increase in mass (Fig. 11). Thus, the mobility-selected regions reproduce the asymmetry noticed in the nested ion mobility/mass spectrum of the tetramer precursor (Fig. 11A). These observations revealed that the avidin tetramer is best described as a heterogeneous ensemble composed of a multitude of tetramer species with different ion mobilities and masses that do not interconvert on the ~100 ms time scale of the tandem-TIMS measurement.
Fig. 10.
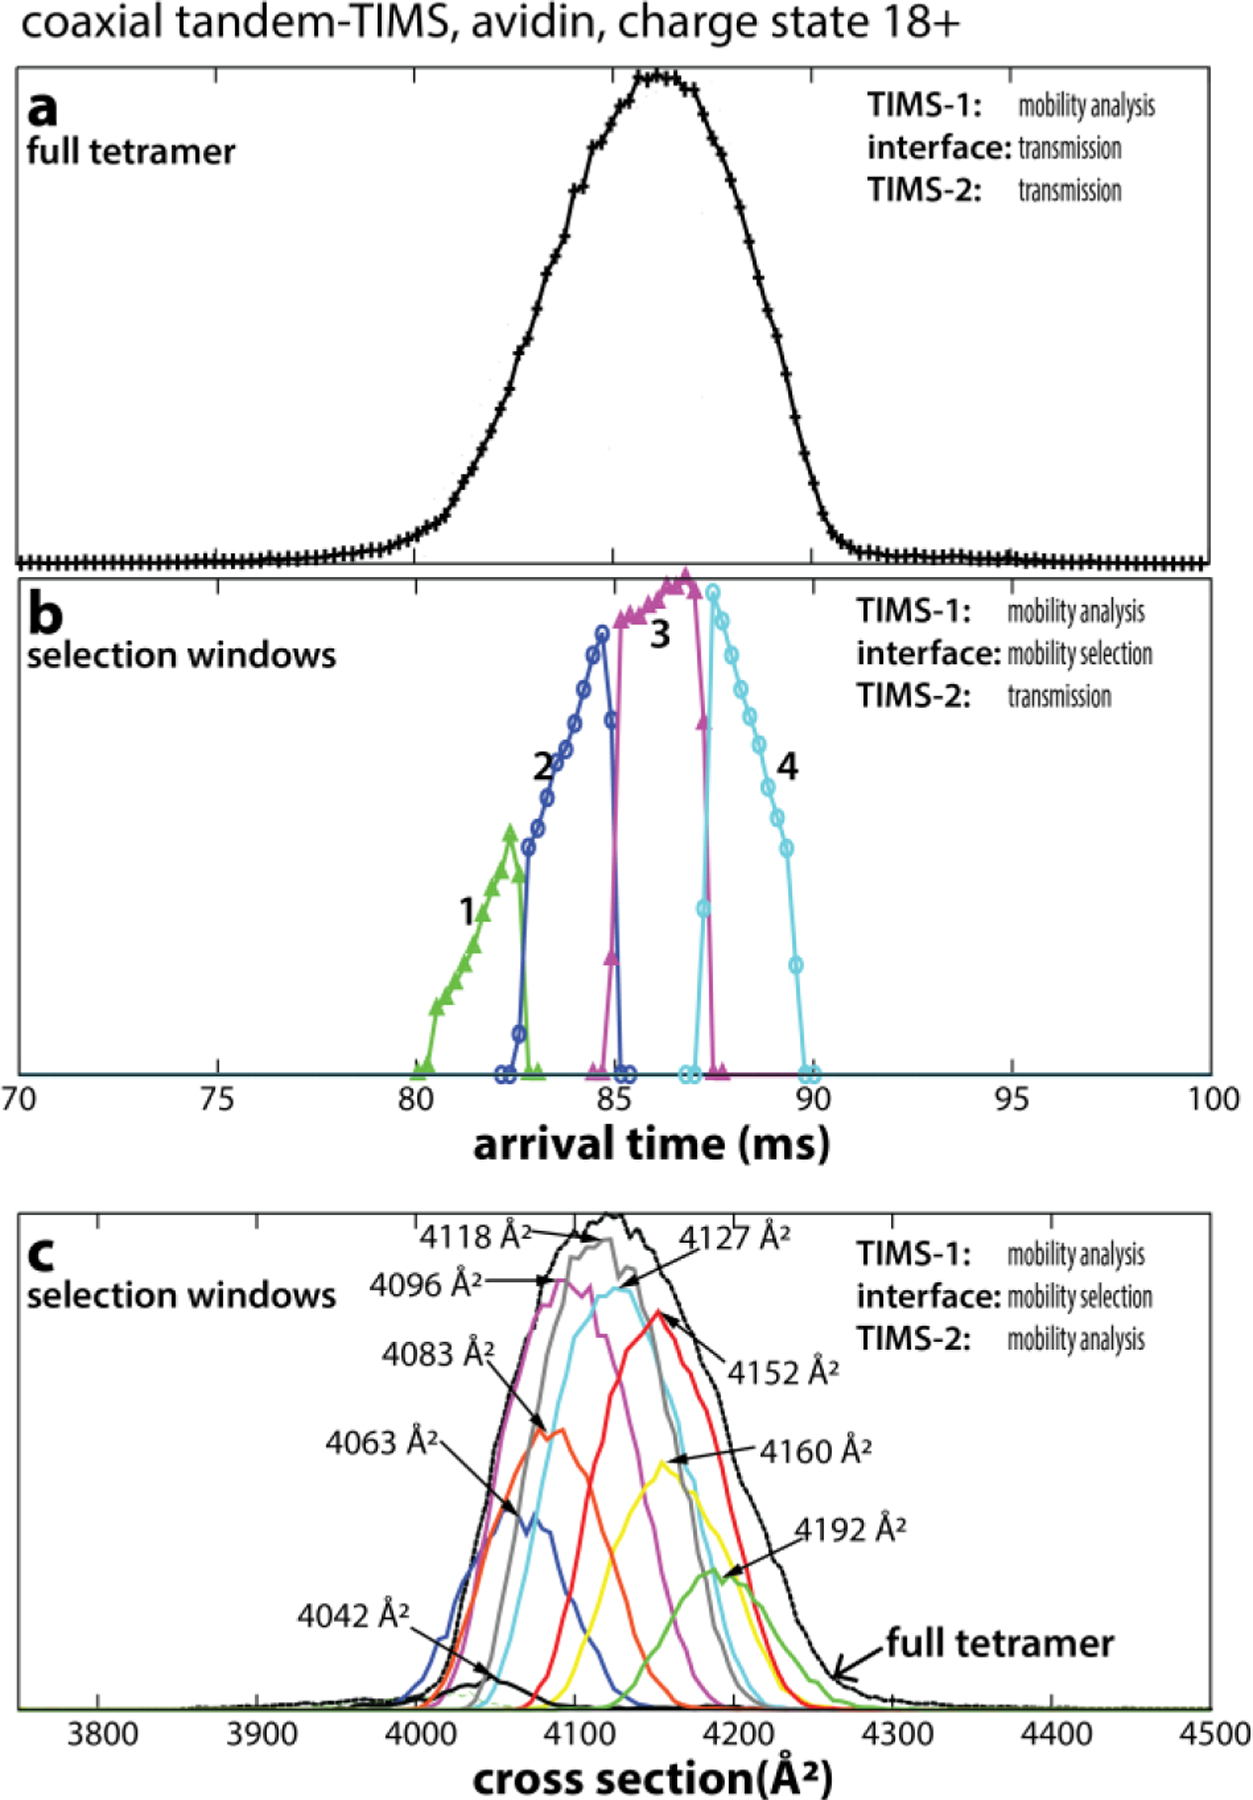
(A) A broad peak is observed for avidin tetramers 18+ upon mobility analysis in TIMS-1 using the coaxial tTIMS/MS. (B) Four mobility windows (“slices”) within tetramer 18+ are selected by ion gating in the interface and transmitted through TIMS-2. The mobility-selected regions reconstruct the shape of the full tetramer 18+ peak shown in (A). (C) Nine mobility “slices” are selected in the interface and mobility-analysed in TIMS-2. The overlay of mobility-selected peaks reconstructs the full tetramer 18+ peak. Reprinted with permission from Anal. Chem. 2020, 92, 4459−4467 (ref 3). Copyright 2020 American Chemical Society.
Fig. 11.
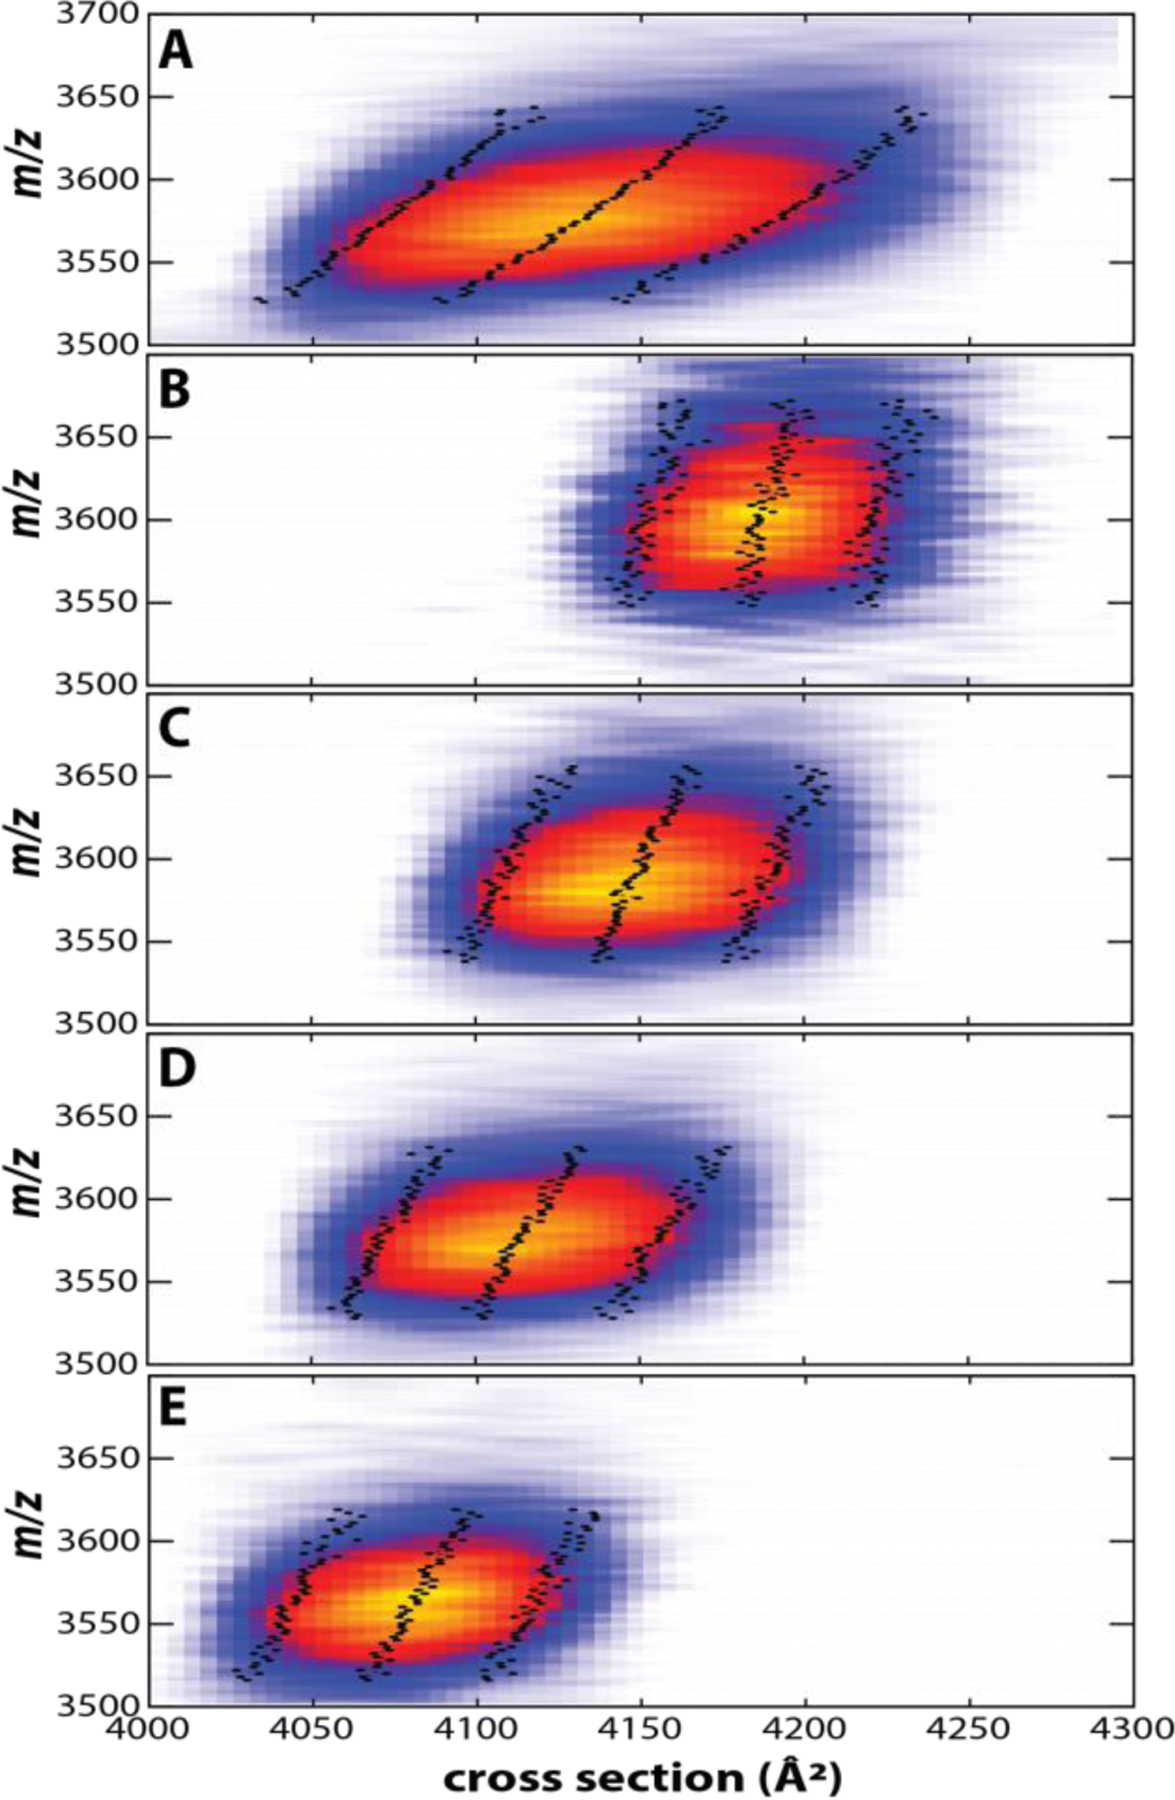
(A) Nested ion mobility – mass spectrum of avidin tetramer (18+) recorded in TIMS-2 of the coaxial tTIMS/MS, showing a broad, asymmetric peak. (B–E) Nested ion mobility – mass spectra recorded in TIMS-2 after selecting ions with specified mobilities after elution from TIMS-1. By selecting ion mobility windows from the precursor ion distribution shown in (A), the asymmetry is retained, demonstrating that the broad peak of native-like avidin arises from structurally distinct, unresolved isomers that differ in mass and ion mobility. Mean and FWHM are indicated (Black dotted lines). Adapted with permission from Anal. Chem. 2020, 92, 4459−4467 (ref 3). Copyright 2020 American Chemical Society.
In this context, we underline that a TIMS device is able to either mobility-separate ions or to transmit ions without mobility-separation (Fig. 4). This attribute appears advantageous over other types of IMS that cannot be operated in transmission-only mode.23,64–71 For example, a tandem-drift tube cannot be operated such that ions are selected after the first ion mobility separation stage but then transmitted without further mobility-separation through the second stage. As a consequence, the mobility of the ions selected at the gate after elution from the first drift-tube IMS device can only be indirectly inferred from the nominal drift time in such instruments. By contrast, tTIMS allows to directly determine the mobility of the selected ions by employing transmission mode at TIMS-2, in which case the arrival times of the ions reflect the mobility separation in TIMS-1 as shown in Figs. 9A–B.
Energetic activation of mobility-selected ions
In analogy to tandem-MS, the energetic activation of the selected ions is a critical aspect also for tandem-IMS. As indicated in Figs. 1 and 4, tTIMS/MS instruments currently allow the operator to energetically activate the mobility-selected ions in two ways.
Both the coaxial and the orthogonal tTIMS/MS instruments can activate the selected ions by means of energetic ion-neutral collisions.1,6 The orthogonal tTIMS/MS instrument can additionally activate ions by means of irradiation with photons (currently set to a wavelength of 213 nm for use in UV photodissociation experiments).6 Details are found in the section on “Technical novelties in tTIMS/MS” above. The presence of a quadrupole/collision cell enables both instruments to further perform tandem-MS measurements on the ions eluting from TIMS-2 as described3 and discussed below.
By allowing the operator to combine multiple mobility-separation, mobility- and mass selection, and energetic activation stages, tTIMS/MS enables a variety of workflows that can be used to probe the structure of the ions under investigation (Fig. 4). Specifically, the instruments enable collision-induced unfolding (CIU) and collision-induced dissociation (CID) measurements for mobility-selected ions. As reported,3,24,25,64,71 mobility-selective CIU measurements can be useful for characterisation of three-dimensional structures of proteins and protein complexes. Both the coaxial and orthogonal tTIMS/MS also facilitate mobility-selective CID measurements, which can be used to characterise the subunit architecture of protein complexes as well as to conduct (native) top-down analysis of proteins and protein complexes.3 Additionally, top-down analysis of proteins can also be carried out by UV irradiation of ions stored in the ion trap of the orthogonal tTIMS/MS.6
A. Collision-induced cleaning and unfolding of mobility-selected proteins and protein complexes
CIU experiments characterise noncovalent interactions that stabilize a given protein tertiary and/or quaternary structure.19,82,131 Several tandem-IMS methods are able to carry out CIU measurements for mobility-selected species.1,23,64,71 This ability of conducting CIU in a mobility-selective manner is advantageous when studying heterogenous samples. For example, Clemmer used mobility-selective CIU measurements to interrogate specific isomers of ubiquitin from a distribution of isomers to provide direct evidence that structural elements of the native state of ubiquitin are retained in ion mobility measurements.23–25
We first demonstrated the ability of the coaxial tTIMS/MS to collisionally-activate mobility-selected ubiquitin ions.1 To this end, compact ions of charge state 7+ of ubiquitin with cross sections of ~1300 Å2 were mobility-selected after elution from TIMS-1 (Figs. 12a–b). Subsequently, the selected ions were collisionally activated by increasing the electric field strength between aperture-2 (L2) and deflector of TIMS-2 in the coaxial tTIMS/MS. Finally, mobility-analysis was conducted in TIMS-2 to detect structural changes of ubiquitin that resulted from their collisional-activation (20–50 V; Fig. 12c–f). The data revealed that dc activation voltages larger than 30 V resulted in unfolding of the selected precursor ions. Specifically, two new features appeared at ~40 V dc activation with cross section ~1870 Å2 and ~1610 Å2, in addition to the original ion population with cross sections of ~1300 Å2. At an activation of 50 V (Fig. 12f), a significant abundance of the original ion population of ~1300 Å2 was no longer observed and strongly extended conformations with cross sections of ~1880 Å2 and ~1950 Å2, respectively, dominated the spectrum.
Fig. 12.
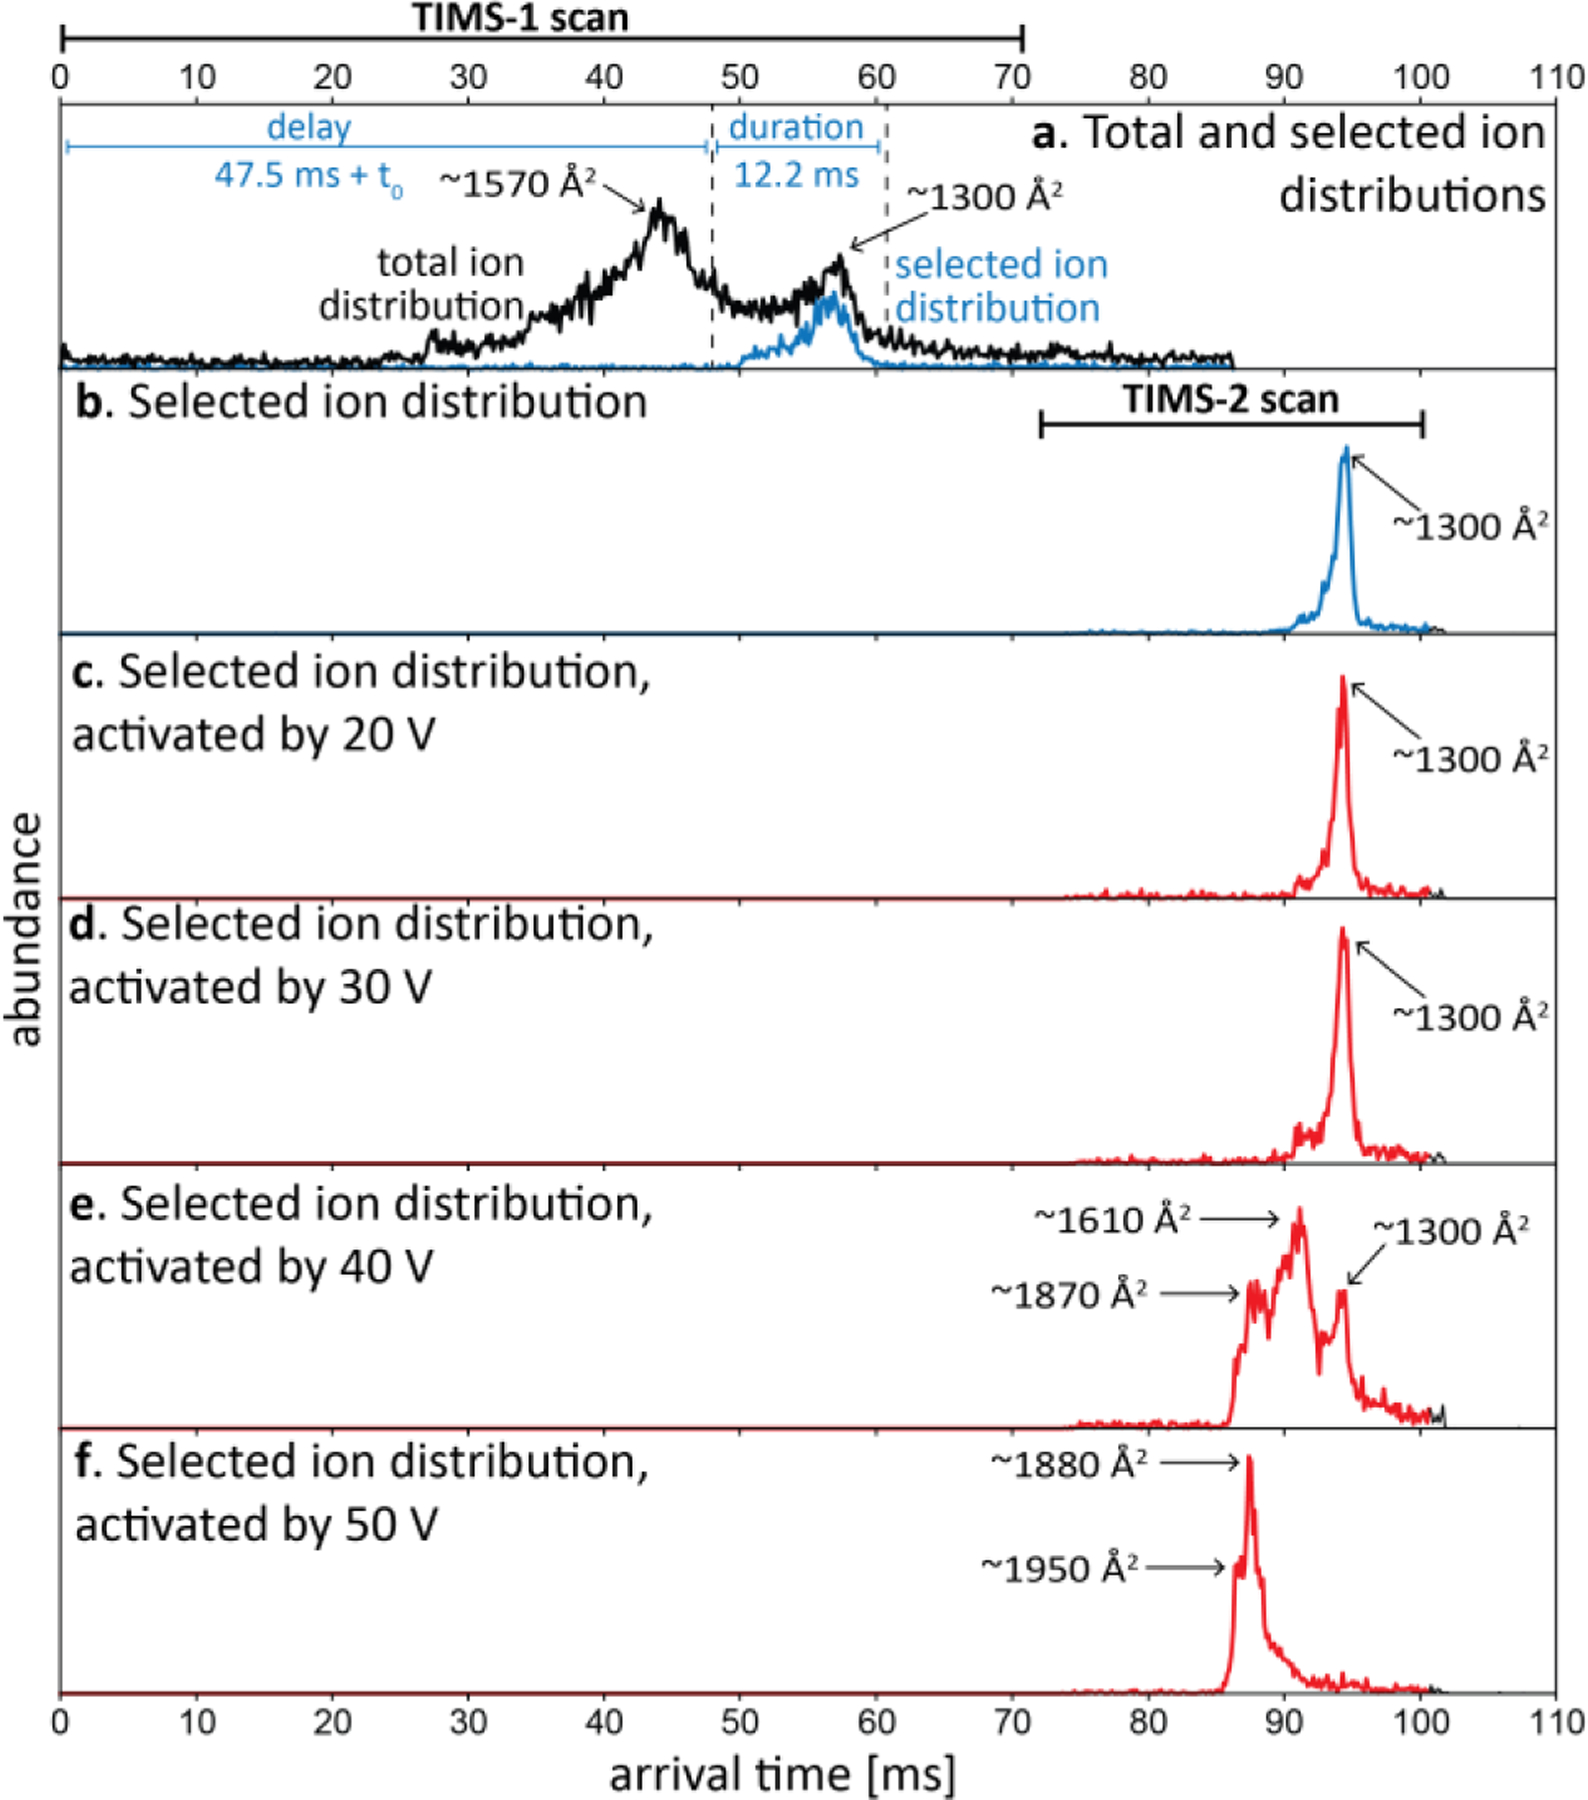
Mobility selection and collisional activation of compact ubiquitin 7+ ions in coaxial tTIMS/MS. (a) Arrival time distribution of ubiquitin 7+ ions from a non-native solution is obtained with Mode 1A (black trace). To mobility-select the compact peak, ions are gated with a delay and duration time of 47.5/12.2 ms (blue trace). (b) Arrival time distribution of selected compact peak. (c–f) Selected compact ions were then activated by a DC potential of (c) 20 V, (d) 30 V, (e) 40 V, and (f) 50 V between aperture-2 and deflector-2. Extended conformations dominate the ion distribution for dc potential >30 V. Reproduced from ref. 1 with permission from the Royal Society of Chemistry.
The ability to perform mobility-selective CIU measurements has also potential to characterise protein complexes from native MS conditions. These complexes, however, typically require a stronger activation than small monomeric proteins such as ubiquitin.131 We hence installed nickel microgrids at aperture-2 and deflector-2 of the coaxial tTIMS/MS to increase the electric field strengths experienced by the ions traversing the interface region (see section on Technical novelties in tTIMS/MS).3 As discussed in Figs. 10 and 11, the nested ion mobility/mass spectra of the avidin tetramer show broad, asymmetric peaks that are composed of unresolved avidin tetramer species that differ in their masses and ion mobilities. To probe the presence of solvent adducts and/or different avidin glycoforms, species with two different ion mobilities (K0= 0.85–0.87 and 0.88–0.90 cm2/Vs) within tetramer charge state 18+ were selected and their respective CIU profiles were recorded (Fig. 13).3 Fig. 13A plots the observed relative abundances of avidin tetramers and monomers as a function of the activation voltage. The tetramer cross sections plotted as a function of the activation voltage (Fig. 13B) revealed collision-induced unfolding (CIU) to occur between activation voltages of 70 V and 80 V, at which point the tetramers began to dissociate (CID). The changes of the full-width-at-half-maximum (fwhm) and the centre of the tetramer mass peaks as a function of the activation voltage (Figs. 13C–D) further revealed that noncovalently bound solvent particles detach from the avidin tetramer upon collisional activation, in line with “collisional cleaning” reported for similar systems.131,132 Our tTIMS/MS data, however, revealed that loss of solvent particles occurs in two distinct stages. While non-specifically bound solvent particles were found to dissociate from the tetramer at activation voltages insufficient to induce CIU of the tetramer, the loss of other solvent particles required at least partial unfolding of the protein complex (at 70–80 V). Our data thus implied that one group of solvent particles was initially strongly bound in the native-like avidin tetramer, i.e., possibly within pockets of the monomer chains or alternatively in the binding interfaces between the monomers.
Fig. 13.
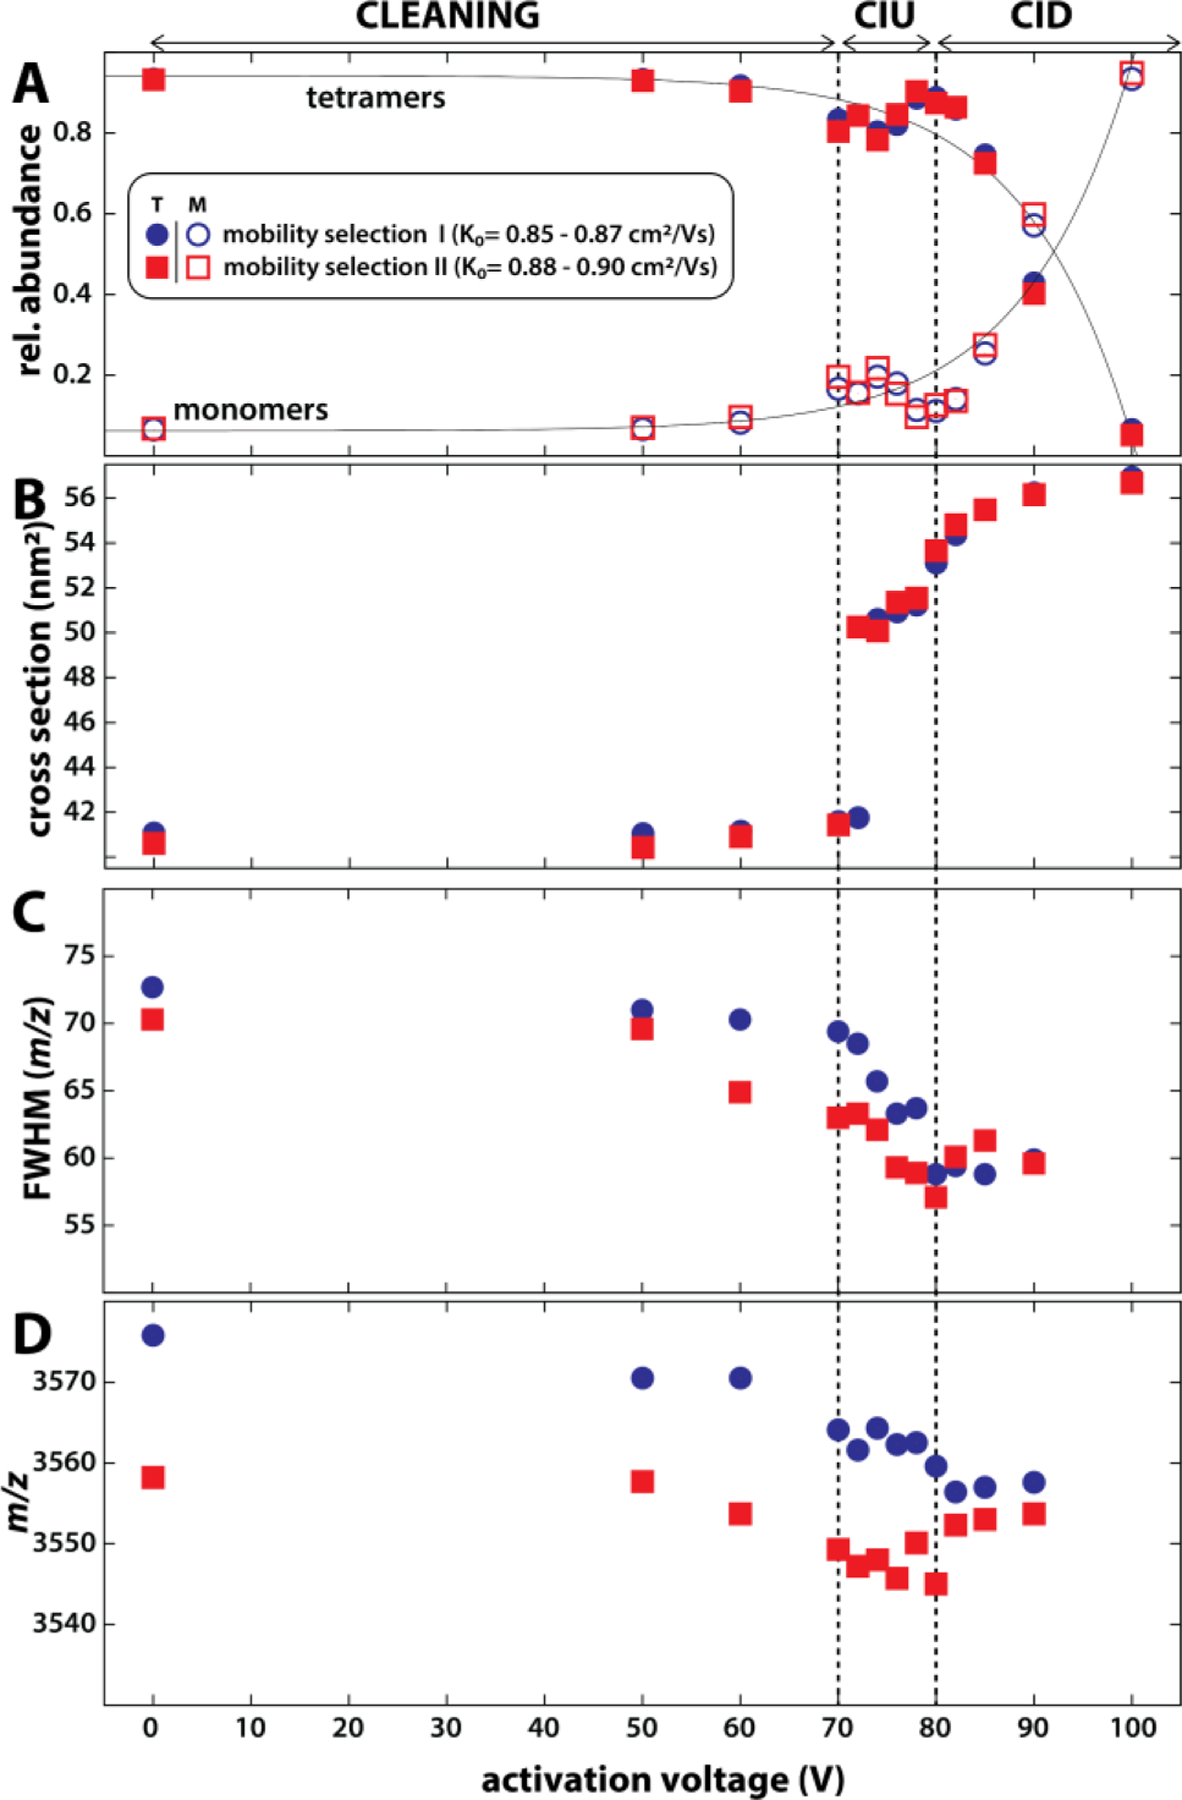
Collisional activation of mobility-selected avidin tetramers reveals stages of cleaning, unfolding, and dissociation. (A) Strong increase of monomer abundance above 80 V indicates collisional-induced dissociation of the tetramer. (B) Tetramer cross sections increase significantly between 70 to 80 V, indicating collision-induced unfolding. (C-D) The fwhm and centre of the tetramer mass peaks decrease between 70 and 80 V. Both observations suggest that solvent molecules are released during unfolding. Reprinted with permission from Anal. Chem. 2020, 92, 4459−4467 (ref 3). Copyright 2020 American Chemical Society.
B. Collision-induced dissociation of mobility-selected protein complexes
The collision-induced dissociation process of protein complexes is thought to start by charge migration and/or unfolding of one monomer chain.131–133 Subsequently, the unfolded monomer detaches from the complex while taking up approximately half of the total charge on the precursors. As a consequence, the observed product ions do not reflect the subunit architecture of the native protein complex.
This “typical” CID mechanism is observed in tTIMS when relatively low activation voltages are applied in the interface region.3 Fig. 14A highlights a nested ion mobility−mass spectrum of the homotetrameric protein complex avidin at an activation voltage of 140 V in the interface of tTIMS/MS. The data show that the mobility-selected tetramer precursor ions (charge state 18+) dissociated into trimer and monomer product ions, with the monomers (7+ to 11+) taking up approximately half of the tetramer precursor charges (18+). The significant degree of unfolding of the monomers is evident from the cross sections (CCSN2) ranging from 2104 to 2740 Å2. By contrast, the trimers (charge states 7+ to 10+) are compact with cross sections (CCSN2) between 3161 to 3274 Å2.3
Fig. 14.
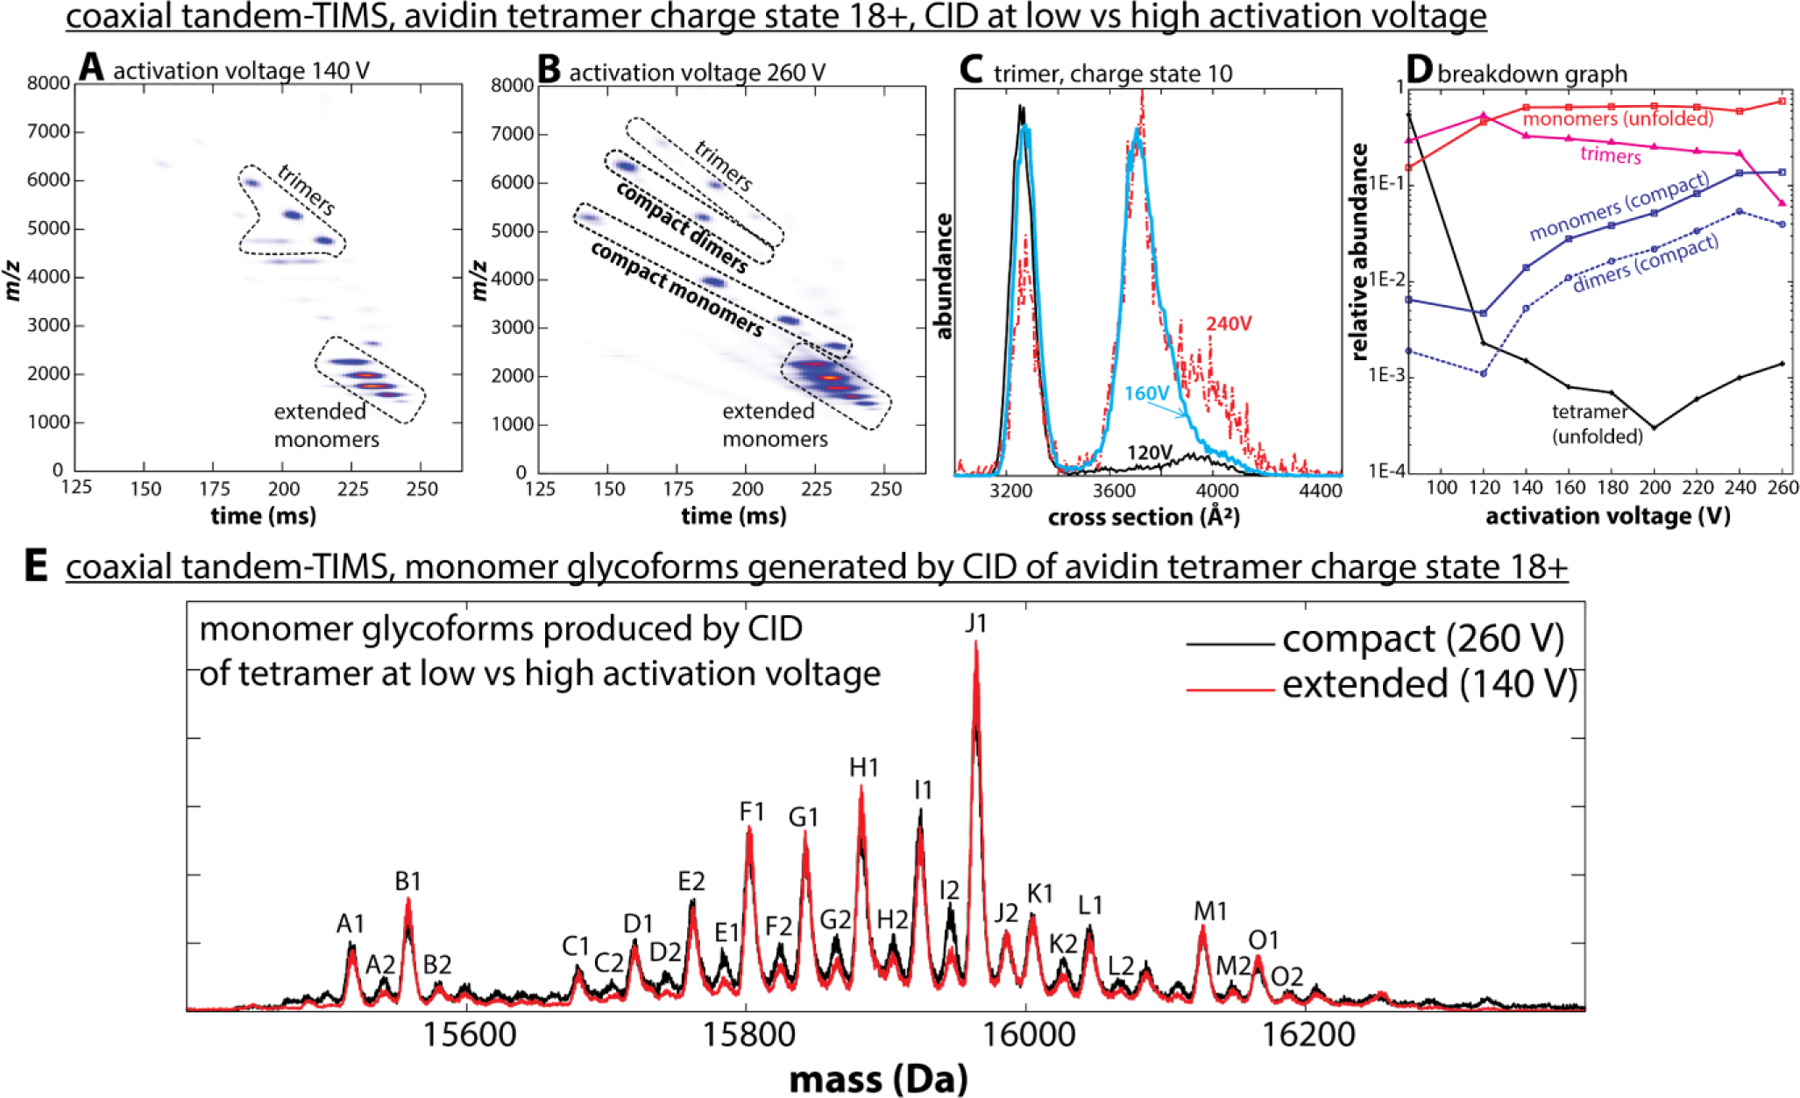
Collision-induced dissociation (CID) of native-like avidin tetramers in the interface of the coaxial tTIMS/MS. (A) At an activation voltage of 140 V, avidin dissociates mainly into extended monomers and compact trimers following a “typical” CID mechanism. (B) At an activation voltage of 260 V, compact monomers and dimers emerge, indicative of an “atypical” CID mechanism. (C) Cross section distributions for avidin trimers 10+ generated at 120 V (black), 160 V (blue), and 240 V (red) reveal that the compact trimers formed at lower activation voltages unfold at higher activation voltages. (D) The breakdown graph reveals the emergence of the “atypical” CID mechanism at activation voltages above ~150 V. (E) Charge-deconvolved mass spectra of avidin monomers acquired at 260 V (black) and 140 V (red). Both spectra show a pattern of peaks, which are consistent to each other in terms of the position and relative intensities. This observation indicates that neutral loss or fragmentation of the protein is not prevalent. Reprinted with permission from Anal. Chem. 2020, 92, 4459−4467 (ref 3). Copyright 2020 American Chemical Society.
Surprisingly, an “atypical” CID mechanism at higher activation voltages (>200 V) was observed.3 Fig. 14B shows the nested ion mobility−mass spectrum recorded at an activation voltage of 260 V. This spectrum is inconsistent with a ‘typical’ CID mechanism because it shows avidin monomers with low charge states (3+ to 6+) and avidin dimers (charge states 5+ to 7+). Further, these species are compact as indicated by their cross sections of 1568−1671 Å2 (monomers CCSN2) and 2439−2499 Å2 (dimers), respectively. Indeed, as reported,3 these avidin dimers are only slightly larger than neutravidin dimers produced by surface-induced dissociation (SID).134 Considering that neutravidin is a deglycosylated form of avidin, the data thus imply that the structures of avidin dimers in Fig. 14B potentially resemble those generated for neutravidin by SID.
Another unexpected observation was made when comparing the ion mobility spectrum of charge state 10+ of the trimer product ions at activation voltages from 120 to 240 V (Fig. 14C). The cross sections indicate that compact, folded trimers prevailed at low activation voltages (CCSN2 ≈ 3250 Å2). By contrast, extended trimers predominated above 240 V (~3650 Å2). These observations imply that the compact trimer ions produced at low activation voltages do not correspond to annealed gas-phase structures. Hence, our data are more consistent with the notion that the compact trimer species produced at low activation voltages may have retained some structural aspects of the tetramer precursor ion upon dissociation. Further, the subunits retained their glycosylation pattern (Fig. 14E) indicating that protein complexes dissociate into their subunits without fragmentation of labile post-translational modifications. Hence, the energetic activation of protein complexes as shown in Figure 14 may be analytically useful to characterise the topology of protein complexes.
While it is not yet clear how compact monomer and dimer product ions are formed mechanistically when high activation voltages are applied in the tTIMS interface, two distinct mechanisms appear plausible.3 First, compact species could be produced as a result of the combination of high electric field strengths (~1200 V/cm) and a short distance for activation (2 mm), leading to energetic ion−neutral collisions but only over a short time scale. Another possibility would be that activated precursor ions closely approach the metallic wire-mesh grid installed at deflector-2, thereby effectively colliding with the “surface” of the wire and unintentionally undergoing SID.
Top-down sequence analysis of proteins and protein complexes
Tandem-IMS reduces sample heterogeneity via mobility-selection of ions.3,23–25,64,67–69,71 A significant contribution to heterogeneity of biological samples arises directly at the level of the protein primary structure,135–138 i.e. proteoforms formed during gene expression via mechanisms such as alternative splicing of transcripts and post-translational modification of proteins.139,140 Hence, to relate the heterogeneity observed at the tertiary or quaternary structure to the heterogeneity at the primary structure, tTIMS/MS must enable top-down protein analysis141 following mobility-selection of ions separated in TIMS-1.
Fig. 15 shows the generic workflow of top-down protein analysis by tTIMS/MS. The first step is to mobility-separate the mixture of intact proteins in TIMS-1. Following elution from TIMS-1, a protein (complex) isomer is mobility-selected. Subsequently, the selected ions are dissociated into fragment ions before entering TIMS-2. This fragmentation can be accomplished on both tTIMS/MS instruments by CID1,3,6 and/or UVPD6 as indicated in Figs. 1 and 4. Following mobility-separation of the fragment ions in TIMS-2, their amino acid sequences can then additionally be probed by MS/MS in the QqTOF component of tTIMS/MS as reported.3
Fig. 15.

Top-down protein analysis by tandem-trapped ion mobility spectrometry/mass spectrometry (tTIMS/MS). (A) The first TIMS device (TIMS-1) separates intact protein precursor ions by differences in their ion mobilities. This process can be carried out for native-like or denatured proteins and their assemblies. (B) Ions of interest are mobility-selected by a gating process and (C) subjected to collision-induced dissociation (CID) or UV photodissociation (UVPD) at ~2 mbar. (D) The fragment ions produced from CID or UVPD of the mobility-selected protein precursors are subsequently mobility-analyzed in TIMS-2. (E-F) The mobility-separated fragment ions eluting from TIMS-2 can optionally be analysed by MS/MS, thereby enabling effective MS3 experiments.
We first demonstrated feasibility of the coaxial tTIMS/MS to perform mobility-selective CID of intact proteins from native conditions on the small protein ubiquitin (Fig. 16).1 To this end, ubiquitin charge state 7+ was selected and collisionally activated (Figs. 16a–b) as described above. Notably, we observed substantial fragmentation of the protein backbone which was not previously observed at the time in other tandem-IMS instruments.23 We stress that CID in the interface of tTIMS/MS is conducted at pressures of 2–3 mbar, which is significantly higher than the operating conditions for CID used in typical collision setups.81 A further observation of note is that many fragment ions exhibited multiple conformations. For example, both the y404+ and the y585+ fragment ions displayed two distinct, mobility-resolved conformations (Fig. 16e). Surprisingly, increasing the activation voltage did not influence the cross sections or the relative abundances of the conformations. These observations are inconsistent with the notion that top-down fragment ions adopt a single annealed, well-defined and folded gas-phase structure. By contrast, these data point to an intricate folding process of the fragment ions in the gas-phase following their formation. Because the folding process of a polypeptide depends on the sequence of its amino acid building blocks, this observation thus suggests that cross sections of top-down fragment ions might contain information about their primary structure not amenable from their masses alone. Indeed, recent results from our laboratory suggest that cross sections of top-down fragment ions, and the conformational transitions between their conformations, may potentially be utilized as sequence-specific determinants of the fragment ions in analogy to the cross sections of peptide ions in bottom-up proteomics.92
Fig. 16.
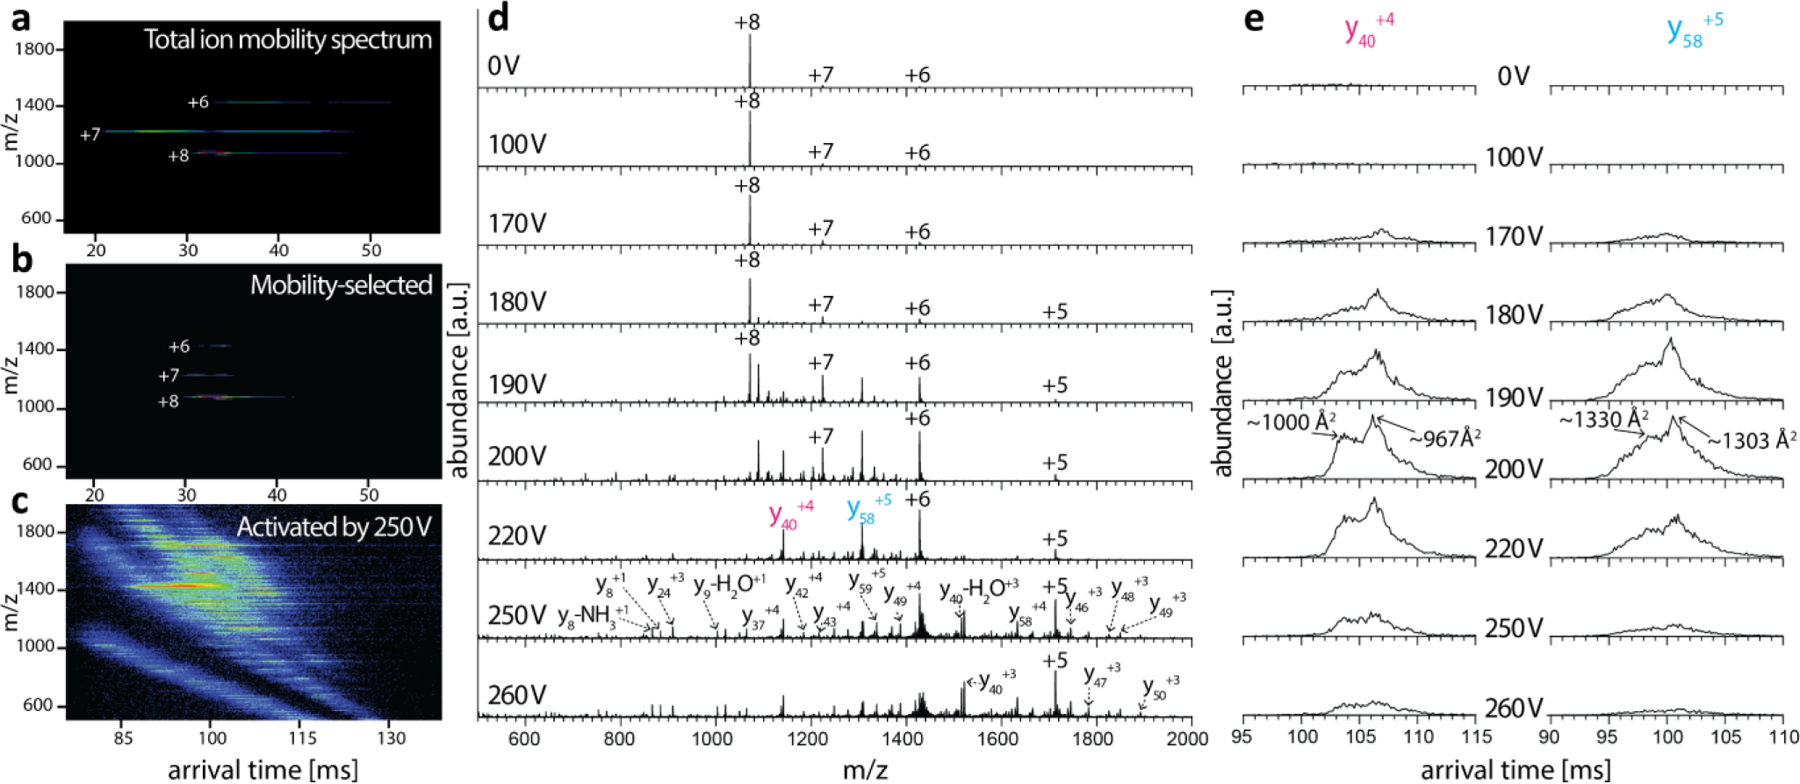
First demonstration of top-down analysis of a protein in the interface of tTIMS/MS. (a-c) Nested spectra of ubiquitin without mobility-selection (a), with mobility-selection in the interface (b), with mobility-selection followed by CID in the interface at 250 V and mobility-analysis in TIMS-2 (c). (d) Mass spectra obtained by CID at activation voltages from 100 V - 260 V. Dissociation of precursor ions are observed for activation voltages >170 V, with abundant formation of fragment ions. (e) Ion mobility spectra recorded in TIMS-2 for the y404+ and y585+ fragment ions as a function of activation voltage. The spectra reveal two distinct conformations for the fragment ions that do not interconvert despite increasing collisional activation. Reproduced from ref. 1 with permission from the Royal Society of Chemistry.
We further demonstrated feasibility in performing native top-down sequence analysis of avidin, a 64 kDa glycoprotein complex with strongly bonded subunits.3 Here, avidin charge state 18+ was mobility-selected and collisionally-activated by applying an activation voltage of 270 V between aperture-2 and deflector-2, followed by mobility analysis in TIMS-2. The resulting nested ion mobility−mass spectrum (reproduced in Fig. 17A) shows many fragment ions produced from cleavage of the avidin backbone. The fragment ions separate into several bands, as commonly observed in bottom-up proteomics using ion mobility spectrometry. These bands correspond mainly to fragment ions with charge states 1+ to 4+, of which the band with predominantly doubly charged ions is highlighted (Fig. 17A). In our original report, we manually assigned the fragment ions by comparing the isotopic patterns observed in Fig. 17A to those expected for a-, b-, and y-fragment ions of avidin, including their neutral loss fragment ions. All identified ions correspond to cleavages C-terminal of the disulphide bond (Cys4−Cys83, see fragmentation map in Fig. 17A), which confirms that the disulphide bond was intact. Overall, the sequence coverage obtained for avidin by manual interpretation of the raw spectra (29 %) is comparable to other reports using IMS/MS instruments.142 The sequence coverage can potentially be improved by performing MS/MS of the fragment ions separated in TIMS-2 in the quadrupole/collision cell of the QqTOF mass spectrometer. We demonstrated feasibility of such TIMS2-MS2 measurements by selecting m/z 1159±5 corresponding to y192+ in the quadrupole and performing MS/MS in the collision cell (Figs. 17B–C).3 Fig. 17C shows two well-resolved fragmentation bands, one band confirming the presence of y192+ while the other corresponds to an internal fragment ion.
Fig. 17.

Native top-down sequence analysis of avidin on the coaxial tTIMS/MS. (A) Nested ion mobility−mass spectrum recorded for mobility-selected avidin charge state 18+, followed by collisional activation at 270 V and mobility analysis in TIMS-2. A plethora of fragment ions, mostly y-ions, are observed, with a sequence coverage of ~29% per manual assignment. (B) Quadrupole selection of m/z 1159 displays two mobility-separated fragment ions: y192+ and an internal ion. Their subsequent CID in the collision cell produces fragment ions with apparent mobilities of the precursor ions. Mass spectra obtained for the region marked in (C) confirms the sequence of y192+. The internal ion was not identified. Reprinted with permission from Anal. Chem. 2020, 92, 4459−4467 (ref 3). Copyright 2020 American Chemical Society.
UVPD has proven to be a very versatile tool for top-down analysis of proteins and protein complexes.143–147 Hence, to enable top-down analysis of much larger protein systems by tTIMS/MS, we coupled tTIMS/MS with UVPD.6 UVPD was enabled on the orthogonal tTIMS/MS instrument by incorporating a linear quadrupolar ion trap operated at ~2–3 mbar in-between the two TIMS analysers (Fig. 1C; see also “Technical novelties in tTIMS/MS”). Fragmentation of the ions stored in the ion trap is achieved by irradiation with UV photons with a wavelength of 213 nm generated by the 5th harmonic of a Nd:YAG solid state laser. While much of the instrument development is still ongoing, we succeeded in performing top-down analysis of the small protein ubiquitin.6 As validated in Fig. 18, we observed y-1 and y-2 fragment ions which originate from a radical-based mechanism in accordance with prior literature on UVPD.148,149 Our data thus demonstrated for the first time the feasibility of conducting UVPD at 2–3 mbar, a pressure regime compatible with ion mobility spectrometry. The obtained sequence coverage was ~40%, which is comparable to recent reports of high-resolution mass spectrometers coupled with UVPD.150 Given that timsTOF systems proved effective for top-down protein analysis,151–153 tandem-TIMS coupled with UV photodissociation appears promising as an analytical method for top-down analysis of proteins from heterogenous samples.
Fig. 18.
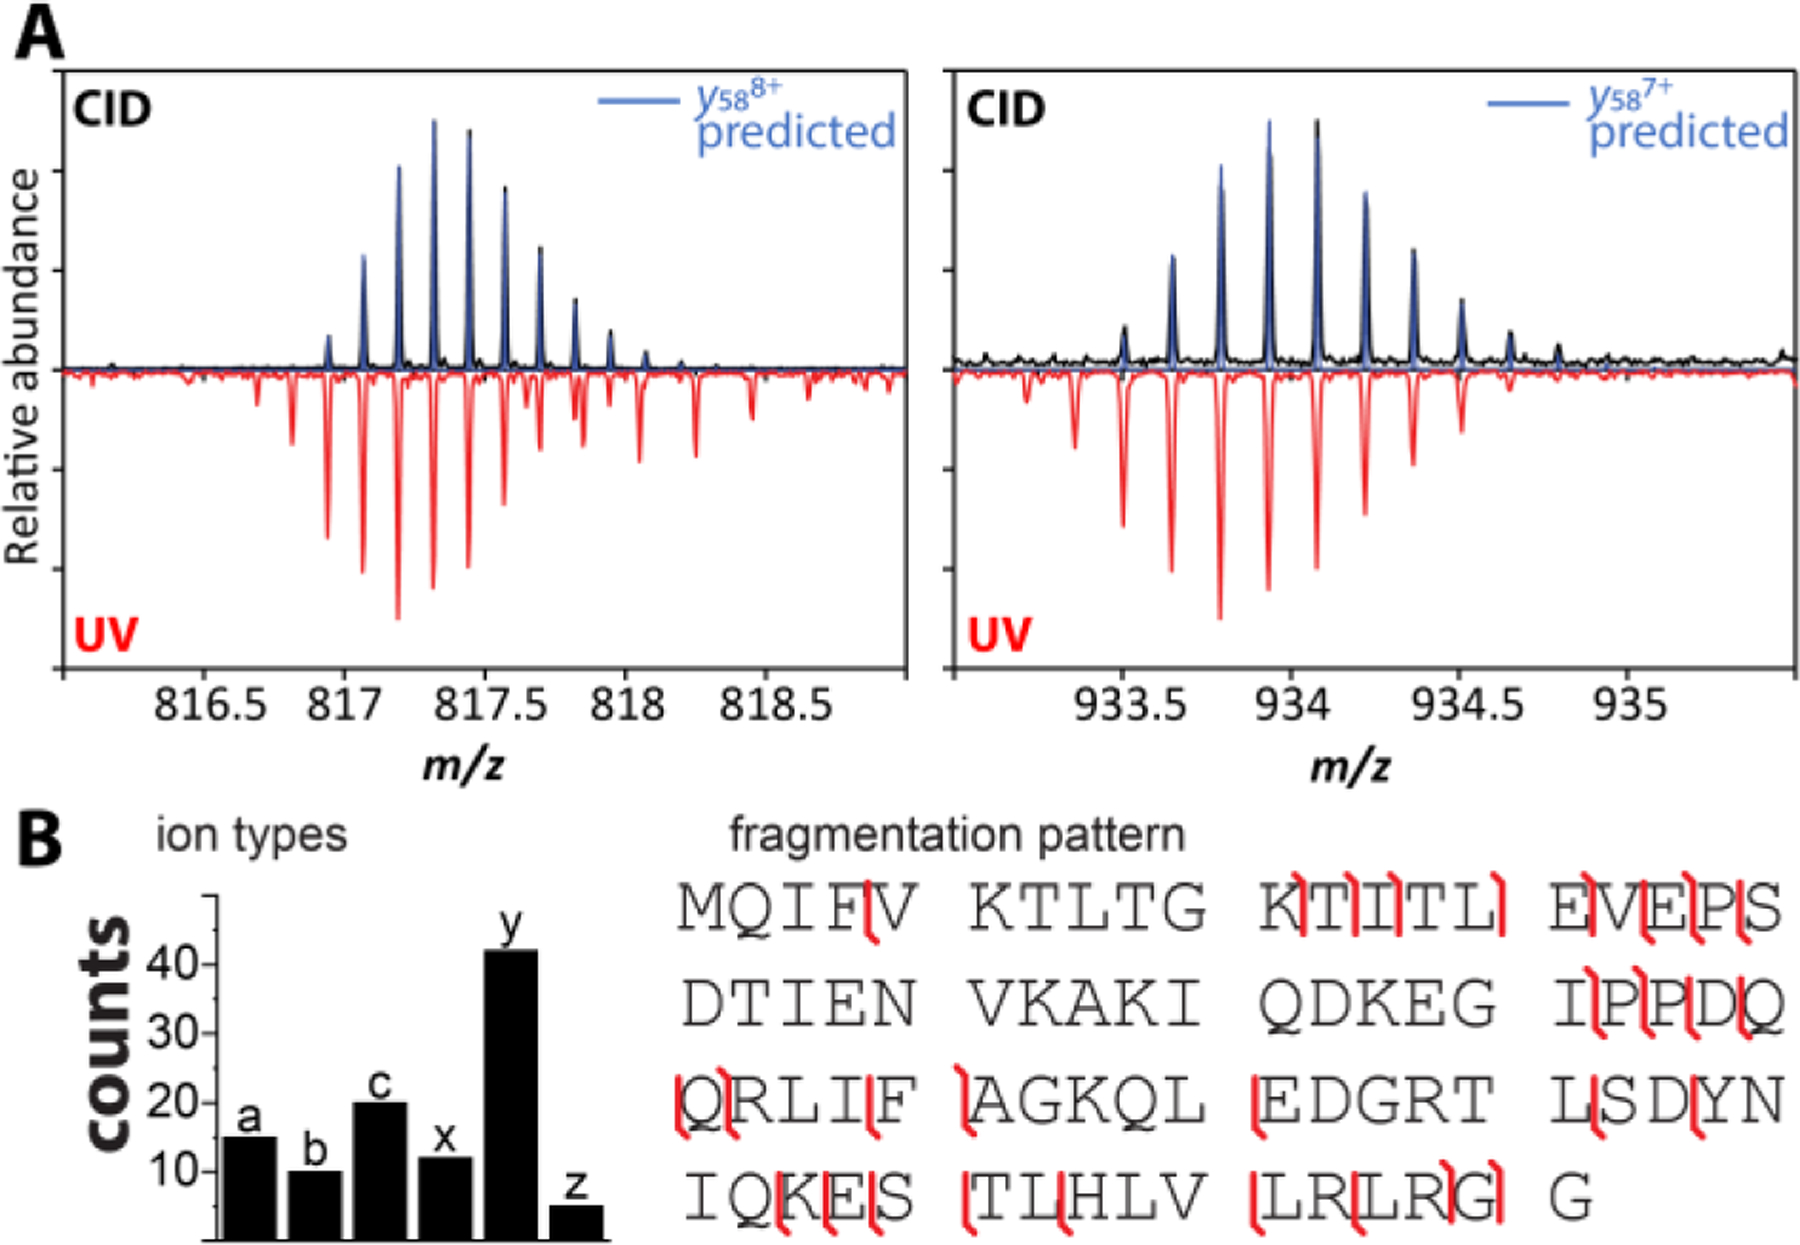
UV photodissociation in orthogonal tTIMS/MS. (A) Isotopic patterns observed for y588+ and y587+ of ubiquitin obtained from CID and UVPD in orthogonal tTIMS/MS reveal different dissociation mechanisms. (B) Counts for fragment ion types and fragmentation map obtained for ubiquitin upon UVPD in orthogonal tTIMS/MS. Reproduced from ref. 6 with permission from John Wiley & Sons publishing company.
Protein structure elucidation by ion mobility spectrometry
We wish to close this review with a note related to structure elucidation by (tandem-) ion mobility spectrometry. As we pointed out in the Introduction to this review, IMS/MS should be ideally suited to study structures of biological systems. Indeed, many applications of IMS/MS, ranging from studies of peptide and protein assemblies17,18,34–38,49,154 to proteins19,39–44 and protein complexes,45–50 showcase the tremendous potential of IMS/MS for the field of structural biology.
Nevertheless, the application of IMS/MS to study structures of protein systems remains challenging. One hurdle is related to the fact that ion mobility measurements take place in the gas phase but it is not known for how long native protein structures survive in this environment.27 Consequently, it remains unclear to what extent IMS/MS measurements truly reflect biologically relevant (solution) structures. Another hurdle is related to the fact that IMS does not yield any direct, atomic information about the ion structure. Indeed, IMS convolves the entire protein structure into a mean effective area (the “momentum transfer cross section”), where the mean is taken over all orientations and all conformations the protein samples during the measurement.16,30,117 It is thus not obvious how to infer the atomic structure of the ions from their cross-sectional areas.
The approach we are taking in our laboratories to overcome these challenges4,96 is to (1) look at the overall trends that emerge from a plurality of experimental cross-sections (i.e. different charge states, solvent conditions, buffer gases, activation voltage, etc.) and (2) to predict ion mobility spectra for these various conditions by simulating the structural relaxation of the protein system in these measurements (Figs. 5 and 19A). This method, called structure relaxation approximation (SRA),4 suggests that even the small protein ubiquitin essentially retains its native contacts with an intact hydrophobic core when studied by “soft” ion mobility measurements (Fig. 19B–C). Tandem-IMS instruments appear particularly well-suited for structure elucidation because they enable CIU measurements to be carried out starting from a well-defined precursor ion population (see Fig. 12).1,24,71 For this reason, tandem-IMS measurements open up the possibility of increasing the number of cross sections for computational analysis, thereby potentially improving the fidelity of protein structures derived from ion mobility measurements.
Fig. 19.
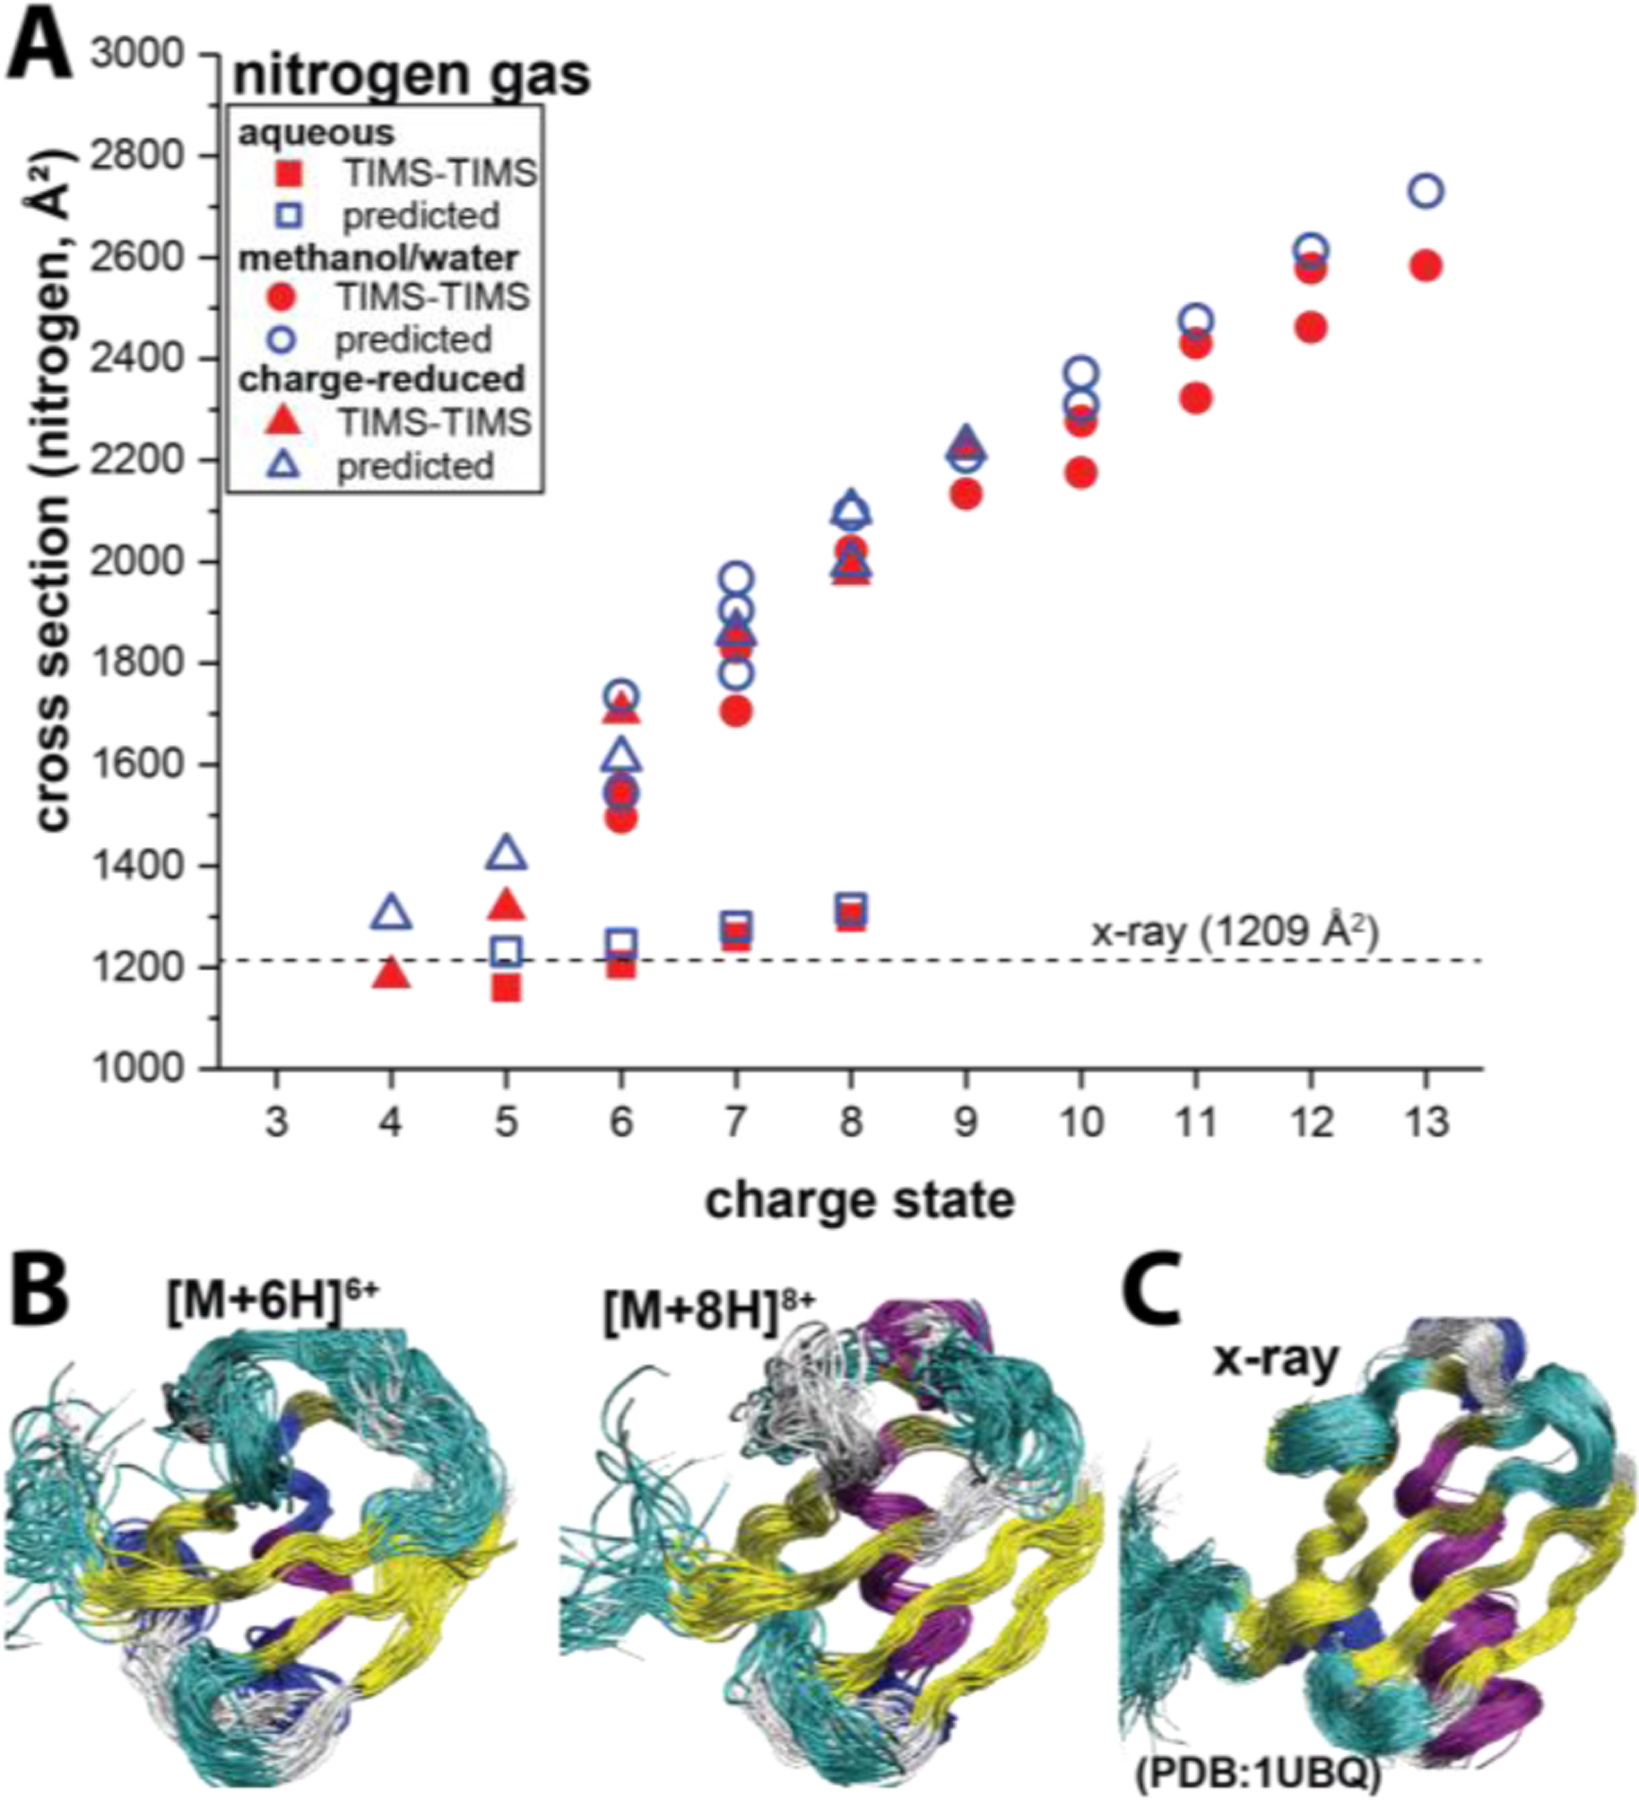
(A) Cross sections of the main features observed in the experimental tTIMS/MS (red, filled symbols) and SRA-predicted spectra (blue, open symbols) of ubiquitin as a function of the charge state for nitrogen buffer gas. The cross section for the X-ray structure (1UBQ) is indicated (dashed lines). The SRA method accurately predicts the trends observed in the experiments regardless of charge state or experimental condition (aqueous, MeOH/H2O solution, or charged-reduction). (B) Ensemble of structures predicted by the SRA for [M + 6H]6+ and [M + 8H]8+, respectively, from aqueous conditions. These ions are predicted to retain the overall topology and most of the secondary structure of the native ubiquitin structure. (C) Molecular dynamics structures generated from the x-ray structure of ubiquitin (PDB 1UBQ). Adopted with permission from J. Phys. Chem. B 2019, 123, 2756−2769 (ref 4). Copyright 2019 American Chemical Society.
Conclusions and future perspectives
We reviewed tandem-trapped ion mobility spectrometry/mass spectrometry (tTIMS/MS) instrumentation and discussed case studies highlighting its potential to study the primary, tertiary, and quaternary structures of heterogenous protein systems. In analogy to tandem-MS, tTIMS/MS separates compounds from a heterogenous mixture by differences in their ion mobilities; subsequently, the separated compounds are energetically-activated and characterised by the mobilities and/or masses of the produced ions. The coupling of tTIMS with a QqTOF mass spectrometer enables various operational modes that render tTIMS/MS a versatile instrument for heterogenous samples, often enabling measurements to be tailored to the analytical problem at hand.
A current general limitation of tandem-IMS methods arises from the limited number of methods available for ion activation compatible with the 1–10 mbar buffer gas pressure of IMS. In tTIMS/MS, ion activation at 2–3 mbar is currently enabled by coupling with 1) collisional activation of the ions due to accelerating the ions by means of an applied electric field; and 2) photoactivation of the ions by means of irradiation with UV photons. These methods enable collision-induced unfolding (CIU) and collision-induced dissociation (CID) as well as UV photodissociation (UVPD) workflows. Increasing the sequence coverage obtained by top-down analysis of larger protein systems is another area where significant improvements are anticipated. Here, improved synchronization between the UV laser and the tTIMS/MS device appears pivotal. Another current challenge is to optimize confinement of larger protein systems for the time scale of UVPD experiments without their structural denaturation to enable native complex top-down analysis.
Taken together, our discussion here underscores the promise tTIMS/MS holds as an analytical tool for the study of primary, tertiary, and quaternary structures of biomolecules present in heterogenous samples.
Acknowledgements
This work was supported by the National Institutes of Health under grant R01GM135682 (C. B.) and by the National Science Foundation under grant CHE-1654608 (C. B.).
Footnotes
Conflicts of interest
Mark E. Ridgeway and Melvin A. Park are employees of Bruker Daltonics (Billerica, MA) which manufactures and sells TIMS instruments.
References
- 1.Liu FC, Ridgeway ME, Park MA and Bleiholder C, The Analyst, 2018, 143, 2249–2258. [DOI] [PubMed] [Google Scholar]
- 2.Kirk SR, Liu FC, Cropley TC, Carlock HR and Bleiholder C, J. Am. Soc. Mass Spectrom, 2019, 30, 1204–1212. [DOI] [PubMed] [Google Scholar]
- 3.Liu FC, Cropley TC, Ridgeway ME, Park MA and Bleiholder C, Anal. Chem, 2020, 92, 4459–4467. [DOI] [PMC free article] [PubMed] [Google Scholar]
- 4.Bleiholder C and Liu FC, J. Phys. Chem. B, 2019, 123, 2756–2769. [DOI] [PubMed] [Google Scholar]
- 5.Bleiholder C, Liu FC and Chai M, Anal. Chem, 2020, 92, 16329–16333. [DOI] [PMC free article] [PubMed] [Google Scholar]
- 6.Liu FC, Ridgeway ME, Winfred JSRV, Polfer NC, Lee J, Theisen A, Wootton CA, Park MA and Bleiholder C, Rapid Commun Mass Spectrom, 2021, 35, e9192. [DOI] [PMC free article] [PubMed] [Google Scholar]
- 7.Ridgeway ME, Bleiholder C, Mann M and Park MA, TrAC Trends Anal. Chem, 2019, 116, 324–331. [Google Scholar]
- 8.Ridgeway ME, Lubeck M, Jordens J, Mann M and Park MA, Int. J. Mass Spectrom, 2018, 425, 22–35. [Google Scholar]
- 9.Jeanne Dit Fouque K and Fernandez-Lima F, TrAC Trends Anal. Chem, 2019, 116, 308–315. [Google Scholar]
- 10.Revercomb HE and Mason EA, Anal. Chem, 1975, 47, 970–983. [Google Scholar]
- 11.Kanu AB, Dwivedi P, Tam M, Matz L and Hill HH, J. Mass Spectrom, 2008, 43, 1–22. [DOI] [PubMed] [Google Scholar]
- 12.Lanucara F, Holman SW, Gray CJ and Eyers CE, Nat. Chem, 2014, 6, 281–294. [DOI] [PubMed] [Google Scholar]
- 13.US 10,794,861 B2, 2020, 25.
- 14.Albritton DL, Miller TM, Martin DW and McDaniel EW, Phys. Rev, 1968, 171, 94–102. [Google Scholar]
- 15.Kemper PR and Bowers MT, J. Am. Chem. Soc, 1990, 112, 3231–3232. [Google Scholar]
- 16.von Helden G, Hsu MT, Gotts N and Bowers MT, J. Phys. Chem, 1993, 97, 8182–8192. [Google Scholar]
- 17.Bernstein SL, Dupuis NF, Lazo ND, Wyttenbach T, Condron MM, Bitan G, Teplow DB, Shea J-E, Ruotolo BT, Robinson CV and Bowers MT, Nat. Chem, 2009, 1, 326–331. [DOI] [PMC free article] [PubMed] [Google Scholar]
- 18.Bleiholder C, Dupuis NF, Wyttenbach T and Bowers MT, Nat. Chem, 2011, 3, 172–177. [DOI] [PMC free article] [PubMed] [Google Scholar]
- 19.Clemmer DE, Hudgins RR and Jarrold MF, J. Am. Chem. Soc, 1995, 117, 10141–10142. [Google Scholar]
- 20.Jarrold MF, Ijiri Y and Ray U, J. Chem. Phys, 1991, 94, 3607–3618. [Google Scholar]
- 21.Clemmer DE, Hudgins RR and Jarrold MF, J. Am. Chem. Soc, 1995, 117, 10141–10142. [Google Scholar]
- 22.Mao Y, Woenckhaus J, Kolafa J, Ratner MA and Jarrold MF, J. Am. Chem. Soc, 1999, 121, 2712–2721. [Google Scholar]
- 23.Koeniger SL, Merenbloom SI, Valentine SJ, Jarrold MF, Udseth HR, Smith RD and Clemmer DE, Anal. Chem, 2006, 78, 4161–4174. [DOI] [PubMed] [Google Scholar]
- 24.Koeniger SL, Merenbloom SI, Sevugarajan S and Clemmer DE, J. Am. Chem. Soc, 2006, 128, 11713–11719. [DOI] [PMC free article] [PubMed] [Google Scholar]
- 25.Koeniger SL, Merenbloom SI and Clemmer DE, J. Phys. Chem. B, 2006, 110, 7017–7021. [DOI] [PubMed] [Google Scholar]
- 26.Wolynes PG, Proc. Natl. Acad. Sci, 1995, 92, 2426–2427. [DOI] [PMC free article] [PubMed] [Google Scholar]
- 27.Breuker K and McLafferty FW, Proc. Natl. Acad. Sci, 2008, 105, 18145–18152. [DOI] [PMC free article] [PubMed] [Google Scholar]
- 28.Wyttenbach T and Bowers MT, J. Phys. Chem. B, 2011, 115, 12266–12275. [DOI] [PubMed] [Google Scholar]
- 29.Bleiholder C and Bowers MT, Annu. Rev. Anal. Chem, 2017, 10, 365–386. [DOI] [PMC free article] [PubMed] [Google Scholar]
- 30.Mesleh MF, Hunter JM, Shvartsburg AA, Schatz GC and Jarrold MF, J Phys Chem, 1996, 100, 16082–16086. [Google Scholar]
- 31.Shvartsburg AA and Jarrold MF, Chem. Phys. Lett, 1996, 261, 86–91. [Google Scholar]
- 32.Bleiholder C, Wyttenbach T and Bowers MT, Int. J. Mass Spectrom, 2011, 308, 1–10. [Google Scholar]
- 33.Wyttenbach T, von Helden G, Batka JJ, Carlat D and Bowers MT, J. Am. Soc. Mass Spectrom, 1997, 8, 275–282. [Google Scholar]
- 34.Do TD, LaPointe NE, Nelson R, Krotee P, Hayden EY, Ulrich B, Quan S, Feinstein SC, Teplow DB, Eisenberg D, Shea J-E and Bowers MT, J. Am. Chem. Soc, 2016, 138, 549–557. [DOI] [PMC free article] [PubMed] [Google Scholar]
- 35.Counterman AE, Valentine SJ, Srebalus CA, Henderson SC, Hoaglund CS and Clemmer DE, J. Am. Soc. Mass Spectrom, 1998, 9, 743–759. [DOI] [PubMed] [Google Scholar]
- 36.Young LM, Mahood RA, Saunders JC, Tu L-H, Raleigh DP, Radford SE and Ashcroft AE, The Analyst, 2015, 140, 6990–6999. [DOI] [PMC free article] [PubMed] [Google Scholar]
- 37.Young LM, Cao P, Raleigh DP, Ashcroft AE and Radford SE, J. Am. Chem. Soc, 2014, 136, 660–670. [DOI] [PMC free article] [PubMed] [Google Scholar]
- 38.Cole H, Porrini M, Morris R, Smith T, Kalapothakis J, Weidt S, Mackay CL, MacPhee CE and Barran PE, The Analyst, 2015, 140, 7000–7011. [DOI] [PMC free article] [PubMed] [Google Scholar]
- 39.Hoaglund-Hyzer CS, Counterman AE and Clemmer DE, Chem. Rev, 1999, 99, 3037–3080. [DOI] [PubMed] [Google Scholar]
- 40.Eyers CE, Vonderach M, Ferries S, Jeacock K and Eyers PA, Curr. Opin. Chem. Biol, 2018, 42, 167–176. [DOI] [PubMed] [Google Scholar]
- 41.Beveridge R, Migas LG, Kriwacki RW and Barran PE, Angew. Chem, 2019, 131, 3146–3150. [DOI] [PMC free article] [PubMed] [Google Scholar]
- 42.Beveridge R, Migas LG, Das RK, Pappu RV, Kriwacki RW and Barran PE, J. Am. Chem. Soc, 2019, 141, 4908–4918. [DOI] [PMC free article] [PubMed] [Google Scholar]
- 43.Harvey SR, MacPhee CE, Volkman BF and Barran PE, Chem. Commun, 2016, 52, 394–397. [DOI] [PubMed] [Google Scholar]
- 44.Wyttenbach T, Grabenauer M, Thalassinos K, Scrivens JH and Bowers MT, J. Phys. Chem. B, 2010, 114, 437–447. [DOI] [PubMed] [Google Scholar]
- 45.Laganowsky A, Reading E, Allison TM, Ulmschneider MB, Degiacomi MT, Baldwin AJ and Robinson CV, Nature, 2014, 510, 172–175. [DOI] [PMC free article] [PubMed] [Google Scholar]
- 46.Hernández H and Robinson CV, Nat. Protoc, 2007, 2, 715–726. [DOI] [PubMed] [Google Scholar]
- 47.Uetrecht C, Barbu IM, Shoemaker GK, van Duijn E and Heck AJR, Nat. Chem, 2011, 3, 126–132. [DOI] [PubMed] [Google Scholar]
- 48.Zhou M, Politis A, Davies RB, Liko I, Wu K-J, Stewart AG, Stock D and Robinson CV, Nat. Chem, 2014, 6, 208–215. [DOI] [PMC free article] [PubMed] [Google Scholar]
- 49.Ruotolo BT, Giles K, Campuzano I, Sandercock AM, Bateman RH and Robinson CV, Science, 2005, 310, 1658–1661. [DOI] [PubMed] [Google Scholar]
- 50.Ruotolo BT, Benesch JLP, Sandercock AM, Hyung S-J and Robinson CV, Nat. Protoc, 2008, 3, 1139–1152. [DOI] [PubMed] [Google Scholar]
- 51.US 8,288,717, 2010, 28.
- 52.Liu FC, Kirk SR and Bleiholder C, Analyst, 2016, 141, 3722–3730. [DOI] [PubMed] [Google Scholar]
- 53.Ridgeway ME, Wolff JJ, Silveira JA, Lin C, Costello CE and Park MA, Int. J. Ion Mobil. Spectrom, 2016, 19, 77–85. [DOI] [PMC free article] [PubMed] [Google Scholar]
- 54.Chai M, Young MN, Liu FC and Bleiholder C, Anal. Chem, 2018, 90, 9040–9047. [DOI] [PubMed] [Google Scholar]
- 55.Hernandez DR, DeBord JD, Ridgeway ME, Kaplan DA, Park MA and Fernandez-Lima F, Analyst, 2014, 139, 1913–1921. [DOI] [PMC free article] [PubMed] [Google Scholar]
- 56.Silveira JA, Ridgeway ME and Park MA, Anal. Chem, 2014, 86, 5624–5627. [DOI] [PubMed] [Google Scholar]
- 57.Michelmann K, Silveira JA, Ridgeway ME and Park MA, J. Am. Soc. Mass Spectrom, 2015, 26, 14–24. [DOI] [PubMed] [Google Scholar]
- 58.Bleiholder C, Int. J. Mass Spectrom, 2016, 399–400, 1–9. [Google Scholar]
- 59.Fernandez-Lima FA, Kaplan DA and Park MA, Rev. Sci. Instrum, 2011, 82, 126106. [DOI] [PMC free article] [PubMed] [Google Scholar]
- 60.Naylor CN, Reinecke T, Ridgeway ME, Park MA and Clowers BH, J. Am. Soc. Mass Spectrom, 2019, 30, 2152–2162. [DOI] [PubMed] [Google Scholar]
- 61.Silveira JA, Michelmann K, Ridgeway ME and Park MA, J. Am. Soc. Mass Spectrom, 2016, 27, 585–595. [DOI] [PubMed] [Google Scholar]
- 62.Fernandez-Lima F, Kaplan DA, Suetering J and Park MA, Int. J. Ion Mobil. Spectrom, 2011, 14, 93–98. [DOI] [PMC free article] [PubMed] [Google Scholar]
- 63.Meier F, Beck S, Grassl N, Lubeck M, Park MA, Raether O and Mann M, J. Proteome Res, 2015, 14, 5378–5387. [DOI] [PubMed] [Google Scholar]
- 64.Giles K, Ujma J, Wildgoose J, Pringle S, Richardson K, Langridge D and Green M, Anal. Chem, 2019, 91, 8564–8573. [DOI] [PubMed] [Google Scholar]
- 65.Kurulugama RT, Nachtigall FM, Lee S, Valentine SJ and Clemmer DE, J. Am. Soc. Mass Spectrom, 2009, 20, 729–737. [DOI] [PMC free article] [PubMed] [Google Scholar]
- 66.Tang K, Li F, Shvartsburg AA, Strittmatter EF and Smith RD, Anal. Chem, 2005, 77, 6381–6388. [DOI] [PMC free article] [PubMed] [Google Scholar]
- 67.Allen SJ, Eaton RM and Bush MF, Anal. Chem, 2017, 89, 7527–7534. [DOI] [PubMed] [Google Scholar]
- 68.Eldrid C and Thalassinos K, Biochem. Soc. Trans, 2020, 48, 2457–2466. [DOI] [PMC free article] [PubMed] [Google Scholar]
- 69.Simon A-L, Chirot F, Choi CM, Clavier C, Barbaire M, Maurelli J, Dagany X, MacAleese L and Dugourd P, Rev. Sci. Instrum, 2015, 86, 094101. [DOI] [PubMed] [Google Scholar]
- 70.Poyer S, Comby-Zerbino C, Choi CM, MacAleese L, Deo C, Bogliotti N, Xie J, Salpin J-Y, Dugourd P and Chirot F, Anal. Chem, 2017, 89, 4230–4237. [DOI] [PubMed] [Google Scholar]
- 71.Eldrid C, Ben-Younis A, Ujma J, Britt H, Cragnolini T, Kalfas S, Cooper-Shepherd D, Tomczyk N, Giles K, Morris M, Akter R, Raleigh D and Thalassinos K, J. Am. Soc. Mass Spectrom, 2021, 32, 1545–1552. [DOI] [PMC free article] [PubMed] [Google Scholar]
- 72.Dugourd Ph., Hudgins RR, Clemmer DE and Jarrold MF, Rev. Sci. Instrum, 1997, 68, 1122–1129. [Google Scholar]
- 73.Kemper PR, Dupuis NF and Bowers MT, Int. J. Mass Spectrom, 2009, 287, 46–57. [Google Scholar]
- 74.Wyttenbach T, Kemper PR and Bowers MT, Int. J. Mass Spectrom, 2001, 212, 13–23. [Google Scholar]
- 75.Pringle SD, Giles K, Wildgoose JL, Williams JP, Slade SE, Thalassinos K, Bateman RH, Bowers MT and Scrivens JH, Int. J. Mass Spectrom, 2007, 261, 1–12. [Google Scholar]
- 76.Wu C, Siems WF, Asbury GR and Hill HH, Anal. Chem, 1998, 70, 4929–4938. [DOI] [PubMed] [Google Scholar]
- 77.Kruger TL, Litton JF, Kondrat RW and Cooks RG, Anal. Chem, 1976, 48, 2113–2119. [Google Scholar]
- 78.McLafferty FW, Acc. Chem. Res, 1980, 13, 33–39. [Google Scholar]
- 79.McLafferty FW and Bryce TA, Chem. Commun. Lond, 1967, 1215. [Google Scholar]
- 80.Wanless GG and Glock GA, Anal. Chem, 1967, 39, 2–13. [Google Scholar]
- 81.McLuckey SA and Goeringer DE, J. MASS Spectrom, 1997, 32, 461–474. [Google Scholar]
- 82.Zhong Y, Han L and Ruotolo BT, Angew. Chem. Int. Ed, 2014, 53, 9209–9212. [DOI] [PubMed] [Google Scholar]
- 83.Bornschein RE, Niu S, Eschweiler J and Ruotolo BT, J. Am. Soc. Mass Spectrom, 2016, 27, 41–49. [DOI] [PubMed] [Google Scholar]
- 84.Rajapakse MY, Stone JA and Eiceman GA, J. Phys. Chem. A, 2014, 118, 2683–2692. [DOI] [PubMed] [Google Scholar]
- 85.Li H, Bendiak B, Siems WF, Gang DR and Hill HH, Anal. Chem, 2013, 85, 2760–2769. [DOI] [PMC free article] [PubMed] [Google Scholar]
- 86.Gaye MM, Kurulugama R and Clemmer DE, The Analyst, 2015, 140, 6922–6932. [DOI] [PubMed] [Google Scholar]
- 87.Gaye MM, Nagy G, Clemmer DE and Pohl NLB, Anal. Chem, 2016, 88, 2335–2344. [DOI] [PubMed] [Google Scholar]
- 88.Rüger CP, Le Maître J, Riches E, Palmer M, Orasche J, Sippula O, Jokiniemi J, Afonso C, Giusti P and Zimmermann R, J. Am. Soc. Mass Spectrom, 2021, 32, 206–217. [DOI] [PubMed] [Google Scholar]
- 89.March RE, J. Mass Spectrom, 1997, 32, 351–369. [Google Scholar]
- 90.Song Q, Xu W, Smith SA, Gao L, Chappell WJ, Cooks RG and Ouyang Z, J. Mass Spectrom, 2010, 45, 26–34. [DOI] [PubMed] [Google Scholar]
- 91.Silveira JA, Ridgeway ME, Laukien FH, Mann M and Park MA, Int. J. Mass Spectrom, 2017, 413, 168–175. [Google Scholar]
- 92.Meier F, Köhler ND, Brunner A-D, Wanka J-MH, Voytik E, Strauss MT, Theis FJ and Mann M, Nat. Commun, 2021, 12, 1185. [DOI] [PMC free article] [PubMed] [Google Scholar]
- 93.Vasilopoulou CG, Sulek K, Brunner A-D, Meitei NS, Schweiger-Hufnagel U, Meyer SW, Barsch A, Mann M and Meier F, Nat. Commun, 2020, 11, 331. [DOI] [PMC free article] [PubMed] [Google Scholar]
- 94.Jeanne Dit Fouque K, Garabedian A, Leng F, Tse-Dinh Y-C, Ridgeway ME, Park MA and Fernandez-Lima F, Anal. Chem, 2021, 93, 2933–2941. [DOI] [PMC free article] [PubMed] [Google Scholar]
- 95.Molano-Arevalo JC, Jeanne Dit Fouque K, Pham K, Miksovska J, Ridgeway ME, Park MA and Fernandez-Lima F, Anal. Chem, 2017, 89, 8757–8765. [DOI] [PMC free article] [PubMed] [Google Scholar]
- 96.Chai M and Bleiholder C, Int. J. Mass Spectrom, 2021, 469, 116682. [Google Scholar]
- 97.Panczyk EM, Snyder DT, Ridgeway ME, Somogyi Á, Park MA and Wysocki VH, Anal. Chem, 2021, 93, 5513–5520. [DOI] [PMC free article] [PubMed] [Google Scholar]
- 98.Benigni P, Thompson CJ, Ridgeway ME, Park MA and Fernandez-Lima F, Anal. Chem, 2015, 87, 4321–4325. [DOI] [PMC free article] [PubMed] [Google Scholar]
- 99.Naylor CN, Reinecke T, Ridgeway ME, Park MA and Clowers BH, J. Am. Soc. Mass Spectrom, 2019, 30, 2152–2162. [DOI] [PubMed] [Google Scholar]
- 100.France AP, Migas LG, Sinclair E, Bellina B and Barran PE, Anal. Chem, 2020, 92, 4340–4348. [DOI] [PubMed] [Google Scholar]
- 101.Bush MF, Hall Z, Giles K, Hoyes J, Robinson CV and Ruotolo BT, Anal. Chem, 2010, 82, 9557–9565. [DOI] [PubMed] [Google Scholar]
- 102.Bleiholder C, Johnson NR, Contreras S, Wyttenbach T and Bowers MT, Anal. Chem, 2015, 87, 7196–7203. [DOI] [PubMed] [Google Scholar]
- 103.May JC, Jurneczko E, Stow SM, Kratochvil I, Kalkhof S and McLean JA, Int. J. Mass Spectrom, 2018, 427, 79–90. [DOI] [PMC free article] [PubMed] [Google Scholar]
- 104.Garabedian A, Baird MA, Porter J, Jeanne Dit Fouque K, Shliaha PV, Jensen ON, Williams TD, Fernandez-Lima F and Shvartsburg AA, Anal. Chem, 2018, 90, 2918–2925. [DOI] [PMC free article] [PubMed] [Google Scholar]
- 105.Schenk ER, Ridgeway ME, Park MA, Leng F and Fernandez-Lima F, Anal. Chem, 2014, 86, 1210–1214. [DOI] [PMC free article] [PubMed] [Google Scholar]
- 106.Schenk ER, Mendez V, Landrum JT, Ridgeway ME, Park MA and Fernandez-Lima F, Anal. Chem, 2014, 86, 2019–2024. [DOI] [PMC free article] [PubMed] [Google Scholar]
- 107.Le T, Jeanne Dit Fouque K, Santos-Fernandez M, Navo CD, Jiménez-Osés G, Sarksian R, Fernandez-Lima FA and van der Donk WA, J. Am. Chem. Soc, 2021, 143, 18733–18743. [DOI] [PMC free article] [PubMed] [Google Scholar]
- 108.Bleiholder C and Bowers MT, Annu. Rev. Anal. Chem, 2017, 10, 365–386. [DOI] [PMC free article] [PubMed] [Google Scholar]
- 109.Meyer T, Gabelica V, Grubmüller H and Orozco M, Wiley Interdiscip. Rev. Comput. Mol. Sci, 2013, 3, 408–425. [Google Scholar]
- 110.Gruebele M, Curr. Opin. Struct. Biol, 2002, 12, 161–168. [DOI] [PubMed] [Google Scholar]
- 111.Bellissent-Funel M-C, Hassanali A, Havenith M, Henchman R, Pohl P, Sterpone F, van der Spoel D, Xu Y and Garcia AE, Chem. Rev, 2016, 116, 7673–7697. [DOI] [PMC free article] [PubMed] [Google Scholar]
- 112.Myung S, Badman ER, Lee YJ and Clemmer DE, J. Phys. Chem. A, 2002, 106, 9976–9982. [Google Scholar]
- 113.Ujma J, Giles K, Morris M and Barran PE, Anal. Chem, 2016, 88, 9469–9478. [DOI] [PubMed] [Google Scholar]
- 114.Jurneczko E and Barran PE, The Analyst, 2011, 136, 20–28. [DOI] [PubMed] [Google Scholar]
- 115.Panczyk E, Snyder D, Liu F, Lin Y-F, Ridgeway M, Park M, Bleiholder C and Wysocki V, ChemRxiv., , DOI: 10.33774/chemrxiv-2021-qr78t. [DOI] [Google Scholar]
- 116.Bleiholder C, Johnson NR, Contreras S, Wyttenbach T and Bowers MT, Anal. Chem, 2015, 87, 7196–7203. [DOI] [PubMed] [Google Scholar]
- 117.Bleiholder C, Liu FC and Chai M, in New Developments in Mass Spectrometry, eds. Ashcroft AE and Sobott F, Royal Society of Chemistry, Cambridge, 2021, pp. 26–51. [Google Scholar]
- 118.Savola WJ, Eriksen FJ and Pollack E, Phys. Rev. A, 1973, 7, 932–937. [Google Scholar]
- 119.von Helden G, Wyttenbach T and Bowers MT, Int. J. Mass Spectrom. Ion Process, 1995, 146–147, 349–364. [Google Scholar]
- 120.Verbeck GF, Gillig KJ and Russell DH, Eur. J. Mass Spectrom, 2003, 9, 579–587. [DOI] [PubMed] [Google Scholar]
- 121.May JC and Russell DH, J. Am. Soc. Mass Spectrom, 2011, 22, s13361–011-0148–2. [DOI] [PubMed] [Google Scholar]
- 122.Ridgeway ME, Silveira JA, Meier JE and Park MA, Analyst, 2015, 140, 6964–6972. [DOI] [PubMed] [Google Scholar]
- 123.Morsa D, Hanozin E, Eppe G, Quinton L, Gabelica V and Pauw ED, Anal. Chem, 2020, 92, 4573–4582. [DOI] [PubMed] [Google Scholar]
- 124.Bush MF, Campuzano IDG and Robinson CV, Anal. Chem, 2012, 84, 7124–7130. [DOI] [PubMed] [Google Scholar]
- 125.Morsa D, Hanozin E, Gabelica V and De Pauw E, Anal. Chem, 2020, 92, 16334–16337. [DOI] [PubMed] [Google Scholar]
- 126.Gillig KJ and Chen C-H, Anal. Chem, 2013, 85, 2177–2182. [DOI] [PubMed] [Google Scholar]
- 127.Arndt JR, Kondalaji SG, Maurer MM, Parker A, Legleiter J and Valentine SJ, Biochemistry, 2015, 54, 4285–4296. [DOI] [PMC free article] [PubMed] [Google Scholar]
- 128.Anderson SE, Bleiholder C, Brocker ER, Stang PJ and Bowers MT, Int. J. Mass Spectrom, 2012, 330–332, 78–84. [Google Scholar]
- 129.Bleiholder C, Contreras S, Do TD and Bowers MT, Int. J. Mass Spectrom, 2013, 345–347, 89–96. [Google Scholar]
- 130.Bleiholder C, Contreras S and Bowers MT, Int. J. Mass Spectrom, 2013, 354–355, 275–280. [Google Scholar]
- 131.Benesch JLP, J. Am. Soc. Mass Spectrom, 2009, 20, 341–348. [DOI] [PubMed] [Google Scholar]
- 132.Hilton GR and Benesch JLP, J. R. Soc. Interface, 2012, 9, 801–816. [DOI] [PMC free article] [PubMed] [Google Scholar]
- 133.Pagel K, Hyung S-J, Ruotolo BT and Robinson CV, Anal. Chem, 2010, 82, 5363–5372. [DOI] [PubMed] [Google Scholar]
- 134.Quintyn RS, Yan J and Wysocki VH, Chem. Biol, 2015, 22, 583–592. [DOI] [PubMed] [Google Scholar]
- 135.Aebersold R, Agar JN, Amster IJ, Baker MS, Bertozzi CR, Boja ES, Costello CE, Cravatt BF, Fenselau C, Garcia BA, Ge Y, Gunawardena J, Hendrickson RC, Hergenrother PJ, Huber CG, Ivanov AR, Jensen ON, Jewett MC, Kelleher NL, Kiessling LL, Krogan NJ, Larsen MR, Loo JA, Ogorzalek Loo RR, Lundberg E, MacCoss MJ, Mallick P, Mootha VK, Mrksich M, Muir TW, Patrie SM, Pesavento JJ, Pitteri SJ, Rodriguez H, Saghatelian A, Sandoval W, Schlüter H, Sechi S, Slavoff SA, Smith LM, Snyder MP, Thomas PM, Uhlén M, Van Eyk JE, Vidal M, Walt DR, White FM, Williams ER, Wohlschlager T, Wysocki VH, Yates NA, Young NL and Zhang B, Nat. Chem. Biol, 2018, 14, 206–214. [DOI] [PMC free article] [PubMed] [Google Scholar]
- 136.Smith LM, Agar JN, Chamot-Rooke J, Danis PO, Ge Y, Loo JA, Paša-Tolić L, Tsybin YO, Kelleher NL, and The Consortium for Top-Down Proteomics, Sci. Adv, 2021, 7, eabk0734. [DOI] [PMC free article] [PubMed] [Google Scholar]
- 137.Harper KL, Sosa MS, Entenberg D, Hosseini H, Cheung JF, Nobre R, Avivar-Valderas A, Nagi C, Girnius N, Davis RJ, Farias EF, Condeelis J, Klein CA and Aguirre-Ghiso JA, Nature, 2016, 540, 588–592. [DOI] [PMC free article] [PubMed] [Google Scholar]
- 138.Bludau I and Aebersold R, Nat. Rev. Mol. Cell Biol, 2020, 21, 327–340. [DOI] [PubMed] [Google Scholar]
- 139.Yang X, Coulombe-Huntington J, Kang S, Sheynkman GM, Hao T, Richardson A, Sun S, Yang F, Shen YA, Murray RR, Spirohn K, Begg BE, Duran-Frigola M, MacWilliams A, Pevzner SJ, Zhong Q, Trigg SA, Tam S, Ghamsari L, Sahni N, Yi S, Rodriguez MD, Balcha D, Tan G, Costanzo M, Andrews B, Boone C, Zhou XJ, Salehi-Ashtiani K, Charloteaux B, Chen AA, Calderwood MA, Aloy P, Roth FP, Hill DE, Iakoucheva LM, Xia Y and Vidal M, Cell, 2016, 164, 805–817. [DOI] [PMC free article] [PubMed] [Google Scholar]
- 140.Li YI, van de Geijn B, Raj A, Knowles DA, Petti AA, Golan D, Gilad Y and Pritchard JK, Science, 2016, 352, 600–604. [DOI] [PMC free article] [PubMed] [Google Scholar]
- 141.Smith LM and Kelleher NL, Science, 2018, 359, 1106–1107. [DOI] [PMC free article] [PubMed] [Google Scholar]
- 142.Avtonomov DM, Polasky DA, Ruotolo BT and Nesvizhskii AI, Anal. Chem, 2018, 90, 2369–2375. [DOI] [PMC free article] [PubMed] [Google Scholar]
- 143.O’Brien JP, Li W, Zhang Y and Brodbelt JS, J. Am. Chem. Soc, 2014, 136, 12920–12928. [DOI] [PMC free article] [PubMed] [Google Scholar]
- 144.Brodbelt JS, Chem Soc Rev, 2014, 43, 2757–2783. [DOI] [PMC free article] [PubMed] [Google Scholar]
- 145.Brodbelt JS, Morrison LJ and Santos I, Chem. Rev, 2020, 120, 3328–3380. [DOI] [PMC free article] [PubMed] [Google Scholar]
- 146.Stiving AQ, Harvey SR, Jones BJ, Bellina B, Brown JM, Barran PE and Wysocki VH, J. Am. Soc. Mass Spectrom, 2020, 31, 2313–2320. [DOI] [PMC free article] [PubMed] [Google Scholar]
- 147.Theisen A, Yan B, Brown JM, Morris M, Bellina B and Barran PE, Anal. Chem, 2016, 88, 9964–9971. [DOI] [PubMed] [Google Scholar]
- 148.Julian RR, J. Am. Soc. Mass Spectrom, 2017, 28, 1823–1826. [DOI] [PMC free article] [PubMed] [Google Scholar]
- 149.Zabuga AV, Kamrath MZ, Boyarkin OV and Rizzo TR, J. Chem. Phys, 2014, 141, 154309. [DOI] [PubMed] [Google Scholar]
- 150.Becher S, Wang H, Leeming MG, Donald WA and Heiles S, The Analyst, 2021, 146, 3977–3987. [DOI] [PubMed] [Google Scholar]
- 151.Roberts DS, Mann M, Melby JA, Larson EJ, Zhu Y, Brasier AR, Jin S and Ge Y, J. Am. Chem. Soc, 2021, 143, 12014–12024. [DOI] [PMC free article] [PubMed] [Google Scholar]
- 152.Jeanne Dit Fouque K, Kaplan D, Voinov VG, Holck FHV, Jensen ON and Fernandez-Lima F, Anal. Chem, 2021, 93, 9575–9582. [DOI] [PMC free article] [PubMed] [Google Scholar]
- 153.Borotto NB and Graham KA, Anal. Chem, 2021, 93, 9959–9964. [DOI] [PubMed] [Google Scholar]
- 154.Alexander CG, Jurgens MC, Shepherd DA, Freund SMV, Ashcroft AE and Ferguson N, Proc. Natl. Acad. Sci, 2013, 110, E2782–E2791. [DOI] [PMC free article] [PubMed] [Google Scholar]


