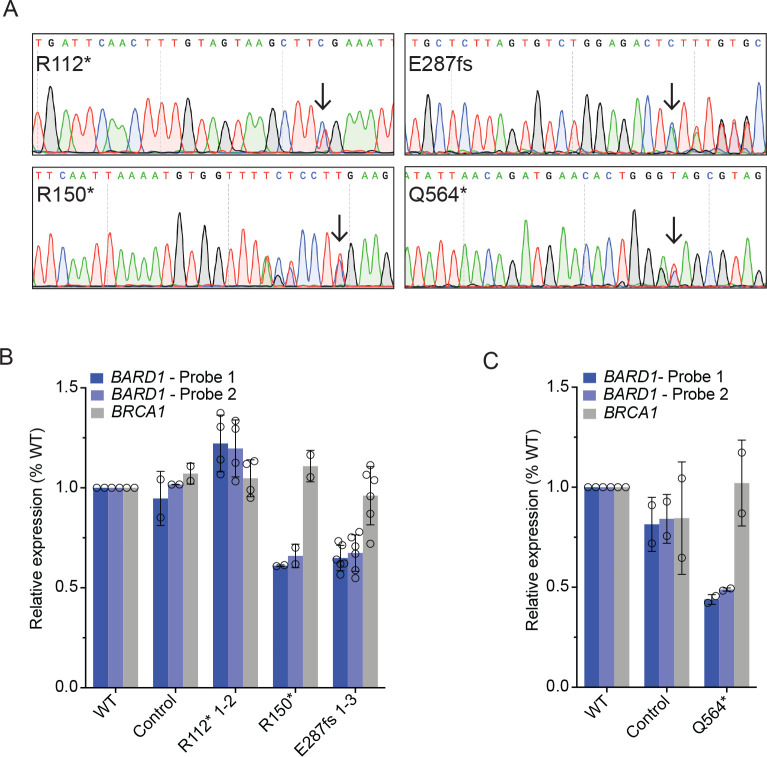
Figure 2. Neuroblastoma cells heterozygous for disease-associated BARD1 loss-of-function variants (BARD1+/mut) have reduced BARD1 expression.
(A) Representative chromatograms from IMR-5 and RPE1 BARD1+/mut isogenic cell lines. Black arrows indicate CRISPR-introduced BARD1 heterozygous variants. Other variants reflect synonymous PAM changes (R150*, Q564*) or frameshift-induced nucleotide alterations (E287fs).
(B, C) BARD1 and BRCA1 expression in IMR-5 BARD1+/mut (B) and RPE1 BARD1+/mut (C) cells and non-targeted clonal control cells. BARD1 expression measured via two unique TaqMan® probes.
B and C are represented as means ± SD of 2 biological replicates of each unique cell line, including multiple cell lines with identical BARD1 variants (n = 2 IMR-5 BARD1+/R112*, n = 1 for IMR-5 BARD1+/R150* and n = 3 for IMR-5 BARD1+/E287fs cell lines).

