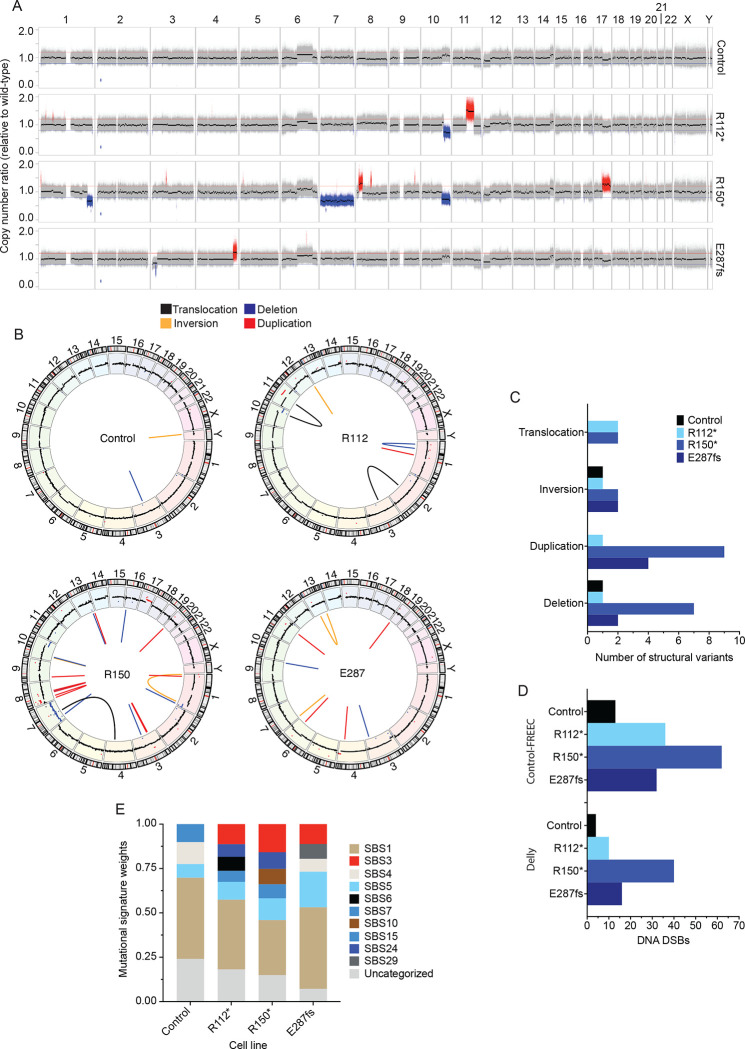
Figure 3. Neuroblastoma IMR-5 BARD1+/mut cell lines exhibit widespread genomic instability.
(A) Copy number ratio across the genome for the IMR-5 non-targeted control clone and BARD1+/mut isogenic clones relative to WT parental IMR-5 cells. Large acquired genomic losses are indicated in blue (fold change < 0.8) and gains in red (fold change > 1.2).
(B) Circos plots depicting structural variants identified in non-targeted control and BARD1+/mut IMR-5 cells. Copy number segments from (A) are shown in the outer circle for reference.
(C) Counts of structural variants in non-targeted control and BARD1+/mut IMR-5 cells.
(D) Counts of DNA DSBs in non-targeted control and BARD1+/mut IMR-5 cells, quantified from the Control-FREEC copy number data (top) and Delly structural variant data (bottom).
(E) Plot of mutational signature weights in non-targeted control and BARD1+/mut IMR-5 cells using COSMIC mutational signatures (v2).

