

Abstract
Objective:
Poor risk stratification of thyroid nodules by ultrasound has motivated the need for a deep learning-based approach for nodule segmentation. This paper demonstrates the effectiveness of a multitask approach to detect ultrasounds containing potential nodules and segment nodules on the suspected images.
Methods:
Ultrasound studies were acquired from 280 patients at UCLA Health, totaling 9888 images. A novel anomaly detection (AD) module, to classify suspicious ultrasound images, was integrated with various state of the art segmentation architectures. The trained models were evaluated on a portion of the in-house dataset, as well as two external validation (EV) sets, to understand how the AD module affected segmentation performance.
Results:
The addition of AD to the architectures improved image-level nodule detection, evidenced by the increase in F1 scores and image-wide Dice similarity coefficient. Of the models with AD, MSUNet-AD had the highest F1 score of 0.829; however, there was a decrease in DSC on just images with nodules (DSC+) from 0.726 to 0.627. This drop was observed across all models when AD was added; however, closer analysis of DSC+ by nodule size revealed that this difference was not significant in larger nodules, which are more likely to be clinically relevant. Finally, evaluation of MSUNet with and without AD on the EV datasets demonstrated comparable performance with the UCLA dataset.
Conclusion:
The proposed architecture is an automated multitask method that can both detect and segment nodules in ultrasound. Performance on the EV datasets demonstrates generalizability of the model.
Keywords: segmentation, anomaly detection, thyroid nodules, ultrasound, multitask
INTRODUCTION
There has been a recent rise in thyroid cancer incidence, making it the fifth most common malignancy amongst women in the United States between 2015-2019.[1] By age 50, 50–60% of the population have one or more thyroid nodules incidentally discovered on imaging performed for an unrelated indication.[2] Although 90% of detected nodules are actually clinically insignificant and benign, uncertainty in radiologic evaluation can lead to unnecessary biopsies.[3] Ultrasound (US) imaging is the primary imaging modality used to assess the thyroid along with the morphology and internal architecture of any present nodules.[4] The first step in thyroid nodule evaluation is detecting if and where a nodule is present on a given US image. The presence of various technical limitations and artifacts in US images such as vague nodule boundaries, poor contrast, variable probe positioning, and non-standardized spatial resolution, makes the diagnostic process partially subjective. These limitations have led to high inter-radiologist variability[5] in risk stratification, and a resultant increased need for invasive diagnostic procedures such as fine needle aspiration biopsies (FNABs).[6] FNABs are not always conclusive, and lead to unnecessary healthcare costs and complications for patients.[7]
In recent years there has been an increase in the development of computer-aided diagnosis (CAD) methods using deep learning, especially for image analysis in biomedicine.[8; 9; 10] Deep learning can be used to eliminate variability and improve diagnostic reliability in thyroid cancer risk assessment by improving the performance of concurrent nodule detection and segmentation.[11] Multiple past works have developed novel deep learning architectures to address automated segmentation of thyroid nodules.[12; 13; 14; 15] A majority of these works have studied the U-Net architecture; however, this architecture uses the same convolutional filter size, resulting in a fixed receptive field which hampers the segmentation of objects that vary in size. In response to this issue, Su et al. proposed MSUNet,[16] which introduces a multi-scale block in each layer of the encoder to fuse the outputs of convolution kernels with different receptive fields. The multi-scale block helps capture more diverse features and detailed spatial information from the input and is relevant for thyroid nodule segmentation since the target presents in diverse shapes and sizes. Similar to past work, Su et al. focused on training and evaluating MSUNet only on images with nodules and did not assess the model’s ability to identify suspicious images. This work proposes an automated segmentation method that expands on the MSUNet architecture and parallels the clinical workflow for thyroid nodule assessment. In the clinical setting, a radiologist evaluates a set of US images for a patient; when they identify a nodule on an US image, they are simultaneously accomplishing the tasks of deciding whether a nodule is present in the image and the location of the nodule. A clinically translatable model should be capable of determining which images may have nodules, and then segmenting those nodules.
In order to improve detection of anomalous images and augment the clinical utility of a segmentation model, this work introduces a multitask approach through an anomaly detection (AD) module to be used in conjunction with any U-Net architecture variant. Previously, Jain et al. proposed a two-stage model that performed AD to filter out non-suspicious capsule endoscopy images and then segmented the remaining images.[17] Chen et al. integrated a mask classification component into their dermoscopic image segmentation network to determine if a lesion was present.[18] In that work, the mask classification output was only used to improve the training of model weights.The AD module proposed in this work expands on this by making a binary classification of nodule presence that can be multiplied by the nodule segmentation to post-process the prediction. The main contributions of this work are as follows:
The AD module supplements the segmentation model architectures by assisting in image-wide nodule detection. Thus, the proposed multitask method steps towards an automated segmentation method that does not rely on guidance from radiologists.
The application of state-of-the-art models to a novel thyroid ultrasound dataset, demonstrating that MSUNet outperformed other models with and without AD integration.
The architectures, with and without the AD module, are externally validated on two publicly available thyroid ultrasound datasets, demonstrating model stability and robustness to data variability.
METHODS
Dataset Descriptions
UCLA Dataset
UCLA Health has implemented a standardized protocol for the acquisition of thyroid US images. Over the past three years, patients who have had an US examination following this protocol have had their imaging collected and aggregated in the UCLA Thyroid RadPath research dataset. This study consists of 280 patients from this dataset, where each patient has a set of 20-40 US images that span a variety of anatomic regions and ultrasound probe orientations. Each US image has been manually segmented by 2 radiologists and validated by a more senior radiologist at UCLA.
DDTI
DDTI (Digital Database Thyroid Image) is a public, open access dataset from the IDIME Ultrasound Department, one of Colombia’s largest diagnostic imaging centers.[19] This dataset contains 480 images from 290 patients. Each of these images is accompanied by a nodule annotation made by a radiology resident. Preprocessing of the original 480 images resulted in 610 images (images that contained two frames in one were split and considered separately).
Stanford CINE
The Stanford CINE dataset contains 192 cine clips from 167 patients with biopsy-confirmed thyroid nodules.[20] The cine clips in this dataset included radiologist-annotated segmentations and captured a single nodule. On average, each cine clip was composed of 90 frames, but the total number of frames was downsampled by a factor of 10 due to redundancy in image content. The frames from the cine clips were extracted and treated as independent images.
Baseline Models
Proposed Architecture
The UNet has been a standard architecture used for medical image segmentation. The encoding pathway consists of multiple layers, each of which contain a sequence (block) of 3x3 convolutions that extract relevant image features. However, using the same 3x3 kernel size for encoding pathway convolutions will lead to a fixed receptive field size, which can cause shortcomings in feature extraction during the encoding pathway and feature recovery during the decoding pathway. Small receptive fields typically excel at segmenting small objects, but struggle at localization, whereas large receptive fields are more conducive to segmenting and localizing larger objects.[21] In response to this tradeoff, MSUNet[16] introduced the idea of the multi-scale block, which incorporates convolution sequences with different kernel sizes, allowing for the extraction of more diverse features. The multiscale block consists of parallel paths each applying a double convolution, one with kernel size 3x3 and one with kernel size 7x7. The outputs of these layers are concatenated, a 1x1 convolution is applied and the resulting matrix is fed into the next layer.
The central innovation is a novel multitask approach, through the addition of the AD module, which is a fully connected neural network that can be integrated with any U-Net architecture variant, like MSUNet (Figure 2). The output of the encoding layer, a 16x16x512 array is passed into the AD module. The AD module applies a 1x1 convolution to this array, flattens it and then passes it through a 4-layer fully connected network (FCN). A sigmoid function is applied to the FCN output to rescale it between 0 and 1. The decoding pathway also takes the output of the encoding layer and reconstructs a predicted segmentation mask. Thus, for every input image, MSUNet-AD predicts a mask and AD value. During evaluation, a predetermined threshold (details under Sensitivity Analysis in Results) is used to binarize the AD value, which corresponds to MSUNet-AD’s prediction of whether or not the input image contains a nodule. The AD value is then multiplied with the binary mask to either maintain the segmentation prediction or convert it into an empty mask.
Fig. 2:

An overview of the model architecture for MSUNet-AD, with an in-depth look at the operations in each multi-scale block (bottom left) and in the AD module (bottom right).
Semantic Guided UNet (SGUNet)
SGUNet[14] is a UNet inspired architecture designed specifically for thyroid nodule segmentation in ultrasound. Their primary innovation is the SGM module, which reduces noise interference inherent to ultrasound imaging that may be propagated in the encoding layer convolutions as well as in the skip connections to the decoder layers. A SGM module is included after each decoding layer to convert the upsampled decoding into a one channel feature map. This one channel map is then concatenated with the previous decoding layer’s SGM module output. A 1x1 convolution is applied to the resulting two channel map to result in that decoding layer’s one channel semantic map. SGUNet was re-implemented in PyTorch, trained on the UCLA dataset and used as a baseline to compare against the proposed architecture.
MICCAI 2020 TN-SCUI Challenge Winner (Wang et al.)
The Wang et al. model[22] is a two stage cascaded framework that was developed for single-target segmentation of thyroid nodules. The stage 1 network is trained to predict a nodule given an ultrasound image, while the stage 2 network is trained on an image crop containing the region of interest derived from the ground truth annotation. Thus, during evaluation the two stages can be used sequentially, where stage 1 makes an initial prediction to localize the nodule, and stage 2 performs a finer segmentation of the identified nodule. Pretrained weights for stage 1 and stage 2 from training on the TN-SCUI challenge dataset were used to compare against Wang et al. when trained and evaluated on the UCLA dataset. Lastly, the proposed AD module could not be integrated with the Wang et al. model. Instead, a similar AD module was trained in parallel and during evaluation, its binary output was used to post-process the predicted mask. The AD output is multiplied with the mask to either maintain the prediction or convert it to an empty mask.
Additional Baselines
The proposed architecture was compared against standard baselines that are commonly considered in segmentation papers. These additional baselines include the UNet,[8] UNet++ (Nested UNet),[23] UNet with pretrained ResNet encoder (SResUNet) and Attention UNet (AttUNet).[24] SResUNet is a UNet with a pretrained ResNet50 encoder.
Model Training
An 80:20 train-test split was applied at the patient level to the UCLA dataset. 10% of the training set patients made up the validation set. Images with certain artifacts, such as transducer information, vascular flow assessments (Doppler images) or caliper markings, were removed. Each of the remaining images went through removal of protected health information, contrast enhancement and whitening. Image counts after applying this preprocessing pipeline are presented in Table 1.
Table 1.
Patient and image counts for train, validation and test splits. Images with at least one ground truth nodule are referred to as positive images. The images without nodules are negative images. The percentage of positive images are included in the last column.
| Split | Patients | Images | Positive Images |
|---|---|---|---|
| train | 202 | 7097 | 2892 (40.7%) |
| validation | 22 | 793 | 332 (41.9%) |
| test | 56 | 1998 | 766 (38.3%) |
Image inputs for model training, validation, and testing were resized to 256 x 256. Image augmentation was performed through random flipping, rotation, and addition of Gaussian noise. The Adam optimizer was used with an initial learning rate of 0.0005 and batch size of 64. The learning rate was decreased by a factor of 10 if the validation loss did not improve for 5 epochs. The segmentation models without AD were trained using DiceBCE loss, with equal weighting to both the Dice loss and pixel-level BCE loss (P-BCE). Upon integration of the AD module with the segmentation model, BCE loss was used for the AD classification task (AD-BCE). Eq.1 shows how these losses are used in concordance to train the multitask model. All models were developed using PyTorch 1.11.0 and trained on a NVIDIA DGX-1.
| (1) |
Evaluation Metrics
Various evaluation metrics were used to quantify segmentation performance. The image-wide metrics are are Dice similarity coefficient (DSCall), precision, recall and F1 score. Precision, recall, and F1 score are calculated using a slightly different definition for true positives (non-empty prediction that overlaps with ground truth positive), true negatives (empty prediction for a ground truth negative), false positives (non-empty prediction for a ground truth negative) and false negatives (empty prediction for a ground truth positive or non-empty prediction that does not overlap with ground truth positive). DSCall is the average Dice similarity coefficient (DSC) across all evaluated images. Because the Dice coefficient is undefined in cases where no nodule is present, Laplace smoothing is applied to allow for calculation across all images. Thus, when DSC is calculated for a negative image, an empty predicted mask will lead to a DSC of 1, indicating a true negative. The positive image-level metrics are DSC+ and Intersection over Union (IoU). These metrics are averaged across only the positive images in the test set. When calculating DSC, true positives (TP), false positives (FP) and false negatives (FN) are determined using the traditional pixel-level definition (Eq. 2).
| (2) |
The Wilcoxon Rank Sum test was used to compare model performance based on DSC. Since the test set was determined based on patient-level split, there could be overlap in anatomical regions captured by a patient’s US images, which could unintentionally inflate the statistical power of the results. To address this shortcoming, the mean DSC for each patient’s positive images were calculated and the test statistic was calculated using these patient-level DSC averages instead of DSCall or DSC+. For the Stanford CINE dataset, since adjacent frames tended to capture related anatomical views, DSC was averaged across the frames for each cine clip. For DDTI, although some patients had multiple images, they typically were of varying anatomical views so result aggregation was unnecessary.
RESULTS
Segmentation Performance
The models were evaluated on the holdout test set with and without the AD module integrated into their architecture. MSUNet-AD had the highest DSCall of 0.782 and F1 of 0.829 when compared against the other models with AD. In terms of DSC+, the models with AD performed between 0.571 and 0.627 (Table 2). In order to assess the effect of the AD module, further evaluation was performed on all the models without the AD module (Table 2). When AD is integrated into the model architecture, there are increases in DSCall and F1. For example, for MSUNet there was an increase in F1 from 0.683 to 0.829 and in DSCall from 0.581 to 0.782. MSUNet also had a DSC+ of 0.726, while the other networks ranged between 0.621 and 0.711. Another observed trend when AD was integrated into the model architectures was a drop in DSC+ from values between 0.621 and 0.757 to values between 0.571 and 0.627 (P<.05). The drop in performance on DSC+ can be attributed to variance in performance across different nodule sizes. Nodule size was determined by calculating the number of pixels a nodule(s) occupied on the image. The nodule sizes for all the positive images in the test set were aggregated and split into quartiles, where Q1 (smallest quartile) represents the smaller nodules and Q4 (largest quartile) represents the larger nodules. These quartiles are used to stratify the positive images in the test set and perform a more thorough evaluation.
Table 2.
Performance of models with and without AD on hold-out test set. Bolded values highlight the model with the best performance on a certain
| Image-Wide |
Average Across Positive Images |
|||||
|---|---|---|---|---|---|---|
| Model Name | DSCall | Precision | Recall | F1 | DSC + | IoU |
| UNet-AD | 0.775±0.357 | 0.807 | 0.822 | 0.814 | 0.609±0.340 | 0.514±0.316 |
| NestedUNet-AD | 0.762±0.364 | 0.795 | 0.850 | 0.821 | 0.597±0.335 | 0.498±0.308 |
| SResUNet-AD | 0.754±0.362 | 0.793 | 0.832 | 0.812 | 0.575±0.321 | 0.469±0.290 |
| Wang et al.-AD | 0.755±0.385 | 0.755 | 0.768 | 0.761 | 0.609±0.379 | 0.533±0.355 |
| SGUNet-AD | 0.722±0.390 | 0.731 | 0.811 | 0.769 | 0.571±0.344 | 0.474±0.313 |
| AttUNet-AD | 0.776±0.355 | 0.804 | 0.846 | 0.824 | 0.623±0.334 | 0.527±0.313 |
| MSU-Net-AD | 0.782±0.354 | 0.812 | 0.847 | 0.829 | 0.627±0.343 | 0.537±0.323 |
|
| ||||||
| UNet | 0.544±0.445 | 0.512 | 0.946 | 0.665 | 0.711±0.276 | 0.610±0.277 |
| NestedUNet | 0.539±0.444 | 0.508 | 0.944 | 0.661 | 0.710±0.271 | 0.606±0.271 |
| SResUNet | 0.259±0.369 | 0.369 | 0.941 | 0.530 | 0.673±0.277 | 0.563±0.271 |
| Wang et al. | 0.299±0.402 | 0.377 | 0.961 | 0.541 | 0.757±0.248 | 0.660±0.258 |
| SGUNet | 0.442±0.435 | 0.458 | 0.920 | 0.611 | 0.621±0.289 | 0.506±0.273 |
| AttUNet | 0.547±0.444 | 0.515 | 0.945 | 0.667 | 0.707±0.277 | 0.606±0.279 |
| MSU-Net | 0.581±0.442 | 0.535 | 0.944 | 0.683 | 0.726±0.271 | 0.628±0.273 |
A closer look at performance across the quartiles, upon addition of AD, shows that segmentation drops more on the smallest quartile than it does on the largest quartile. There were significant differences in DSC when AD was added between the majority of models on Q1 and Q2 (Figure 3). One such case is the significant drop in DSC from MSUNet to MSUNet-AD in Q1 (P=.001) and Q2 (P=.002). An example of this can be seen in the 2nd row of Figure 6, where MSUNet-AD and AttUNet-AD are unable to segment a smaller nodule, while their non-AD counterparts are at least able to localize it. However, the drops in DSC from MSUNet to MSUNet-AD were insignificant for Q3 (P=.059) and Q4 (P=.10). The more consistent performance on larger nodules can be seen in Figure 6 (4th row), where all three models with and without AD are able to successfully segment the more prominent nodule. Ultimately, when AD is added to the other baseline models, the pattern of DSC falling more on the smallest quartile compared to the largest quartile is also observed. Moreover, there is less variability in DSC when considering performance on the largest quartile compared to the smallest quartile. An example of the greater variability in the smallest quartile can be seen in Figure 6 (2nd row, 3rd row). In the 3rd row, MSUNet-AD is able to successfully segment a small nodule, whereas it struggles to segment a similarly sized nodule in the 2nd row example. Although the addition of the AD module leads to an increase in F1, it results in a drop in DSC that can be attributed to poorer segmentation of smaller nodules.
Fig. 3:

Box plot comparing segmentation performance by nodule size quartile between models with and without AD module. The plot represents the distribution of the DSC values (used to calculate DSC+) for each quartile. A black asterisk above a comparison represents a statistically significant difference. The white crosshair marks the mean of the distribution.
Fig. 6:

Examples of the difference in segmentation performance between three of the models evaluated. First row: All models without the AD module conflate a jugular vein as a nodule leading to a false positive. When the AD module is added, none of the models contain a prediction since the AD output correctly eliminates any predicted segmentations. Second row: An example of all models except MSUNet struggling to segment a small nodule. Third row: An example of a nodule where only MSUNet and MSUNet-AD exhibit agreement, whereas SGUNet-AD and AttUNet-AD struggle in comparison to their non-AD counterparts. Fourth row: An example of all models successfully segmenting the larger of two nodules. MSUNet-AD, AttUNet and AttUNet-AD are the only ones capable of detecting the smaller, adjacent nodule, but they struggle to completely segment it. Fifth row: A relatively difficult example with three different small nodules. All six models consistently miss the far right nodule. Here, AttUNet-AD and MSUNet-AD perform at par with the models without AD.
Wang et al. Evaluation Results
The Wang et al. architecture was trained on the TN-SCUI dataset and evaluation on the TN-SCUI test set showed an increase in DSC when the stage 2 network was used with stage 1. However, when trained and tested on the UCLA dataset, there was a decrease in DSC+ from 0.757 to 0.635 (Supplementary Table 1) when stage 1 and stage 2 were used in conjunction as opposed to just stage 1. Thus, the results for the Wang et al. model (Table 2) are from the best performing permutation of the model architecture, which is when only stage 1 was used. Of the models without AD, the Wang et al. model had one of the lowest F1 scores of 0.541 and DSCall of 0.299, but the highest DSC+ of 0.757. When AD was incorporated, the Wang et al. model had a DSCall of 0.755, but the lowest F1 score of 0.761 and a drop in DSC+ to 0.609.
Sensitivity Analysis
A sensitivity analysis was conducted to determine the best threshold for binarizing AD output. Various thresholds between 0 and 0.75 in increments of 0.05 were tested. Each network with AD was evaluated on the validation set and image-wide F1 scores were recorded using each of these different thresholds (Figure 5). All the models with the AD module had an optimal AD threshold of either 0.2, 0.3, or 0.4, where they demonstrated best F1 performance on the validation set. There is a consistent plateau in F1 scores up until 0.5 for all models except SGUNet-AD, indicating that performance would not differ too drastically for most AD thresholds in that range.
Fig. 5:

F1 performance across AD thresholds for the six models with AD. Dot marker represents the optimal threshold, where the best validation set F1 score is achieved for a given model.
External Validation
The models with and without the AD module were evaluated on two external validation (EV) datasets, DDTI and Stanford CINE dataset. One difference between the UCLA dataset and these two datasets is that the latter don’t have any negative images. Since the EV datasets only contain positive images, AD does not necessarily need to be performed. By setting the threshold at which the AD module output is binarized to 0, all images will be suspected to have a nodule(s) and it becomes possible to assess the segmentation ability of the models with AD. Unlike in the other models, the AD component for the Wang et al. architecture was trained independently. Thus when the threshold is 0, it eliminates the effect of the AD module. Hence, the EV results for the Wang et al. model with and without AD are equivalent.
The segmentation models without AD had a higher DSC+ compared to those with AD. For example, MSUNet had a DSC+ of 0.705 and 0.658, on DDTI and Stanford CINE respectively, whereas MSUNet-AD had a DSC+ of 0.527 and 0.569. For DDTI, the other models without AD had DSC+’s ranging between 0.587 and 0.728, while those with AD ranged between 0.494 and 0.576. For Stanford CINE, the other models without AD had DSC+’s ranging between 0.563 and 0.701, while those with AD ranged between 0.456 and 0.569 (Table 3). DSC+ for MSUNet on DDTI was higher than that for AttUNet (P<.001) and UNet (P<.001). This was also the case for DSC+ for MSUNet on Stanford CINE compared to AttUNet (P=.002) and UNet (P=.006). DSC+ for MSUNet on the UCLA dataset was 0.726, which was higher than DSC+ of 0.705 (P=.67) on DDTI and 0.658 on Stanford CINE (P<.001). On the UCLA dataset, MSUNet-AD had a DSC+ of 0.627 which was higher than the DSC+ of 0.527 on DDTI (P=.20) and 0.569 on Stanford CINE (P=.016).
Table 3.
Performance of models on DDTI and Stanford CINE datasets. Bolded values highlight the model with the best performance on a certain metric.
| DDTI |
Stanford CINE |
|||
|---|---|---|---|---|
| Average Across Positive Images |
Average Across Positive Images |
|||
| Model Name | DSC + | IoU | DSC + | IoU |
| UNet-AD | 0.494±0.242 | 0.364±0.223 | 0.456±0.264 | 0.335±0.236 |
| NestedUNet-AD | 0.502±0.247 | 0.372±0.227 | 0.476±0.275 | 0.356±0.244 |
| SResUNet-AD | 0.576±0.224 | 0.438±0.212 | 0.535±0.251 | 0.404±0.230 |
| SGUNet-AD | 0.513±0.257 | 0.384±0.232 | 0.530±0.271 | 0.405±0.248 |
| AttUNet-AD | 0.504±0.234 | 0.370±0.215 | 0.462±0.264 | 0.339±0.232 |
| MSU-Net-AD | 0.527±0.325 | 0.421±0.290 | 0.569±0.322 | 0.463±0.294 |
|
| ||||
| UNet | 0.639±0.203 | 0.501±0.211 | 0.616±0.245 | 0.488±0.242 |
| NestedUNet | 0.614±0.195 | 0.470±0.195 | 0.609±0.258 | 0.483±0.249 |
| SResUNet | 0.604±0.214 | 0.466±0.215 | 0.601±0.251 | 0.472±0.242 |
| Wang et al. | 0.728±0.241 | 0.617±0.243 | 0.701±0.303 | 0.609±0.299 |
| SGUNet | 0.587±0.202 | 0.443±0.197 | 0.563±0.253 | 0.433±0.234 |
| AttUNet | 0.649±0.191 | 0.509±0.204 | 0.612±0.244 | 0.483±0.240 |
| MSU-Net | 0.705±0.191 | 0.575±0.210 | 0.658±0.269 | 0.542±0.267 |
DISCUSSION
The AD module improved F1 score and DSCall across the board when integrated with the segmentation models, with MSUNet-AD performing best in these two metrics. This increase can be attributed to the decrease in false positives at the image-wide level. Prior to the addition of AD, the Wang et al. model performed the best in terms of DSC+; however, the low DSCall and precision, also seen in the other architectures without AD, demonstrated that the model’s predictions contained several false positives. Although AD helped increase precision, there was also an increase in false negatives, hence the decrease in recall and DSC+ for the models with AD. Further investigation into this pattern of decreasing DSC+ revealed that this drop was mainly due to an inability to segment smaller nodules (Figure 3). This was seen across most models, as exemplified in both the quantitative disparities between Q1 and the other quartiles, and the segmentation examples (2nd row, Figure 6). Moreover, the false negatives occurred with greater frequency in the smaller quartiles, as evidenced by the greater delta in image-wide recall between a model without and with AD in Q1 compared to in Q4 (Figure 4). However, smaller nodules are less likely to be clinically significant,[25] thus reducing the clinical consequences of the increase in false negatives due to AD. One limitation in these experiments was that the formula used to calculate size was pixel-based and not necessarily geared towards capturing the clinical definition of nodule size.
Fig. 4:

Image-wide recall was calculated for each model for each of the nodule size quartiles. The difference in recall between a model without and with AD is plotted for each quartile.
In regards to the EV experiments, there were notable advantages and disadvantages to the datasets used. DDTI was a favorable dataset because it contained multi-nodule images, which is comparable to real-world data and it followed an image collection protocol different from UCLA’s protocol, demonstrating the model’s independence from a specific image collection method. The main drawback of the Stanford CINE dataset was that it only contained clips of single nodules, which does not reflect real-world frequency. As detailed in the results, MSUNet-AD also outperformed the majority of other baselines on the EV datasets. It displayed similar DSC+ performance on the DDTI dataset, and despite falling short on the Stanford CINE dataset, the results indicated there was no severe overfitting to patterns found within images collected using UCLA’s standard US imaging protocol. Although the clinical implications of such models with AD need to be evaluated to understand how they would augment practice, these results indicate that MSUNet-AD is a versatile model that could have clinical applicability.
Through a multitask approach, MSUNet-AD currently performs automated segmentation of thyroid nodules. This can be extended to have further clinical application by extracting nodule features from segmented regions to develop a network that can perform an improved TI-RADS evaluation or automated biopsy prediction. Future work will aim to integrate the proposed multitask model into an end-to-end network that is also capable of nodule malignancy classification and further risk stratification. With rigorous evaluation, it would be possible to reduce the subjectivity in radiological evaluation and perceive certain clinical impacts such as a decrease in the performance of unnecessary biopsies.
CONCLUSION
This paper proposes the AD module, a segmentation architecture supplement, which boosts detection of images suspicious for containing nodules, while still allowing segmentation of nodules on those images. The experimental results demonstrate that a previously developed architecture, MSUNet, upon the addition of AD, performs best in terms of image-wide detection and pixel-level nodule segmentation. Furthermore, the architectures with AD were evaluated on two external validation sets, DDTI and Stanford CINE, to demonstrate model stability and robustness to data variability. Ultimately this multitask approach is an automated segmentation method that can potentially be leveraged to improve performance on downstream tasks such as nodule risk stratification.
Supplementary Material
Fig. 1:
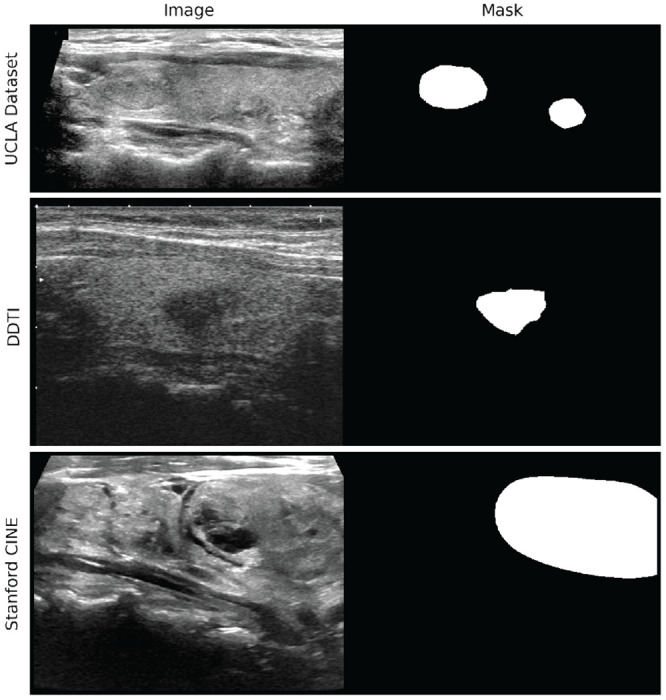
Example of an image with corresponding annotation mask from each dataset.
FUNDING
This work was supported by the National Institute of Biomedical Imaging and Bioengineering of the National Institutes of Health under award number R21EB030691.
ACKNOWLEDGEMENTS
The authors would like to thank Shawn Chen of the UCLA Computational Diagnostics Lab for his help in data collection.
Footnotes
SUPPLEMENTARY MATERIAL
Supplementary material is available at Journal of the American Medical Informatics Association online.
CONFLICT OF INTEREST STATEMENT
No competing interest is declared.
References
- 1.NIH National Cancer Institute Surveillance, Epidemiology, and End Results Program. Common Cancer Sites – Cancer Stat Facts;. Accessed on January 20, 2023. Available from: https://seer.cancer.gov/statfacts/html/common.html.
- 2.Tan GH, Gharib H. Thyroid incidentalomas: management approaches to nonpalpable nodules discovered incidentally on thyroid imaging. Annals of Internal Medicine. 1997. Feb;126(3):226–31. [DOI] [PubMed] [Google Scholar]
- 3.Durante C, Costante G, Lucisano G, et al. The Natural History of Benign Thyroid Nodules. JAMA. 2015. Mar;313(9):926–35. Available from: 10.1001/jama.2015.0956. [DOI] [PubMed] [Google Scholar]
- 4.Choi JS, Kim J, Kwak JY, et al. Preoperative Staging of Papillary Thyroid Carcinoma: Comparison of Ultrasound Imaging and CT. American Journal of Roentgenology. 2009. Sep;193(3):871–8. Publisher: American Roentgen Ray Society. Available from: 10.2214/AJR.09.2386. [DOI] [PubMed] [Google Scholar]
- 5.Choi SH, Kim EK, Kwak JY, et al. Interobserver and Intraobserver Variations in Ultrasound Assessment of Thyroid Nodules. Thyroid. 2010. Feb;20(2):167–72. Publisher: Mary Ann Liebert, Inc., publishers. Available from: 10.1089/thy.2008.0354. [DOI] [PubMed] [Google Scholar]
- 6.Ross DS. Predicting Thyroid Malignancy. The Journal of Clinical Endocrinology & Metabolism. 2006. Nov;91(11):4253–5. Available from: 10.1210/jc.2006-1772. [DOI] [PubMed] [Google Scholar]
- 7.Patel KN, Yip L, Lubitz CC, et al. The American Association of Endocrine Surgeons Guidelines for the Definitive Surgical Management of Thyroid Disease in Adults. Annals of Surgery. 2020. Mar;271(3):e21. Available from: https://journals.lww.com/annalsofsurgery/FullText/2020/03000/The_American_Association_of_Endocrine_Surgeons.28.aspx. [DOI] [PubMed] [Google Scholar]
- 8.Ronneberger O, Fischer P, Brox T. U-Net: Convolutional Networks for Biomedical Image Segmentation. arXiv; 2015. ArXiv:1505.04597 [cs]. Available from: http://arxiv.org/abs/1505.04597. [Google Scholar]
- 9.Çiçek Abdulkadir A, Lienkamp SS, et al. 3D U-Net: Learning Dense Volumetric Segmentation from Sparse Annotation. In: Ourselin S, Joskowicz L, Sabuncu MR, et al. , editors. Medical Image Computing and Computer-Assisted Intervention – MICCAI 2016. Lecture Notes in Computer Science. Cham: Springer International Publishing; 2016. p. 424–32. [Google Scholar]
- 10.Redekop E, Sarma KV, Kinnaird A, et al. Attention-Guided Prostate Lesion Localization and Grade Group Classification with Multiple Instance Learning; 2022. Available from: https://openreview.net/forum?id=QDJhkKy5x4q.
- 11.Sharifi Y, Bakhshali MA, Dehghani T, et al. Deep learning on ultrasound images of thyroid nodules. Biocybernetics and Biomedical Engineering. 2021. Apr;41(2):636–55. Available from: https://www.sciencedirect.com/science/article/pii/S0208521621000152. [Google Scholar]
- 12.Sun J, Li C, Lu Z, et al. TNSNet: Thyroid nodule segmentation in ultrasound imaging using soft shape supervision. Computer Methods and Programs in Biomedicine. 2022. Mar;215:106600. Available from: https://www.sciencedirect.com/science/article/pii/S016926072100674X. [DOI] [PubMed] [Google Scholar]
- 13.Yang Q, Geng C, Chen R, et al. DMU-Net: Dual-route mirroring U-Net with mutual learning for malignant thyroid nodule segmentation. Biomedical Signal Processing and Control. 2022. Aug;77:103805. Available from: https://www.sciencedirect.com/science/article/pii/S1746809422003275. [Google Scholar]
- 14.Pan H, Zhou Q, Latecki LJ. SGUNET: Semantic Guided UNET For Thyroid Nodule Segmentation. In: 2021 IEEE 18th International Symposium on Biomedical Imaging (ISBI); 2021. p. 630–4. ISSN: 1945-8452. [Google Scholar]
- 15.Ding J, Huang Z, Shi M, et al. Automatic Thyroid Ultrasound Image Segmentation Based on U-shaped Network. In: 2019 12th International Congress on Image and Signal Processing, BioMedical Engineering and Informatics (CISP-BMEI); 2019. p. 1–5.
- 16.Su R, Zhang D, Liu J, et al. MSU-Net: Multi-Scale U-Net for 2D Medical Image Segmentation. Frontiers in Genetics. 2021;12. Available from: 10.3389/fgene.2021.639930. [DOI] [PMC free article] [PubMed] [Google Scholar]
- 17.Jain S, Seal A, Ojha A, et al. A deep CNN model for anomaly detection and localization in wireless capsule endoscopy images. Computers in Biology and Medicine. 2021. Oct;137:104789. Available from: https://www.sciencedirect.com/science/article/pii/S0010482521005837. [DOI] [PubMed] [Google Scholar]
- 18.Chen EZ, Dong X, Li X, et al. Lesion Attributes Segmentation for Melanoma Detection with Multi-Task U-Net. In: 2019 IEEE 16th International Symposium on Biomedical Imaging (ISBI 2019); 2019. p. 485–8. ISSN: 1945-8452. [Google Scholar]
- 19.Pedraza L, Vargas C, Narváez F, et al. An open access thyroid ultrasound image database. In: 10th International Symposium on Medical Information Processing and Analysis. vol. 9287. SPIE; 2015. p. 188–93. Available from: 10.1117/12.2073532.full. [DOI] [Google Scholar]
- 20.Stanford AIMI Shared Datasets;. Available from: https://stanfordaimi.azurewebsites.net/datasets/a72f2b02-7b53-4c5d-963c-d7253220bfd5.
- 21.Bao H. Investigations of the Influences of a CNN’s Receptive Field on Segmentation of Subnuclei of Bilateral Amygdalae. arXiv; 2019. ArXiv:1911.02761 [cs, eess]. Available from: http://arxiv.org/abs/1911.02761. [Google Scholar]
- 22.Wang M. 1st place solution in MICCAI 2020 TN-SCUI challenge; 2023. Original-date: 2020-08-17T15:28:39Z. Available from: https://github.com/WAMAWAMA/TNSCUI2020-Seg-Rank1st. [Google Scholar]
- 23.Zhou Z, Siddiquee MMR, Tajbakhsh N, et al. UNet++: A Nested U-Net Architecture for Medical Image Segmentation. arXiv; 2018. ArXiv:1807.10165 [cs, eess, stat]. Available from: http://arxiv.org/abs/1807.10165. [DOI] [PMC free article] [PubMed] [Google Scholar]
- 24.Oktay O, Schlemper J, Folgoc LL, et al. Attention U-Net: Learning Where to Look for the Pancreas. arXiv; 2018. ArXiv:1804.03999 [cs]. Available from: http://arxiv.org/abs/1804.03999. [Google Scholar]
- 25.Haugen BR, Alexander EK, Bible KC, et al. 2015 American Thyroid Association Management Guidelines for Adult Patients with Thyroid Nodules and Differentiated Thyroid Cancer: The American Thyroid Association Guidelines Task Force on Thyroid Nodules and Differentiated Thyroid Cancer. Thyroid. 2016. Jan;26(1):1–133. Available from: https://www.ncbi.nlm.nih.gov/pmc/articles/PMC4739132/. [DOI] [PMC free article] [PubMed] [Google Scholar]
Associated Data
This section collects any data citations, data availability statements, or supplementary materials included in this article.