

This study demonstrated that descending projections from the insular cortex to the spinal subnucleus caudalis play facilitative roles in the information processing of orofacial nociception.
Keywords: Insular cortex, Trigeminal nerve, Medullary dorsal horn, EPSCs
Abstract
Nociceptive information from the orofacial area projects to the trigeminal spinal subnucleus caudalis (Sp5C) and is then conveyed to several nuclei, including the parabrachial nucleus (PBN). The insular cortex (IC) receives orofacial nociceptive information and sends corticofugal projections to the Sp5C. The Sp5C consists of glutamatergic and GABAergic/glycinergic interneurons that induce excitatory postsynaptic currents and inhibitory postsynaptic currents, respectively, in projection neurons. Therefore, quantification of glutamatergic IC inputs in combination with identifying postsynaptic neuronal subtypes is critical to elucidate IC roles in the regulation of Sp5C activities. We investigated features of synaptic transmission from the IC to glutamatergic and GABAergic/glycinergic Sp5C neurons of laminae I/II using vesicular GABA transporter-Venus transgenic rats that received an injection of adeno-associated virus-channelrhodopsin-2-mCherry into the IC. Selective stimulation of IC axon terminals in Sp5C slice preparations induced monosynaptic excitatory postsynaptic currents in both excitatory glutamatergic and inhibitory GABAergic/glycinergic Sp5C neurons with a comparable amplitude. Paired whole-cell patch-clamp recordings showed that unitary inhibitory postsynaptic currents from inhibitory neurons influencing excitatory neurons, including neurons projecting to the PBN, exhibited a high failure rate and were suppressed by both bicuculline and strychnine, suggesting that excitatory neurons in the Sp5C receive both GABAergic and glycinergic inhibition with low impact. Moreover, selective stimulation of IC axons increased the firing rate at the threshold responses. Finally, we demonstrated that selective stimulation of IC axons in the Sp5C by a chemogenetic approach decreased the thresholds of both mechanical and thermal nociception. Thus, IC projection to the Sp5C is likely to facilitate rather than suppress excitatory outputs from the Sp5C.
1. Introduction
Nociceptive information in the orofacial area is conveyed principally to the trigeminal spinal subnucleus caudalis (Sp5C) through trigeminal nerves,3,9,37,55 most of whose terminals are observed in laminae I, II, and V.1,26,46,62 Lamina I neurons are glutamatergic and transmit nociceptive information from trigeminal primary sensory neurons to higher brain regions, including the parabrachial nucleus (PBN), thalamus, and lateral hypothalamus.6,21,49,63 Lamina II, the substantia gelatinosa, is another layer that consistently responds to nociceptive stimuli2 and involves GABA/glycinergic neurons projecting to lamina I.5,47,62 Therefore, lamina II neurons are considered to regulate outputs from the Sp5C. Interestingly, neurons in laminae I and II receive dense modulatory projections such as adrenergic and serotonergic inputs10,12,47,59 in addition to nociceptive inputs from the peripheral nervous system. Therefore, the Sp5C is considered to play a critical role in nociception regulation in the trigeminal nervous system.
Corticofugal projections from the cerebral cortex to the sensory trigeminal nuclei, which involve secondary sensory neurons, have been characterized by anatomical approaches in cats13,56,64 and rats.27,31,54,65 The principal cortical neurons projecting to the sensory trigeminal nuclei are located in layer V of the primary and secondary somatosensory cortices (S1 and S2). The roles of corticofugal projection neurons in modulating sensory information from the trigeminal nervous system have been explored by electrical stimulation of cerebrocortical regions in combination with recording neural activities in the interpolaris17 and the Sp5C.32,52 The suppressive tendency of nociceptive information processing in Sp5C neurons by stimulating the somatosensory cortex is supported by several other studies using c-Fos expression19 and optogenetics.7 Corticofugal projections also modulate the frequency and synchronization strength of oscillation activities in the interpolaris and principalis of the trigeminal complex.44
The insular cortex (IC) has been reported to process nociceptive information rather than tactile sensation.29,30,40,53 Direct descending projections from the IC to the Sp5C have been demonstrated in anatomical studies, which revealed the profiles of the IC→Sp5C projection as follows: (1) contralateral projection is dominant and (2) IC layer V pyramidal cells principally project onto laminae I and II.11,50,68 However, to date, almost no information is available on the roles of these corticofugal projections in modulating neural activities in the Sp5C.
Laminae I and II of the Sp5C involve excitatory projection neurons and inhibitory interneurons, and therefore, quantification of the impact of IC→Sp5C projections to excitatory and inhibitory neurons is critical to understand the functional role of the IC in nociceptive information processing in the Sp5C. This study aimed to reveal the features of synaptic transmission from the IC to glutamatergic and GABAergic/glycinergic Sp5C neurons using an optogenetic technique and to estimate inhibitory synaptic profiles from inhibitory to excitatory Sp5C neurons by paired whole-cell patch-clamp recording. We further examined the functional role of the IC→Sp5C projection in the facial pain by extracellular recording and behavioral testing in combination with chemogenetics.
2. Materials and methods
All experiments were performed in accordance with the National Institutes of Health Guide for the Care and Use of Laboratory Animals and were approved by the Institutional Animal Care and Use Committee at Nihon University. All efforts were made to minimize the number of animals used and their suffering.
2.1. Animals
We used adult vesicular GABA transporter (VGAT)-Venus line A transgenic rats39,60 for the following optogenetic experiments. Four- to five-week-old rats of either sex were anesthetized with 1.5% to 2.0% isoflurane (Mylan, Tokyo, Japan) and placed in a stereotaxic frame. The skull surface was exposed, and a small hole was drilled to insert a needle filled with 1.0-µL virus suspension containing an adeno-associated virus (AAV) encoding modified channelrhodopsin-2 (ChR2) fused to mCherry under the control of the human synapsin promotor (AAV5-hSyn-ChR2 (H134R)-mCherry (AAV-ChR2-mCherry); Penn Vector Core, Philadelphia, PA). The titer of the injected virus was ≥ 7 × 10¹² vg/mL. The virus suspension was administered at a rate of 75 nL/min into the IC with 2- or 10-µL Hamilton syringes (Hamilton, Reno, NV) and an automated injection system (Legato 130, KD Scientific, Holliston, MA). The stereotaxic coordinates of virus injection were 0 to 0.50 mm posterior to the bregma, 4.33 to 4.35 mm lateral to the midline, and 4.33 to 4.35 mm deep. After the injection procedure, the incised skin was sutured with 5-0 silk threads.
To identify projection neurons in the Sp5C, we injected cholera toxin subunit B conjugated with Alexa Fluor 647 (cholera toxin subunit B [CTB]; Molecular Probes, Eugene, OR) into the PBN, one of the nuclei that receives excitatory projections from the Sp5C.49 In 134 rats that received an AAV-ChR2-mCherry injection, 0.5-µL CTB was injected using a 2-μL Hamilton syringe with the following stereotaxic coordinates: 9.5 mm posterior and 1.8 mm lateral to the bregma and 4.5 mm deep.
In the experiment for unitary inhibitory postsynaptic current (uIPSC) recording, we used VGAT-Venus rats (postnatal weeks 4-5; n = 57) that had not received an AAV-ChR2-mCherry injection. Some of these VGAT-Venus rats (n = 7) were injected with CTB to identify the projection neurons in the Sp5C.
2.2. Slice preparations
At least 4 weeks after the injection of AAV-ChR2-mCherry, the animals were used for optogenetic experiments. The in vitro slice preparation technique was similar to previously described techniques38,61,66 without the recipe of ice-cold modified artificial cerebrospinal fluid (ACSF).57 Briefly, rats were deeply anesthetized with isoflurane (5%) and transcardially perfused with ice-cold modified ACSF: 2.5 KCl, 0.5 CaCl2, 10 MgSO4, 1.25 NaH2PO4, 2 thiourea, 3 sodium pyruvate, 92 N-methyl-d-glucamine, 20 N-(2-hydroxyethyl)piperazine-N′-2-ethanesulfonic acid (HEPES), 25 d-glucose, 5 L-ascorbic acid, and 30 NaHCO3 (in mM; pH 7.35-7.40). After decapitation, tissue blocks including the Sp5C were rapidly removed and stored in ice-cold modified ACSF. Coronal slices were cut at a thickness of 300 μm using a microslicer (Linearslicer Pro 7, Dosaka EM, Kyoto, Japan). After cutting the slices, the modified ACSF was replaced according to Ting et al.57; then, the slices were incubated in holding ACSF, the composition of which was as follows: 2.5 KCl, 2 CaCl2, 2 MgSO4, 1.25 NaH2PO4, 2 thiourea, 3 sodium pyruvate, 92 NaCl, 20 HEPES, 25 d-glucose, 5 L-ascorbic acid, and 30 NaHCO3 (in mM; pH 7.35-7.40). Modified and normal ACSF were continuously aerated with a mixture of 95% O2 and 5% CO2. The slices were finally transferred to a recording chamber with normal ACSF containing 126 NaCl, 3 KCl, 2 MgSO4, 1.25 NaH2PO4, 26 NaHCO3, 2 CaCl2, and 10 d-glucose (in mM) at room temperature.
2.3. Multiple whole-cell patch-clamp recordings
The slices including the Sp5C were placed in a recording chamber that was perfused continuously with normal ACSF at a rate of 2.4 mL/min. To minimize the adherence of drugs to the perfusion route, we used an infusion pump whose head was made of polytetrafluoroethylene (Q-100-TT-P-S, TACMINA, Osaka, Japan) and silicone tubes (C-flex tubing, Cole-Parmer Instrument, Vernon Hills, IL).
Multiple whole-cell patch-clamp recordings were obtained from Venus-positive and Venus-negative neurons located in laminae I/II by using a fluorescence microscope equipped with Nomarski optics (BX61W1, Olympus, Tokyo, Japan) and an infrared-sensitive video camera (IR-1000, DAGE-MTI, Michigan City, IN). The voltage responses of Venus-positive and Venus-negative neurons were recorded by injection of depolarizing and hyperpolarizing current pulses (1 second) to examine basic membrane properties, including input resistance, single spike kinetics, the voltage-current relationship, and repetitive firing patterns and frequency. The distance between the recorded cells was < 100 μm. Electrical signals were recorded with amplifiers (Multiclamp 700B, Molecular Devices, Sunnyvale, CA) and a digitizer (Digidata 1440A, Molecular Devices), observed online, and stored on a computer hard disk using Clampex (pClamp 10, Molecular Devices).
Thin-wall borosilicate patch electrodes (3-5 MΩ) were pulled on a Flaming-Brown micropipette puller (P-97, Sutter Instruments, Novato, CA). In the optogenetics experiment, the pipette solution contained the following components (ECl− = −65 mV) (in mM): 135 potassium gluconate, 10 HEPES, 0.5 ethylene glycol-bis(2-aminoethylether)-N,N,N′,N′-tetraacetic acid (EGTA), 2 MgCl2, 2 magnesium adenosine triphosphate (ATP), and 0.3 sodium guanosine triphosphate (GTP). In the uIPSC recording, the composition of the pipette solution was as follows (in mM): 85 potassium gluconate, 70 KCl, 10 HEPES, 0.5 EGTA, 2 MgCl2, 2 magnesium ATP, and 0.3 sodium GTP. The equilibrium potential of Cl− (ECl−) was −15 mV. Both pipette solutions had a pH of 7.3 and an osmolarity of 290 ± 5 mOsm. The liquid junction potentials of the high- and low-[Cl−]i pipette solutions described above were −9 mV and −6 mV, respectively. The voltage was not corrected in this study. Recordings were obtained at room temperature. The seal resistance was > 10 GΩ, and only data obtained from electrodes with access resistance of 6 to 20 MΩ and with < 20% change during recordings were included in this study.
To activate ChR2, which is expressed in IC neuronal axons, we collimated blue light (470 nm) using an LED system (COP1-A, Thorlabs, Newton, NJ) through a water-immersion 40X microscope objective. Photostimulation was applied to the slices for 5 milliseconds. To determine whether the photostimulation-evoked synaptic responses were monosynaptic or polysynaptic, we applied tetrodotoxin (TTX, 1 μM; Abcam, Cambridge, United Kingdom), 4-aminopyridine (4-AP; 1 mM; Nacalai Tesque, Kyoto, Japan), and 6,7-dinitroquinoxaline-2,3-dione (DNQX, 40 µM; Abcam).
In the uIPSC recording, we performed paired whole-cell patch-clamp recording, and cells were recorded under voltage-clamp conditions (holding potential = −60 mV) because of the possibility that some cell pairs had reciprocal connections. Paired short depolarizing voltage step pulses (1-ms duration with a 50-ms interval, 80 mV) were applied to presynaptic cells to induce action currents at 20-second intervals. The uIPSC amplitude during drug application was recorded and monitored online. To examine whether GABAA or glycinergic receptors contributed to uIPSCs, bicuculline (10 µM; Tocris Bioscience, Bristol, United Kingdom) and/or strychnine (1 µM; Tokyo Chemical, Tokyo, Japan) was applied.
All drugs were bath-applied to the perfusate. Other compounds were purchased from Wako Pure Chemical Industries (Osaka, Japan).
2.4. Extracellular recording from spinal subnucleus caudalis neurons
Male VGAT-Venus line A transgenic rats (8 weeks old, n = 8) were used for extracellular recordings of Sp5C neurons. Under anesthesia with an intraperitoneal injection of butorphanol at 2.5 mg/kg (Meiji Seika Pharmaceutical, Tokyo, Japan), medetomidine at 0.375 mg/kg (Xenoac, Fukushima, Japan), and midazolam at 2.0 mg/kg (Sand, Tokyo, Japan), rats were fixed to the stereotaxic frame. In a similar way of the virus injection, a needle was implanted into the IC, and then, the medulla and upper cervical spinal cord were exposed. After the craniotomy, rats were immobilized by rocuronium bromide (0.6 mg/kg/h, intravenous; MSD, Tokyo, Japan). After tracheotomy, rats were respired artificially with oxygen (0.5 L/min) and isoflurane (1.0%-2.0%).
Laminectomy was performed to expose Sp5C, and a pool was made with skin flaps around the laminectomy. The brainstem was kept moist by isotonic saline. Enamel-coated tungsten electrodes (impedance = 10 MΩ at 1000 Hz; FHC, Bowdoin, ME) were penetrated into the Sp5C, and single neuronal activities were obtained from wide-dynamic-range (WDR) neurons that responded to non-noxious stimuli and to a greater degree to noxious stimuli.25 Neuronal responses were amplified using an amplifier (BNC-16B, Plexon, Dallas, TX) and stored in the computer hard disk. Spikes were sorted, and spike frequencies were analyzed using the Spike 2 software (CED 1401, Cambridge Electronic Design, Cambridge, United Kingdom). Non-noxious mechanical stimulation and noxious stimulation were applied to the whisker pad and/or surrounding facial skin by brushing with a camel-hair brush and by pinching with a small arterial clip applied for 5 seconds, respectively. After identification of WDR neurons, we injected the normal ACSF, whose K+ concentration was 3.5 mM, into the right IC at the rate of 20 μL/min for 30 seconds through the cannula. And then, we recorded WDR neuronal activities responding to the mechanical and noxious stimuli. Subsequently, we recorded WDR neuronal activities just after injection of the high-K+ ACSF that increases spontaneous spike firing of cortical neurons.48 In the high-K+ ACSF, 1.5-mM NaCl was substituted with 1.5-mM KCl, and as a result, [K+]o was 5 mM. The interval between each recording was set at 5 to 10 minutes.
During extracellular recordings, end-tidal CO2 concentration was kept at 4.0 ± 0.5% using a CO2 analyzer (CAPSTAR-100, CWE, Ardmore, PA), and body temperature was monitored and maintained at 37°C by a feedback-controlled heating blanket (Nihon Koden, Tokyo, Japan). Heart rate was continuously monitored using a bioelectric amplifier (AB-651J, Nihon Koden). The concentration of isoflurane was appropriately increased once the heart rate was increased after stimulation.
2.5. Behavioral testing
AAV2-hSyn-hM3D(Gq)-mCherry (Addgene, Watertown, MA) was injected into the bilateral IC of 4-week-old male rats (n = 26). Animals were anesthetized with 2% isoflurane. After exposure of the skull, 2 small holes were made to inject AAV into the IC bilaterally using a 2-μL Hamilton syringe (Hamilton) and the automated injection system (KD Scientific). The stereotactic coordinates of the injection sites were the same as described above. Per injection site, 0.8 μL of AAV was injected at a flow rate of 75 nL/min. After each injection, the syringe was left in place for an additional 10 minutes. Afterward, the skin was closed. After 4 to 5 weeks, intrathecal operations were conducted under 2% isoflurane. The occipital bone was exposed, and a small hole was drilled to insert a polyethylene tube (0.8 mm in diameter, Natsume, Tokyo, Japan) approximately 5 mm into the cisterna magna. The tube was immediately attached to the occipital bone with instantaneous adhesive and was fixed to the skull with a stainless steel screw and dental resin. The end of the tube was exposed outside of the skin. After the surgery, the rats were allowed 5 to 7 days to recover. Intrathecal injection of 6-μg clozapine N-oxide in 10 μL (CNO; Enzo Life Sciences, Farmingdale, NY) or vehicle was infused through the cannula 30 minutes before behavioral testing under 2% isoflurane.
Rats were put into an acryl tube, and mechanical stimulation was applied to their whisker pads using von Frey filaments (5, 10, 20, 30, 40, 50, 60, 70, 80, 90, and 100 g). von Frey filaments were perpendicularly applied to the whisker pad, which is innervated by the second branch of the trigeminal nerve. Other rats received heat stimulation by a radiant heat stimulator (Bio Research Center, Nagoya, Japan), and the head withdrawal latency to heat stimulation was measured. The head withdrawal reflex threshold (HWT) for heat or mechanical stimulation was recorded 3 times before CNO or vehicle injection. After the injection, the HWT was measured at 30- to 60-minute intervals for 7 hours. At each time point, the HWT was measured 3 times and averaged in each rat. All behavioral tests were conducted by a single experimenter under the blind condition.
2.6. Anatomy
To identify injection sites of AAV-ChR2-mCherry and CTB, coronal slices including the IC or PBN were also prepared in parallel to prepare Sp5C slices. These slices were transferred to a recording chamber on a confocal microscope (FV-1000, Olympus), and the injection sites were imaged through a 4× objective with a resolution of 1600 × 1600 pixels.
Recording sites of Sp5C WDR neurons were identified by a lesion made by application of anodal DC currents (10 μA, 20 seconds) through a recording micropipette. After perfusion of 4% paraformaldehyde, the brain was cryoprotected in 20% sucrose solution. Frozen coronal sections (50 µm) were cut and stained with cresyl violet to visualize the recording sites. The path of the electrode track was constructed in combination with micromanipulator readings.
In a part of the experiment for behavioral analysis, Evans blue (2%, 10 μL; Sigma-Aldrich, St. Louis, MI) was applied to examine the diffusion profile of CNO. Three hours later, the rats were deeply anesthetized with isoflurane (5%) and transcardially perfused with 4% paraformaldehyde. The brains were sectioned into 50-μm thickness. Sections were observed using a fluorescence microscope (BZ-9000, Keyence, Osaka, Japan). Each fluorescent image of the coronal section was obtained using the same parameters, such as the exposure time.
2.7. Data analysis
Clampfit (pClamp 10, Molecular Devices) was used to analyze electrophysiological data. The average amplitude and paired-pulse ratio (PPR) determined by the ratio of the peak amplitude of the second uIPSCs to that of the first uIPSCs were obtained from 10 to 20 consecutive sweeps. Unitary inhibitory postsynaptic current failure was defined as less than 3 times the SD of the baseline.
The WDR neuronal discharges induced by stimulation were quantified by subtracting background activity from evoked activity. The responses of Sp5C WDR neuron activities to the mechanical and noxious stimuli were compared between normal and high-K+ ACSF application into IC. Poststimulus histograms (bin = 1 second) were generated in response to each stimulus.
2.8. Statistical analysis
The values are expressed as the mean ± SEM. Differences in the mean values between the 2 groups were compared with the paired t test or Student t test. The paired t test with Bonferroni correction was used in the case of 2 comparisons among the 3 groups. One-way analysis of variance (ANOVA) was used for comparisons among the 3 groups. Pearson's correlation test was used to compare the distribution between the number of spikes and photostimulation-induced excitatory postsynaptic currents (pEPSC) amplitudes among Venus-positive, CTB-positive, and Venus- and CTB-negative neurons. Averaged firing frequencies responding to the mechanical and nociceptive stimuli were compared between normal ACSF and high-K+ ACSF injection using the paired t test. Two-way ANOVA for repeated measures with the factors time and treatment followed by a post hoc Bonferroni test was used for the analysis of the HWT in response to mechanical and heat stimulation. Differences with a probability (P) less than 0.05 were considered significant.
3. Results
We first classified Sp5C neurons in laminae I and II by their repetitive firing properties and Venus fluorescence. Excitatory postsynaptic currents and IPSCs evoked by ChR2 photostimulation expressed in IC neuronal axons (pEPSCs and pIPSCs, respectively) were recorded from these neurons. Next, paired whole-cell patch-clamp recordings of Venus-positive (GABAergic/glycinergic) neurons and Venus-negative (glutamatergic) neurons were conducted to quantify uIPSCs in the Sp5C. Furthermore, we examined the effect of selective IC terminal activation by photostimulation on the repetitive firing properties of Venus-negative neurons. Finally, behavioral tests using chemogenetics were performed to evaluate the HWT for mechanical and heat stimulation.
3.1. AAV-ChR2-mCherry injection into the insular cortex and cholera toxin subunit B injection into the parabrachial nucleus
Corticofugal projection from the IC to the Sp5C is contralaterally dominant.11,50 Therefore, AAV-ChR2-mCherry was injected into the right IC of VGAT-Venus rats (Fig. 1A), and whole-cell patch-clamp recordings of neurons in the left Sp5C were performed. Our previous studies have demonstrated that nociceptive information from oral structures, including dental pulps and periodontal ligaments, is processed in the subregion of the IC just caudal to the middle cerebral artery (insular oral region [IOR]).23,24,40,41 Therefore, we administered a targeted AAV-ChR2-mCherry injection to the IOR. As part of the experiment, CTB was injected into the left PBN to identify projection neurons in the Sp5C (Fig. 1B).
Figure 1.
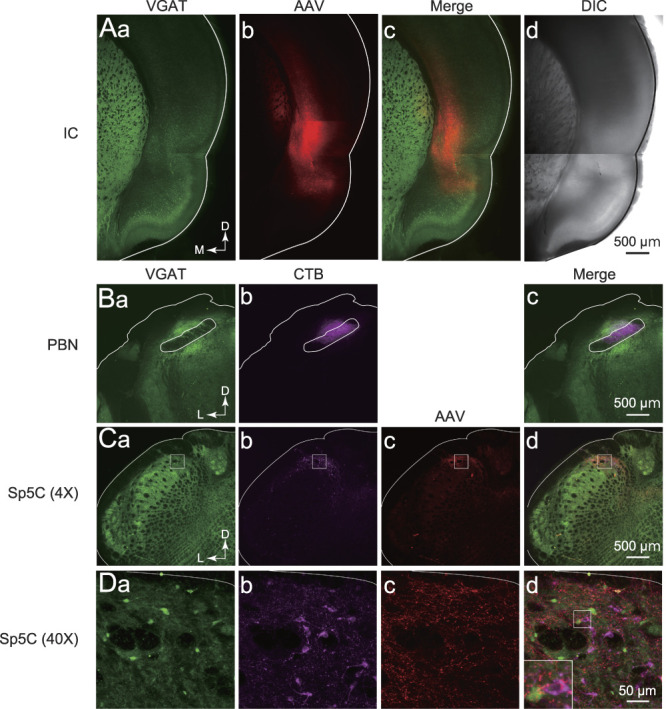
Confocal images of adeno-associated virus serotype 5 (AAV-5.hSyn.hChR2(H134R)-mCherry; AAV) and cholera toxin subunit B (CTB) conjugated with Alexa 647 in the insular cortex (IC), parabrachial nucleus (PBN), and Sp5C neurons. (A) AAV (red) was injected into the IC (Ab) of VGAT-Venus transgenic rats, in which GABAergic and glycinergic neurons were labeled with a green fluorescent protein, Venus (VGAT; Aa). (Ac) Shows the merged image of (Aa and Ab). (Ad) Shows a translucent image of the same fields in (Aa–Ac). (B) CTB (magenta) injection site in the PBN. (C) A transverse section of Sp5C showing neurons labeled with VGAT (Ca), CTB (Cb), and AAV (Cc). Inhibitory neurons labeled with VGAT (Ca). IC descending axons labeled with AAV (Cc). (Ca–Cc) Are merged in (Cd). (D) High-magnification images indicated by the rectangles in (C). The high-magnification image of the area indicated by the rectangle in (Dd) was shown in the inset. Calibration bars are shown in each right panel. D, dorsal; DIC, differential interference contrast; L, lateral; M, medial; Sp5C, spinal subnucleus caudalis; VGAT, vesicular GABA transporter.
In agreement with the anatomical study,50 most mCherry-positive fibers were found in the dorsal and/or dorsolateral Sp5C, which receive projections of the third and second branches of the trigeminal nerve, respectively (Fig. 1C). Cholera toxin subunit B–positive neurons were principally found in the upper laminae and were Venus-negative, suggesting that projection neurons in the Sp5C to the PBN are glutamatergic (Fig. 1D). Corticofugal projections from the IC to the Sp5C partially overlapped with CTB-positive neurons and adjacent Venus-positive neurons (Fig. 1D), suggesting that IC neurons project to both excitatory projection neurons and GABAergic/glycinergic neurons in the Sp5C.
3.2. Classification of spinal subnucleus caudalis neurons by their electrophysiological profiles and Venus fluorescence
Neuronal subtypes in laminae I and II of the Sp5C have been classified by their morphological and electrophysiological features.33,34 In this study, we discriminated inhibitory neurons from excitatory neurons by the fluorescence of the Venus protein, which is expressed in VGAT-positive neurons. We further classified inhibitory neurons into 3 subtypes according to their repetitive firing properties in reference to the study by Sedlacek et al.51 To obtain the firing characteristics, we recorded active and passive membrane properties provided by injecting depolarizing and hyperpolarizing current steps into Venus-positive neurons (Fig. 2).
Figure 2.
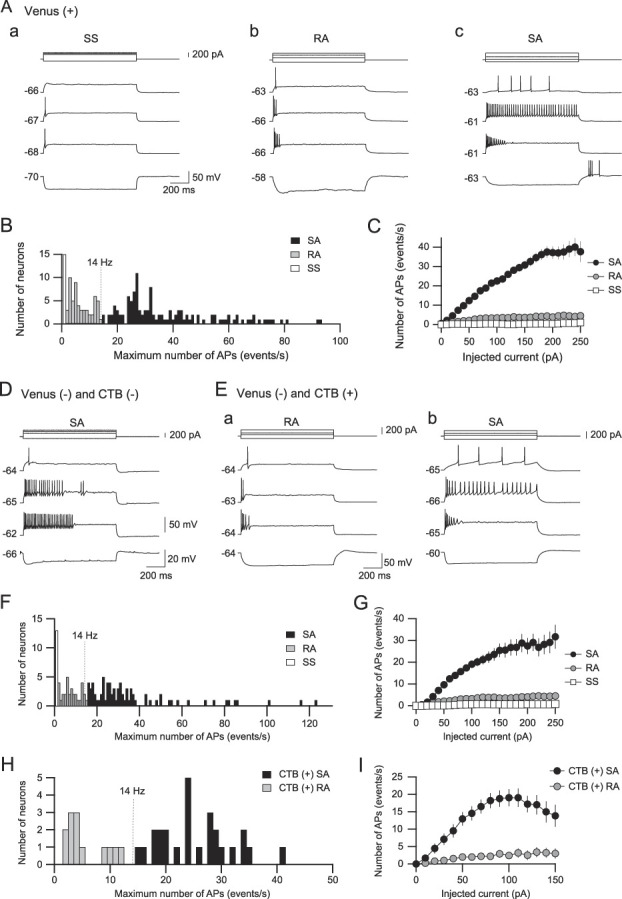
Classification of Sp5C neuron subtypes by their repetitive firing properties. (A) Membrane potential responses of Venus-positive neurons to long depolarizing and hyperpolarizing current pulse injection. Single-spiking (SS) neurons evoked only 1 action potential during 1-second depolarizing current pulses (Aa). Rapidly adapting (RA) neurons showed action potentials that occurred in the initial phase of depolarizing current pulses (Ab). Slowly adapting (SA) neurons showed repetitive firing through depolarizing current pulses, although larger depolarized current pulses often induced spike adaptation (Ac). The calibrations in (Aa) also apply to (Ab and Ac). (B) A histogram of the maximum number of action potentials (APs). Rapidly adapting and SA neuron activity can be divided into 2 groups at a threshold of 14 Hz. (C) The number of action potentials responding to 1-second depolarizing current pulse injections is plotted against their current intensity. (D) An example of SA neurons among Venus- and CTB-negative neurons. (E) Membrane potential responses of Venus-negative and CTB-positive neurons. These neurons are classified into RA (Ea) and SA (Eb) neurons but not SS neurons. (F) A histogram of the maximum number of action potentials. Rapidly adapting and SA neurons are divided into 2 groups at a threshold of 14 Hz. (G) The number of action potentials responding to 1-second depolarizing current pulse injections is plotted against their current intensity. (H) A histogram of the maximum number of action potentials. Rapidly adapting and SA neurons are divided at the threshold of 14 Hz. (I) The number of action potentials responding to 1-second depolarizing current pulse injections is plotted against their current intensity. The value on the left of each trace indicates the resting membrane potential. Sp5C, spinal subnucleus caudalis; CTB, cholera toxin subunit B.
By intracellularly injecting long (1 second) depolarizing current pulses, Venus-positive neurons were classified into single-spiking (SS), rapidly adapting (RA), and slowly adapting (SA) neurons (Fig. 2A). Single-spiking neurons showed a single action potential responding to large depolarizing current pulses (≥200 pA, Fig. 2Aa). Rapidly adapting neurons exhibited several action potentials in the initial phase followed by a prolonged refractory phase (Fig. 2Ab). By contrast, SA neurons showed repetitive firing with less adaptation, but larger depolarized current pulses (≥300 pA) attenuated the number of spikes in response to the later depolarizing current pulses (Fig. 2Ac). We quantitatively discriminated RA neurons from SA neurons by the absence of spikes in the later 500-millisecond current pulses.
A histogram was created to visualize the distribution of the maximum number of action potentials in Venus-positive neurons and showed a trough at approximately 14 Hz (Fig. 2B). Figure 2C shows the relationship between the number of spikes over 1 second and the intensity of injected currents in SS (n = 15), RA (n = 56), and SA neurons (n = 122). Rapidly adapting neurons showed that the number of action potentials reached a plateau at approximately 100 pA of the current intensity, which was somewhat lower than that of SA neurons (∼200 pA). The maximum number of action potentials of SA neurons (39.0 ± 1.7 spikes/s, n = 122), which was obtained by averaging the maximum number of action potentials responding to 0- to 250-pA current injection in each SA neuron, was much larger than that of SS neurons (1.0 ± 0.0 spikes/s, n = 15, t(135) = 7.608, P < 0.0001, Student t test with Bonferroni correction) and RA neurons (7.0 ± 0.5 spikes/s, n = 56, t(176) = 12.31, P < 0.0001, Student t test with Bonferroni correction).
By applying the same criteria as those used for the classification of Venus-positive neurons, Venus-negative neurons were classified into the same 3 groups as Venus-positive neurons: SS, RA, and SA neurons (Figs. 2D–G). The maximum number of action potentials of Venus-negative SA neurons (37.0 ± 2.7 spikes/s, n = 76) was comparable with those of Venus-positive SA neurons (t(196) = 0.6489, P = 0.52, Student t test with Bonferroni correction). The maximum number of action potentials of Venus-negative SA neurons was also significantly larger than that of Venus-negative SS neurons (1.0 ± 0.0 spikes/s, n = 13, t(87) = 5.556, P < 0.0001, Student t test with Bonferroni correction) and RA neurons (7.7 ± 0.7 spikes/s, n = 31; t(105) = 6.965, P < 0.0001, Student t test with Bonferroni correction), which was also comparable with that of Venus-positive RA neurons (t(105) = 6.965, P = 0.40, Student t test with Bonferroni correction).
Some Venus-negative neurons were CTB-positive, and these neurons were classified as either RA or SA neurons (Figs. 2Ea and b) but not as SS neurons (Figs. 2H and I). The maximum number of action potentials of CTB-positive SA neurons was 25.4 ± 1.3 spikes/s (n = 26), which was significantly smaller than that of Venus-positive SA neurons (t(146) = 3.54, P = 0.0005, Student t test with Bonferroni correction). However, the maximum number of action potentials of CTB-positive RA neurons (5.8 ± 1.0 spikes/s, n = 13) was comparable with that of Venus-positive RA neurons (t(66) = 0.9598, P = 0.3407, Student t test with Bonferroni correction).
3.3. Photostimulation-induced excitatory postsynaptic currents in spinal subnucleus caudalis neurons
To examine the physiological properties of descending axons from the IC to Sp5C neurons in laminae I/II, including neurons projecting to the PBN, whole-cell patch-clamp recordings of Sp5C neurons in slice preparations, which involved axon terminals of IC neurons infected with AAV-ChR2-mCherry, were performed (Fig. 3A).
Figure 3.

Excitatory postsynaptic currents (EPSCs) recorded from Sp5C neurons by photostimulation of terminals originating from IC projection neurons. (A) Nomarski and fluorescent images of recorded neurons. Left, a CTB-positive neuron. Right, a Venus-positive neuron. (B) Subthreshold and suprathreshold responses of each neuron shown in (A). The value on the left of each trace indicates the resting membrane potential. (C) A schematic figure of simultaneous recordings from a Venus-positive neuron and a Venus-negative neuron to obtain light-evoked synaptic responses. (D) A simultaneous recording of synaptic potentials in a CTB-positive neuron and a Venus-positive neuron under the current-clamp condition. Both neurons are depolarized by photostimulation. Averaged traces shown in black are superimposed on 10 consecutive traces (gray). (E) A simultaneous recording of photostimulation-induced EPSCs (pEPSCs) in the same CTB-positive neuron and Venus-positive neuron shown in (D) under voltage-clamp conditions (VH = −60 mV). (F–H) The relationship between the number of action potentials and pEPSC amplitude in Venus-positive (F), CTB-positive (G), and Venus- and CTB-negative neurons (H). (I) The amplitude of each pEPSC (open circles) with their averages (bars) in Venus-positive, CTB-positive, and Venus- and CTB-negative neurons. No significant differences were found among them. (J) The pEPSC amplitude obtained by simultaneous recording from Venus-positive and Venus-negative neurons. AP, aminopyridine; ChR2, channelrhodopsin-2; CTB, cholera toxin subunit B; IC, insular cortex; Sp5C, spinal subnucleus caudalis.
Figures 3A–E shows an example of paired whole-cell patch-clamp recordings of CTB-positive and Venus-positive neurons that were simultaneously recorded in the same slice preparation (Fig. 3A). Long depolarizing current pulse injections induced repetitive firing in both CTB-positive and Venus-positive neurons, as shown in Figure 3B, indicating that both neurons were classified as SA neurons. After the identification of neural subtypes by examining repetitive firing properties, ChR2 was activated by blue light application (Fig. 3C). Under the current-clamp condition, photostimulation of ChR2 by blue light (duration = 5 ms, interstimulus interval = 100 ms) induced excitatory postsynaptic potentials (EPSPs) without failure in both CTB-positive and Venus-positive SA neurons (Fig. 3D). In these CTB-positive and Venus-positive SA neurons, photostimulation induced larger EPSP amplitudes in the CTB-positive SA neuron than in the Venus-positive neuron. Under voltage-clamp conditions (VH = −60 mV), photostimulation constantly induced pEPSCs in both CTB-positive and Venus-positive neurons (Fig. 3E).
Figures 3F–H shows summary results obtained from 3 types of neurons, Venus-positive, CTB-positive, and Venus- and CTB-negative neurons, each of which is classified as either SS, SA, or RA neurons. There was a significant correlation between the maximum number of repetitive spikes and pEPSC amplitudes in Venus-positive neurons (r = 0.45, n = 40, P = 0.0034, Pearson's correlation test; Fig. 3F). On the other hand, no significant correlation was found in CTB-positive neurons (r = −0.03, n = 18, P = 0.90, Pearson's correlation test; Fig. 3G) or in Venus- and CTB-negative neurons (r = 0.02, n = 33, P = 0.91, Pearson's correlation test; Fig. 3H). Therefore, in the following analyses, we combined SS, SA, and RA data into 1 group.
Figure 3I shows the summary results of pEPSC amplitudes in Venus-positive, CTB-positive, and Venus- and CTB-negative neurons, including single whole-cell patch-clamp recordings. There was no significant difference in pEPSC amplitude among neural subtypes (F(2, 88) = 0.3324, P = 0.7181, 1-way ANOVA test), suggesting that descending IC inputs to Sp5C neurons induce EPSCs without a significant difference in their amplitude among neural subtypes.
A possible criticism for this analysis is that the amplitude of pEPSCs could depend on slice conditions, eg, some slices included an abundance of IC terminals, but others had few IC terminals. This issue was examined by comparing the results obtained from multiple whole-cell patch-clamp recordings, as shown in Figures 3A–E. Simultaneous recording from multiple Sp5C neurons minimized the variation in the descending projection density from the IC in every slice preparation. Figure 3J indicates the pEPSC amplitude obtained from Venus-positive and Venus-negative Sp5C neurons. Each Venus-positive and Venus-negative neuron was simultaneously recorded from the same slice preparation at a distance < 100 μm. There was no significant difference in pEPSC amplitude between Venus-positive (25.9 ± 14.9 pA) and Venus-negative neurons (15.7 ± 5.5 pA, n = 16, t(15) = 0.5934, P = 0.56, paired t test).
These results suggest that IC axon terminals induce a comparable amplitude of EPSCs among neuronal cell subtypes in the Sp5C.
3.4. Photostimulation-induced excitatory postsynaptic currents are sensitive to tetrodotoxin and 4-aminopyridine
There is a possibility that pEPSCs are polysynaptically activated. In other words, IC axons may indirectly evoke EPSCs in Sp5C neurons. It has been reported that photostimulation of ChR2 with axonal terminal depolarization by 4-AP, a K+ channel blocker, induces glutamate release under the blockade of voltage-gated Na+ channels.14 Therefore, it is possible to determine whether pEPSCs are monosynaptic or polysynaptic.
In all types of neurons (Figs. 4A–C), application of TTX (1 μM) consistently diminished pEPSCs (Figs. 4D–F): 16.8 ± 5.1 pA in the control condition to 1.6 ± 0.8 pA under TTX application in Venus-positive neurons (n = 9, t(8) = 3.621, P = 0.0068, paired t test; Figures 4A, D, G), 28.6 ± 10.9 pA to 3.2 ± 0.6 pA in CTB-positive neurons (n = 8, t(7) = 2.527, P = 0.0394, paired t test; Figures 4B, E, H), and 27.4 ± 6.3 pA to 1.9 ± 0.9 pA in Venus- and CTB-negative neurons (n = 9, t(8) = 4.007, P = 0.0039, paired t test; Figures 4C, F, I).
Figure 4.
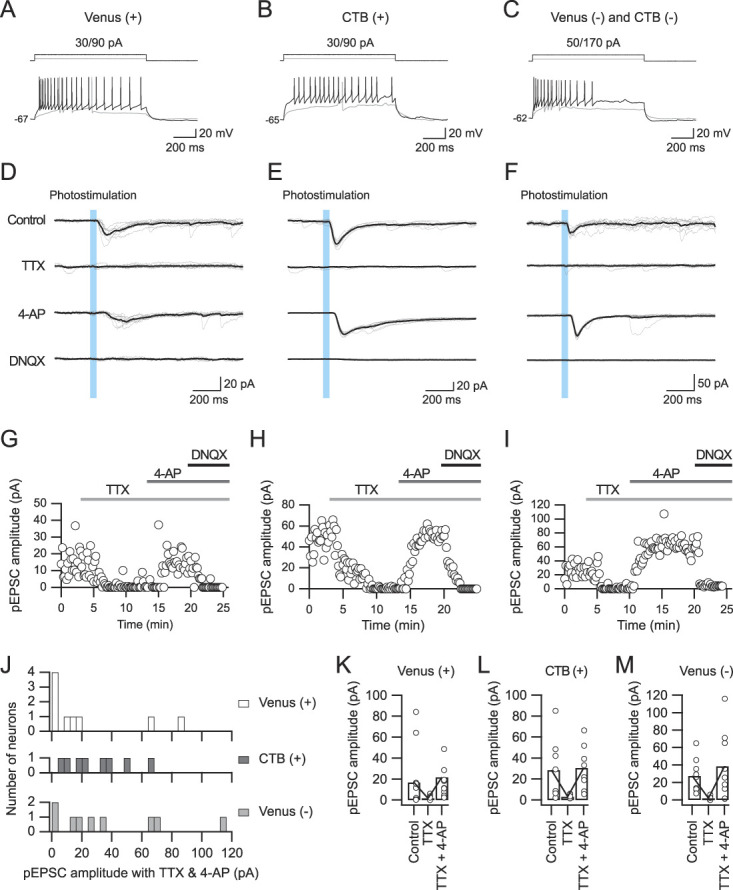
The sensitivity of pEPSCs to tetrodotoxin (TTX) and 4-aminopyridine (4-AP). (A–C) Repetitive firing properties of Venus-positive (A), CTB-positive (B), and Venus- and CTB-negative neurons (C). (D–F) pEPSCs evoked by IC fiber stimulation in the control condition (top) and under application of 1-μM TTX (the second from the top), 1-mM 4-AP (the second from the bottom), and 40-μM DNQX (bottom). Note the rescue of TTX-sensitive EPSCs by 4-AP. EPSCs were abolished by DNQX. VH = −60 mV. (G–I) Time courses of the pEPSC amplitude during the application of TTX, 4-AP, and DNQX in the neurons shown in (A–F). (J) The populations of Venus-positive, CTB-positive, and Venus- and CTB-negative neurons showing the pEPSC amplitude after application of 4-AP. (K–M) The amplitudes of pEPSCs in the control condition and during application of TTX and 4-AP in Venus-positive (K), CTB-positive (L), and Venus- and CTB-negative neurons (M). AP, aminopyridine; CTB, cholera toxin subunit B; DNQX, dinitroquinoxaline; IC, insular cortex; pEPSC, photostimulation-induced excitatory postsynaptic current.
Application of 4-AP (1 mM) in combination with TTX rescued pEPSCs in 55% of Venus-positive neurons (n = 9), 100% of CTB-positive neurons (n = 8), and 78% of Venus- and CTB-negative neurons (n = 9), as shown in Figure 4J. The mean amplitudes of pEPSCs under the application of TTX and 4-AP were 21.7 ± 10.9 pA in Venus-positive neurons (n = 9; Fig. 4K), 30.7 ± 7.5 pA in CTB-positive neurons (n = 8; Fig. 4L), and 38.5 ± 12.8 pA in Venus- and CTB-negative neurons (n = 8; Fig. 4M). The residual pEPSCs were diminished by the additional application of DNQX (40 μM), an AMPA receptor antagonist, indicating that pEPSCs were evoked through activation of AMPA receptors.
These results suggest that most laminae I/II neurons are monosynaptically activated by IC projections.
3.5. Photostimulation-induced inhibitory postsynaptic currents in spinal subnucleus caudalis neurons
In addition to pEPSCs, pIPSCs were observed in 8.8% (7/80 neurons) of neurons that exhibited synaptic responses. All these neurons were Venus-negative, whereas no Venus-positive neurons showed pIPSCs. Figure 5 shows an example of pIPSCs in Venus-negative neurons in the Sp5C recorded with a low Cl− patch pipette solution. Tetrodotoxin (1 μM) diminished pIPSCs; however, 4-AP (1 mM) in combination with TTX did not rescue pIPSC activity (Figs. 5B and C), suggesting that these pIPSCs were polysynaptically evoked. Only 1 Venus-negative Sp5C neuron showed pEPSCs accompanied by pIPSCs (Fig. 5D).
Figure 5.

Inhibitory postsynaptic currents (IPSCs) induced by photostimulation (pIPSCs) of a Venus-negative neuron in the Sp5C. (A) Firing in response to long depolarizing and hyperpolarizing current pulse injections recorded from a Venus-negative neuron. (B) pIPSCs evoked by IC fiber stimulation in the same neuron shown in (A). pIPSCs were abolished by 1-μM TTX and were not recovered by 1-mM 4-AP application. (C) The time course of pEPSC amplitudes during TTX and 4-AP application. (D) An example of pEPSCs followed by pIPSCs. AP, aminopyridine; IC, insular cortex; Sp5C, spinal subnucleus caudalis; TTX, tetrodotoxin.
These results suggest that photostimulation-evoked action potentials in inhibitory Sp5C neurons, some of which induced pIPSCs principally in glutamatergic excitatory neurons but not in GABA/glycinergic neurons in laminae I/II of the Sp5C; however, only a small population of Sp5C neurons induced pIPSCs by activating IC axon terminals.
3.6. Profiles of unitary inhibitory postsynaptic currents in Venus-positive and Venus-negative neurons
Although excitatory and inhibitory Sp5C neurons receive comparable excitatory inputs from the IC, it is still unclear whether descending projections from the IC play an excitatory or inhibitory role in excitatory outputs from the Sp5C to higher brain regions such as the PBN. If inhibitory neurons profoundly inhibit excitatory projection neurons, descending IC projections are likely to suppress ascending excitatory outputs from the Sp5C. Conversely, descending IC projections contribute to the facilitation of excitatory outputs from the Sp5C if inhibitory inputs to excitatory neurons in lamina I are faint. In addition, inhibitory inputs to inhibitory neurons should be considered to estimate the functional roles of descending IC projections. Therefore, we next examined inhibitory synaptic profiles in the Sp5Cs using paired whole-cell patch-clamp recordings, which enabled us to estimate the precise efficacy of inhibitory synaptic transmission.
Figure 6A shows a representative example of uIPSC1 and uIPSC2, the first and second uIPSCs, respectively, responding to paired-pulse stimulation of presynaptic Venus-positive neurons recorded from Venus-negative neurons. Action currents evoked by depolarizing voltage pulse injection to presynaptic Venus-positive neurons (Fig. 6Aab) induced uIPSCs with frequent failures in postsynaptic Venus-negative neurons (Fig. 6Ac). The other type of inhibitory connection, Venus-positive neurons to Venus-positive neurons, is shown in Figure 6B. Similar to the results shown in Figure 6A, the inhibitory connection showed uIPSCs with a high failure rate (Fig. 6Bc).
Figure 6.
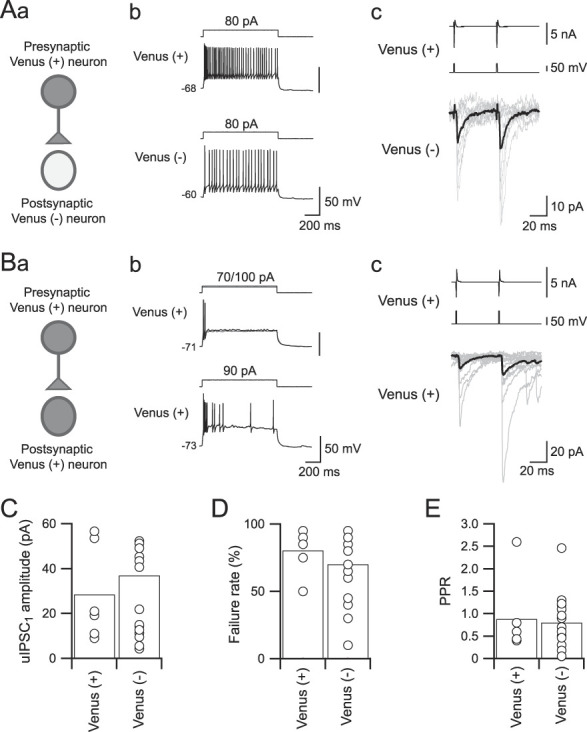
Unitary inhibitory postsynaptic current (uIPSC) profiles from Venus-positive to Venus-negative Sp5C neurons in laminae I/II. (Aa) A scheme for paired whole-cell patch-clamp recordings from a Venus-positive neuron and a synaptically connected Venus-negative neuron. (Ab) Firing properties of the recorded neurons shown in (Aa). (Ac) uIPSCs recorded from a postsynaptic Venus-negative neuron (bottom) evoked by paired depolarizing voltage pulse injection into the presynaptic Venus-positive neuron (middle; interstimulus interval = 50 ms). Top traces indicate action currents evoked in presynaptic Venus-positive neurons. Averaged traces shown in black are superimposed on 10 consecutive traces (gray). (Ba) A scheme for paired whole-cell patch-clamp recordings from a Venus-positive neuron and a synaptically connected Venus-positive neuron. (Bb) Firing properties of the recorded neurons shown in (Ba). (Bc) uIPSCs recorded from a postsynaptic Venus-positive neuron (bottom) evoked by paired depolarizing voltage pulse injection into a presynaptic Venus-positive neuron. (C–E) Summary of the first uIPSC (uIPSC1) amplitude (C), failure rate of uIPSCs (D), and paired-pulse ratio (PPR, E) recorded from Venus-positive and Venus-negative neurons. Each amplitude is calculated by averaging the uIPSC amplitude except for failures. Note no significant differences in the amplitude, failure rate, and PPR between Venus-positive and Venus-negative neurons. Sp5C, spinal subnucleus caudalis.
Summarized profiles of uIPSCs from Venus-positive neurons to Venus-negative or Venus-positive neurons are shown in Figure 6C. Both types of inhibitory connections showed comparable amplitudes of uIPSCs. The mean amplitudes of uIPSC1 were 28.4 ± 8.7 pA in the connections from Venus-positive to Venus-positive neurons (n = 6) and 36.9 ± 7.0 pA in the connections from Venus-positive to Venus-negative neurons (n = 17; t(21) = 0.6596, P = 0.51, Student t test, Fig. 6C). Failure rates of uIPSC1 were also comparable between the connections from Venus-positive to Venus-positive neurons (80.0 ± 6.6%, n = 6) and to Venus-negative neurons (70.3 ± 6.1%, n = 17; t(21) = 0.8725, P = 0.3928, Student t test; Fig. 6D). Similar to the uIPSC amplitude and failure rate, the PPR was also comparable between the connections from Venus-positive to Venus-positive neurons (0.87 ± 0.35, n = 6) and to Venus-negative neurons (0.80 ± 0.14, n = 17; t(21) = 0.2131, P = 0.8333, Student t test; Fig. 6E).
3.7. Unitary inhibitory postsynaptic currents mediated through glycinergic and GABAergic receptors
There are 2 principal inhibitory neurotransmitters in the brainstem, GABA and glycine.4 To examine which type of neurotransmitter contributes to uIPSCs in the connections from Venus-positive to Venus-negative neurons and those among Venus-positive neurons, we examined the effects of bicuculline, a GABAA receptor antagonist, and strychnine, a glycine receptor antagonist, on uIPSCs in the Sp5C.
Figure 7A shows a representative example of uIPSC recordings from Venus-positive to Venus-negative neurons. Bath application of bicuculline (10 μM) had little effect on uIPSCs recorded from the connection shown in Figures 7A–C. On the other hand, strychnine (1 μM) diminished uIPSCs, suggesting that glutamatergic excitatory neurons receive glycinergic but not GABAergic inhibitory inputs from Venus-positive neurons.
Figure 7.
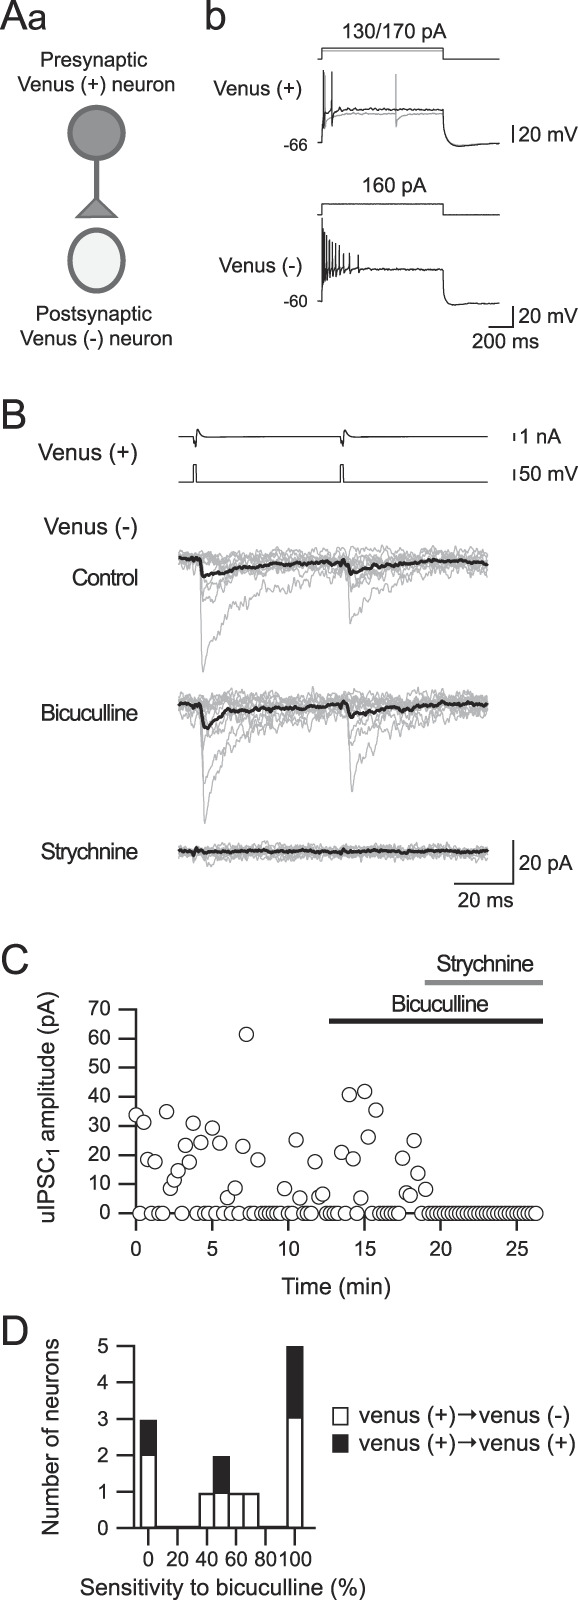
The sensitivity of unitary inhibitory postsynaptic currents (uIPSCs) to bicuculline and strychnine. (Aa) A scheme for paired recordings from a connection from Venus-positive to Venus-negative neurons. (Ab) Repetitive firing properties of the Venus-positive neuron (Aa). (B) uIPSCs recorded from the Venus-negative neuron shown in (A). Bicuculline application (10 μM) had little effect on uIPSC kinetics (the second from the bottom), whereas strychnine (1 μM) almost completely abolished uIPSCs (bottom). (C) Time courses of uIPSC amplitude during bicuculline and strychnine application. (D) Histogram showing uIPSC sensitivities to bicuculline in the connection of Venus-positive to Venus-negative and Venus-positive neurons.
In summary, the effect of bicuculline on uIPSC amplitude varied, as shown in Figure 7D. The average suppression rate of uIPSCs by bicuculline was 60.9 ± 0.8% (45.3 ± 0.5 pA in the control condition and 39.6 ± 1.3 pA under bicuculline application; n = 13; t(12) = 0.4522, P = 0.6592, paired t test). The residual uIPSCs after application of bicuculline were almost completely diminished by strychnine (from 39.6 ± 1.3 pA to 0.5 ± 0.0 pA; n = 13; t(12) = 2.341, P = 0.0037, paired t test).
These results support the above hypothesis that glutamatergic excitatory neurons receive both GABAergic and glycinergic inhibitory inputs from Venus-positive neurons.
3.8. Spike facilitation by selective activation of the insular cortex around the spike threshold
The findings obtained by voltage-clamp recordings from Sp5C neurons suggest that descending IC projections facilitate excitation of these neurons; however, the functional roles of IC projections in Sp5C neuron activity are unclear. Thus, we next examined the effects of selective activation of descending IC projections to Sp5C neurons under current-clamp conditions with various depolarizing current pulse injections in Venus-positive and CTB-positive neurons.
Depolarizing current pulses at intensities of 20, 40, 60, and 80 pA were applied to induce subthreshold and suprathreshold membrane responses in Venus-positive and CTB-positive Sp5C neurons (Fig. 8). In all cases in which the membrane potential was kept at the resting membrane potential (−60.4 ± 1.3 mV, n = 20), the selective activation of descending IC fibers (5 train pulses at an interstimulus interval of 200 ms) induced EPSPs and sometimes induced action potentials, as shown in Figures 8A and B. On the other hand, the selective activation of descending IC fibers almost consistently induced additional action potentials in the case of 20-pA current injection, which depolarized the membrane potential around the spike threshold in both Venus-positive and CTB-positive neurons (Figs. 8C and D). The numbers of spikes ranged from 2.9 ± 1.5 in control conditions to 3.9 ± 1.6 under light stimulation in Venus-positive neurons (n = 9, t(8) = 2.683, P = 0.0280, paired t test; Figure 8C) and from 3.5 ± 1.5 in control conditions to 5.3 ± 1.6 under light stimulation in CTB-positive neurons (n = 11, t(10) = 2.887, P = 0.0162, paired t test; Fig. 8D). In the case of repetitive firing at the high frequency induced by 40 to 80 pA, IC fiber activation by light application had little effect on the firing frequencies in both Venus-positive and CTB-positive neurons (Figs. 8C and D).
Figure 8.
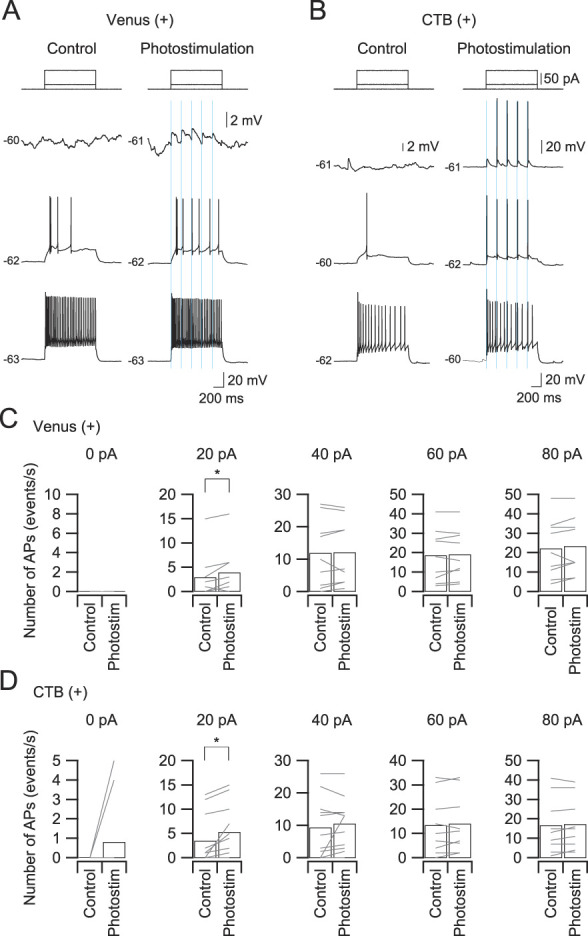
Effects of photostimulation-induced excitatory postsynaptic potentials (EPSPs) on firing in Venus-positive and CTB-positive Sp5C neurons. (A) Subthreshold and suprathreshold membrane responses of a Venus-positive neuron to depolarizing long-current pulse injection in the control condition and in combination with the activation of descending IC fibers by photostimulation (5 train pulses with an interstimulus interval of 200 ms). Note that both neurons show distinct photostimulation-evoked EPSPs at the threshold responses. (B) Relationship between the injected current intensity and the number of spikes in a CTB-positive neuron. In response to a 20-pA current injection, additional action potentials are induced in comparison with the case without photostimulation in both Venus-positive (A) and CTB-positive (B) neurons. (C and D) The numbers of action potentials in response to depolarizing currents (1 second) in the control condition and with photostimulation in Venus-positive neurons (C) and CTB-positive neurons (D). *P < 0.05, paired t test. AP, aminopyridine; CTB, cholera toxin subunit; IC, insular cortex; Sp5C, spinal subnucleus caudalis.
These results suggest that EPSPs evoked by IC fiber stimulation facilitate firing frequency around the spike threshold, and when a higher frequency of firing is induced by injecting a larger depolarizing current pulse injection, EPSPs do not facilitate or suppress the firing frequency.
3.9. Extracellular recordings from spinal subnucleus caudalis neurons
To examine whether IC projections change the spike firing of Sp5C neurons, we performed extracellular recording from Sp5C neurons (Figs. 9A and B) whose receptive field involved the whisker pad (Fig. 9C). This study focused on WDR neurons, which increase their spike firing rate in response to both non-noxious (brushing) and noxious stimuli (pinching with a clip) as shown in Figures 9D–G. The averaged spike firing responding to non-noxious and noxious stimulation of the whisker pad were compared between normal ACSF injection and the high-K+ ACSF injection into IC, the latter of which facilitates neuronal activities of the cortical neurons.48
Figure 9.
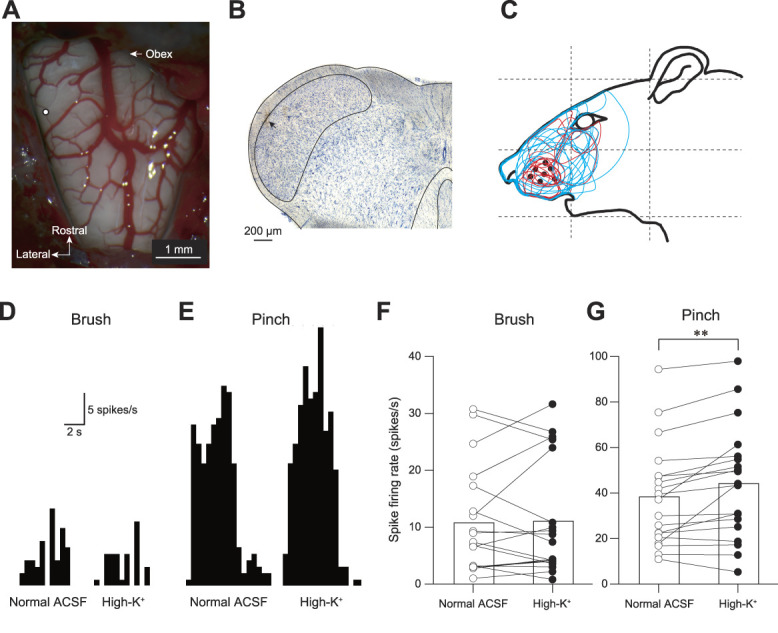
High-K+ ACSF stimulation of the right IC facilitates the spike firing rate of Sp5C neurons responding to noxious stimuli. (A) An example of recording site (open circle) overlaid on the dorsal view of the surface of the medulla oblongata. (B) A recording site (arrow) was identified in the Nissl section. (C) The receptive fields of the recorded WDR neurons. (D and E) Typical peristimulus time histograms of Sp5C neurons to non-noxious (Brush, D) and noxious stimulation (Pinch, E) of the facial skin. Note that high-K+ ACSF injection into the IC increased the spike firing frequency responding to pinching but not to brushing the face skin. (F and G) The comparison of the spike firing frequencies responding to brushing (F) and pinching (G) between normal ACSF and high-K+ ACSF injection. High-K+ ACSF injection into the IC increased the spike firing frequency responding to pinching but not to brushing the face skin (n = 19; P = 0.0050, paired t test). ACSF, artificial cerebrospinal fluid; IC, insular cortex; Sp5C, spinal subnucleus caudalis; WDR, wide-dynamic-range. ** P < 0.01.
WDR neurons were frequently found in laminae I and II (Fig. 9B). The evoked spike firing rates responding to the non-noxious stimulation were comparable between injection of normal ACSF and high-K+ ACSF injection into IC (10.7 ± 2.1 spikes/s in normal ACSF and 11.1 ± 2.3 spikes/s in high-K+ ACSF injection, n = 19; t(18) = 0.308, P = 0.7614, paired t test; Fig. 9F). By contrast, injection of high-K+ ACSF into IC significantly increased the evoked spike firing rate responding to noxious stimulation (38.3 ± 5.2 spikes/s in normal ACSF and 44.2 ± 5.7 spikes/s in high-K+ ACSF injection, n = 19; t(18) = 3.195, P = 0.0050, paired t test; Fig. 9G).
These results suggest that WDR neurons in Sp5C are facilitated by inputs from IC, especially in response to noxious but not non-noxious stimuli.
3.10. The head withdrawal threshold for mechanical and heat stimulation
To examine the functional role of IC projection to the Sp5C in pain modulation in the trigeminal nervous system, we conducted behavioral tests using chemogenetic technology. We injected CNO through the cannula implanted in the cisterna magna of the rats that received AAV-hSyn-hM3D(Gq)-mCherry injection into the bilateral IC (Fig. 10A). As a negative control, we injected vehicle (phosphate buffered saline) in the same way as CNO injection.
Figure 10.

Decreases in the head withdrawal threshold (HWT) for nociception induced by mechanical and heat stimulation. (A) A schematic diagram of the chemical genetics. The rats received AAV-hSyn-hM3D(Gq)-mCherry injection into the bilateral IC and inplantation of the cannula in the cisterna magna. Four weeks later, behavioral tests were performed with the injection of either PBS or CNO. (B) Diffusion of Evans blue dye injected into the cisterna magna through the cannula. Translucent (upper) and fluorescent images (bottom) are shown. Fluorescence was detectable in the superficial laminae of the Sp5C but was undetectable in the parabrachial nucleus and IC. (C) The time course of the HWT for mechanical stimulation of the whisker pad by von Frey filaments before and after either PBS (open circles, n = 7) or CNO application (closed circles, n = 7). The HWT at 2.5 hours and 3 hours after CNO application was significantly smaller than that after PBS application (2-way analysis of variance for repeated measures with the factors time and treatment followed by a post hoc Bonferroni test). (D) The arrangement of the animal and the heat stimulation apparatus. The plastic tube was used to fix the rat loosely, whose nose and whiskers were extruded. (E) The rate of temperature change of the skin induced by the heat stimulator. (F) The time course of the HWT for heat stimulation of the whisker pad before and after either PBS (open circles, n = 6) or CNO application (closed circles, n = 6). The HWT 3 hours after CNO application was significantly smaller than that after PBS application (2-way analysis of variance for repeated measures with the factors time and treatment followed by a post hoc Bonferroni test). *P < 0.05, ***P < 0.001. AAV, adeno-associated virus; CNO, clozapine N-oxide; IC, insular cortex; PBN, parabrachial nucleus; Sp5C, spinal subnucleus caudalis.
Before behavioral tests, we injected Evans blue dye through the cannula and examined coronal sections to estimate how far CNO spread in the brain (Fig. 10B). Evans blue dye was mostly detected in the dorsal Sp5C. However, almost no fluorescence was detected in the parabrachial nucleus, a part of the pons located rostral to the tip of the cannula, and the IC.
Mechanical stimulation was applied to the left and right whisker pads before and 0.5 to 24 hours after the application of CNO or the vehicle. Although CNO did not change the HWT 30 minutes after CNO injection, the HWT started to decrease 60 minutes after injection (Fig. 10C). The HWT reached the lowest level 3 hours after CNO injection and then gradually recovered to baseline. Statistically significant decreases in the HWT were observed 2.5 and 3 hours after CNO injection (n = 7) compared with that after the vehicle injection (n = 7; P < 0.001-0.018, 2-way ANOVA for repeated measures with the factors time and treatment followed by a post hoc Bonferroni test, Fig. 10C).
We also tested whether the HWT was decreased by heat stimulation of the whisker pads of rats. The distance between the thermal lens and the whisker pad was set at 5 mm (Fig. 10D). The rate of temperature change of the skin was shown in Figure 10E. The HWT to heat stimulation of the whisker pads significantly decreased 3 hours after CNO injection (n = 6; P < 0.05, 2-way ANOVA for repeated measures with the factors time and treatment followed by a post hoc Bonferroni test, Fig. 10F) and gradually returned to preinjection values.
These results suggest that excitatory inputs from the IC to the Sp5C decrease the threshold of nociception induced by mechanical and heat stimulation of the peripheral region innervated by the trigeminal nerve.
4. Discussion
This study shed light on the functional roles of descending projections from the IC to Sp5C laminae I/II excitatory and inhibitory neurons by optogenetics. We found a comparable amplitude of pEPSCs between excitatory and inhibitory Sp5C neurons, which were likely monosynaptically evoked. We also demonstrated a high failure rate of uIPSCs from inhibitory neurons to excitatory/inhibitory neurons in the Sp5C, which were sensitive to bicuculline and/or strychnine. Furthermore, we found that IC activation increased the spike firing rate responding to noxious but not non-noxious stimulation to the facial skin, and the HWT to mechanical and heat stimulation was decreased by activating descending projections from the IC to the Sp5C.
4.1. Anatomical evidence of descending projections from the insular cortex to the spinal subnucleus caudalis
The IC receives multiple sensory inputs, including gustation,67 visceral sensation,68 and nociception.28,53 Recent optical imaging studies have demonstrated that somatosensory information in oral structures such as the dental pulp and periodontal ligament also project to the boundary of the S2 and IC.22–24,30,40,41 In terms of the rostrocaudal axis, this oral structure-related region, the IOR, is located just caudal to the middle cerebral artery, which corresponds to the boundary of S1 and S2.40 Sato et al.50 demonstrated that layer V pyramidal neurons in this part project to the dorsal part of the Sp5C, where trigeminal nerves innervating the orofacial structures terminate.55 Some lamina I neurons send ascending axons to higher brain regions, including the PBN and thalamus,49 whereas most lamina II neurons are glutamatergic and GABA/glycinergic interneurons.45 Taking into account the finding that the Sp5C, especially laminae I/II, mediates nociceptive information from orofacial structures,20 these anatomical findings support the idea that the IOR modulates Sp5C neurons responding to noxious stimuli to orofacial structures.
4.2. Monosynaptic induction of EPSCs by channelrhodopsin-2 activation
Although the principal targets of descending projections from the IC to the Sp5C are laminae I/II, a possibility remains that ChR2 activation may induce action potentials in glutamatergic interneurons whose transmitter release would evoke EPSCs in the recorded Sp5C neurons. If this were the case, it is unclear which neurons, excitatory or inhibitory neurons, are more sensitive to descending projection from the IC. This polysynaptic induction of pEPSCs by ChR2 activation is feasible because few glutamatergic interneurons exist in laminae I/II of the Sp5C projecting to other Sp5C neurons.1,33,34
The application of TTX in combination with 4-AP is an appropriate approach to distinguish whether ChR2-evoked EPSCs are monosynaptic or polysynaptic. Tetrodotoxin diminishes glutamate release from presynaptic terminals of IC axons by blocking voltage-gated Na+ currents. The application of 4-AP, a blocker of K+ channels, makes it possible to induce greater depolarization by cation influx through ChR2, which causes Ca2+ influx and is sufficient to induce glutamate release. However, action potentials are not evoked because TTX blocks voltage-gated Na+ currents. This idea is supported by our finding that pIPSCs were never recovered by 4-AP application, suggesting that pIPSCs were mediated by a polysynaptic mechanism, i.e., ChR2 activation in presynaptic terminals of IC axons evokes action potentials in inhibitory Sp5C neurons, and the activation of inhibitory neurons induces IPSCs in postsynaptic neurons. Our findings of TTX-induced abolition and 4-AP–induced recovery of pEPSCs suggest that ChR2 activation monosynaptically activates postsynaptic recorded excitatory and inhibitory neurons.
4.3. Comparison of channelrhodopsin-2–evoked excitatory postsynaptic currents between excitatory and inhibitory spinal subnucleus caudalis neurons
This study demonstrated that the amplitudes of pEPSCs recorded from Sp5C excitatory and inhibitory neurons were comparable. We further found an insignificant difference in pEPSC amplitudes between neurons projecting to the PBN and unlabeled excitatory neurons. These results suggest that excitatory projection neurons, excitatory interneurons, and inhibitory interneurons receive comparable glutamatergic inputs from the IC. This premise is also supported by the finding that pIPSCs were rarely observed.
We must pay attention to the evidence that the pEPSC amplitude is dependent on the amount of ChR2 expression, which is strongly affected by the AAV injection condition. There is a possibility of a different amount of ChR2 expression in each slice preparation, which might cause superficial compatibility with ChR2-evoked EPSC amplitudes. To exclude this possibility, some ChR2-evoked EPSC recordings were performed by simultaneous recording from both excitatory and inhibitory neurons in the same slice preparation, and no significant difference was observed between them, supporting the finding that the amplitude of ChR2-evoked EPSCs is comparable between excitatory and inhibitory neurons in the Sp5C.
The present paired whole-cell patch-clamp recording study revealed that inhibitory transmission from Venus-positive neurons to excitatory neurons is mediated through GABAA and glycinergic receptors. The characteristic feature of these inhibitory connections was the high failure rate. The amplitude of uIPSCs calculated without failure indicates a rather large amplitude. Therefore, it is less likely that undetectable uIPSCs, under threshold responses, are part of the reason for the rather high failure rate. This high failure rate of uIPSCs likely contributes to the low possibility of pIPSCs in Sp5C neurons: only 8.8% of pIPSC observations in laminae I/II neurons.
The present finding of facilitatory effects of IC projections to the Sp5C neurons is in line with the observation of Chen et al.,8 which reported the facilitative effect of the anterior cingulate cortex on sensory neurons in the spinal cord (also see Ref. 70). This cortical facilitative role on secondary sensory neurons contradicts the case of S1 inputs onto Sp5C neurons, in which larger EPSCs are observed in inhibitory neurons than in excitatory neurons.7 Neurons in S1 respond to somatosensory stimuli, whereas the IC processes multiple pieces of information, including emotion, body homeostasis, and cognition, in addition to its contributions to perception.35,36 This difference in functions between the S1 and IC may be linked to conflicting effects on Sp5C neurons.
4.4. Functional roles of descending projections from the insular cortex to the spinal subnucleus caudalis
Our present in vitro optogenetic approach in combination with paired whole-cell patch-clamp recording reveals the possible functional role of the IC in information processing. The IC facilitates excitation of Sp5C neurons, some of which are projection neurons sending their glutamatergic axons to higher brain regions. This function may facilitate pain because it was previously reported that electrical stimulation of the IC through implanted electrodes in patients with drug-refractory temporal lobe epilepsy induces painful sensations.43
To test the hypothesis described above, optogenetics may be a potent approach. However, an optogenetic experiment requires us to implant an optical fiber into the Sp5C in the medulla oblongata, which is mobile depending on the posture. Although the optical fiber is fixed to the cranial bone, the tip of the optical fiber easily damages surrounding brain tissue. Therefore, we alternatively performed a chemogenetic experiment, another approach that enables us to regulate IC fiber activities in the Sp5C.
We observed significant decreases in the HWT to mechanical and heat stimulation with CNO injection to the cisterna magna, suggesting that IC→Sp5C projections play a facilitatory role in nociception through the trigeminal nerve. Indeed, IC activation by high-K+ ACSF application facilitated Sp5C neural activities responding to noxious but not non-noxious stimuli. However, there remains a possibility that CNO activates IC terminals in other nuclei of the medulla oblongata. However, we consider this possibility to be much less likely because (1) Evans blue dye injection showed the diffusion pattern of the dense staining in the obex and its caudal part and (2) a tracer study reported that the Sp5C most abundantly receives IC projections among the nuclei in the medulla oblongata.50
Other descending pathways from the IC target inhibitory neurons in the locus coeruleus and raphe magnus.28 They focus on the function of the anterior part of the agranular IC, which is the more anterior part of the IC structure evaluated in this study, and they do not overlap with each other. Therefore, it is possible to postulate that IC subregions may play different roles in pain processing.18 Another pathway of the descending suppression of nociception is mediated by serotonergic neurons arising from the dorsal raphe nucleus, which effectively suppress EPSCs of Sp5C neurons.58 Moreover, our pilot study suggests that the IC projects to the periaqueductal gray, a center of descending suppression of pain42; therefore, further studies of the effects of IC fiber activation focusing on these nuclei in the brainstem are needed to comprehend the integrated function of IC on nociception.
This study demonstrated the high failure rate of uIPSCs from GABAergic/glycinergic interneurons to excitatory neurons in laminae I/II. This finding corroborates previous findings in laminae II-V of the spinal dorsal horn.69 Functionally, inhibitory transmission contributes to the suppression of excitatory outputs to higher brain regions.15 It has been reported that GABAA receptor-mediated IPSCs show long-term potentiation in lamina I excitatory neurons through a presynaptic mechanism.15 We found that inhibitory synaptic transmission in laminae I and II of the Sp5C is mediated by both GABAA and glycinergic receptors; therefore, our finding implies a large capacity for LTP induction. This plastic change may be involved in the chronic pain induced by trigeminal nerve injury, in which the IC local circuit is changed.16
Conflict of interest statement
The authors have no conflicts of interest to declare.
Acknowledgments
VGAT-Venus transgenic rats were created by Drs. Y. Yanagawa, M. Hirabayashi, and Y. Kawaguchi at the National Institute for Physiological Sciences, Okazaki, Japan, using pCS2-Venus provided by Dr. A. Miyawaki. The authors thank Prof. K. Iwata for his technical instruction for extracellular recording and for critical reading of the manuscript. The authors also thank Dr. M. Tsuboi for his technical instruction for extracellular recording. This work was supported by KAKENHI 18K17019 to Y. Nakaya and 19H03821, 21K19616, and 22H03257 to M. Kobayashi from the MEXT, Japan, and by grants from the Sato and Uemura foundations.
Footnotes
Sponsorships or competing interests that may be relevant to content are disclosed at the end of this article.
Contributor Information
Yuka Nakaya, Email: nakaya.yuka@nihon-u.ac.jp.
Kiyofumi Yamamoto, Email: yamamoto.kiyofumi@nihon-u.ac.jp.
References
- [1].Alba-Delgado C, El Khoueiry C, Peirs C, Dallel R, Artola A, Antri M. Subpopulations of PKCγ interneurons within the medullary dorsal horn revealed by electrophysiologic and morphologic approach. PAIN 2015;156:1714–28. [DOI] [PubMed] [Google Scholar]
- [2].Amano N, Hu JW, Sessle BJ. Responses of neurons in feline trigeminal subnucleus caudalis (medullary dorsal horn) to cutaneous, intraoral, and muscle afferent stimuli. J Neurophysiol 1986;55:227–43. [DOI] [PubMed] [Google Scholar]
- [3].Bae YC, Kim JP, Choi BJ, Park KP, Choi MK, Moritani M, Yoshida A, Shigenaga Y. Synaptic organization of tooth pulp afferent terminals in the rat trigeminal sensory nuclei. J Comp Neurol 2003;463:13–24. [DOI] [PubMed] [Google Scholar]
- [4].Bae YC, Park KS, Bae JY, Paik SK, Ahn DK, Moritani M, Yoshida A, Shigenaga Y. GABA and glycine in synaptic microcircuits associated with physiologically characterized primary afferents of cat trigeminal principal nucleus. Exp Brain Res 2005;162:449–57. [DOI] [PubMed] [Google Scholar]
- [5].Basbaum AI, Glazer EJ, Oertel W. Immunoreactive glutamic acid decarboxylase in the trigeminal nucleus caudalis of the cat: a light- and electron-microscopic analysis. Somatosens Res 1986;4:77–94. [DOI] [PubMed] [Google Scholar]
- [6].Burstein R, Cliffer KD, Giesler GJ, Jr. Cells of origin of the spinohypothalamic tract in the rat. J Comp Neurol 1990;291:329–44. [DOI] [PubMed] [Google Scholar]
- [7].Castro A, Raver C, Li Y, Uddin O, Rubin D, Ji Y, Masri R, Keller A. Cortical regulation of nociception of the trigeminal nucleus caudalis. J Neurosci 2017;37:11431–40. [DOI] [PMC free article] [PubMed] [Google Scholar]
- [8].Chen T, Taniguchi W, Chen QY, Tozaki-Saitoh H, Song Q, Liu RH, Koga K, Matsuda T, Kaito-Sugimura Y, Wang J, Li ZH, Lu YC, Inoue K, Tsuda M, Li YQ, Nakatsuka T, Zhuo M. Top-down descending facilitation of spinal sensory excitatory transmission from the anterior cingulate cortex. Nat Commun 2018;9:1886. [DOI] [PMC free article] [PubMed] [Google Scholar]
- [9].Clements JR, Magnusson KR, Hautman J, Beitz AJ. Rat tooth pulp projections to spinal trigeminal subnucleus caudalis are glutamate-like immunoreactive. J Comp Neurol 1991;309:281–88. [DOI] [PubMed] [Google Scholar]
- [10].Cropper EC, Eisenman JS, Azmitia EC. 5-HT-Immunoreactive fibers in the trigeminal nuclear complex of the rat. Exp Brain Res 1984;55:515–22. [DOI] [PubMed] [Google Scholar]
- [11].Desbois C, Le Bars D, Villanueva L. Organization of cortical projections to the medullary subnucleus reticularis dorsalis: a retrograde and anterograde tracing study in the rat. J Comp Neurol 1999;410:178–96. [PubMed] [Google Scholar]
- [12].Dickenson AH, Hellon RF, Woolf CJ. Tooth pulp input to the spinal trigeminal nucleus: a comparison of inhibitions following segmental and raphe magnus stimulation. Brain Res 1981;214:73–87. [DOI] [PubMed] [Google Scholar]
- [13].Dunn RC, Jr, Tolbert DL. The corticotrigeminal projection in the cat. A study of the organization of cortical projections to the spinal trigeminal nucleus. Brain Res 1982;240:13–25. [DOI] [PubMed] [Google Scholar]
- [14].Felix-Ortiz AC, Beyeler A, Seo C, Leppla CA, Wildes CP, Tye KM. BLA to vHPC inputs modulate anxiety-related behaviors. Neuron 2013;79:658–64. [DOI] [PMC free article] [PubMed] [Google Scholar]
- [15].Fenselau H, Heinke B, Sandkuhler J. Heterosynaptic long-term potentiation at GABAergic synapses of spinal lamina I neurons. J Neurosci 2011;31:17383–91. [DOI] [PMC free article] [PubMed] [Google Scholar]
- [16].Fujita S, Yamamoto K, Kobayashi M. Trigeminal nerve transection-induced neuroplastic changes in the somatosensory and insular cortices in a rat ectopic pain model. eNeuro 2019;6:e0462–18. [DOI] [PMC free article] [PubMed] [Google Scholar]
- [17].Furuta T, Urbain N, Kaneko T, Deschenes M. Corticofugal control of vibrissa-sensitive neurons in the interpolaris nucleus of the trigeminal complex. J Neurosci 2010;30:1832–38. [DOI] [PMC free article] [PubMed] [Google Scholar]
- [18].Gehrlach DA, Weiand C, Gaitanos TN, Cho E, Klein AS, Hennrich AA, Conzelmann KK, Gogolla N. A whole-brain connectivity map of mouse insular cortex. elife 2020;9:e55585. [DOI] [PMC free article] [PubMed] [Google Scholar]
- [19].Gojyo F, Sugiyo S, Kuroda R, Kawabata A, Varathan V, Shigenaga Y, Takemura M. Effects of somatosensory cortical stimulation on expression of c-Fos in rat medullary dorsal horn in response to formalin-induced noxious stimulation. J Neurosci Res 2002;68:479–88. [DOI] [PubMed] [Google Scholar]
- [20].Hamba M, Onimaru H. Newborn rat brainstem preparation with the trigeminal nerve attached for pain study. Brain Res Brain Res Protoc 1998;3:7–13. [DOI] [PubMed] [Google Scholar]
- [21].Hirata H, Takeshita S, Hu JW, Bereiter DA. Cornea-responsive medullary dorsal horn neurons: modulation by local opioids and projections to thalamus and brain stem. J Neurophysiol 2000;84:1050–61. [DOI] [PubMed] [Google Scholar]
- [22].Horinuki E, O'Hashi K, Kobayashi M. In vivo Ca2+ imaging of the insular cortex during experimental tooth movement. J Dent Res 2021;100:276–82. [DOI] [PubMed] [Google Scholar]
- [23].Horinuki E, Shinoda M, Shimizu N, Koshikawa N, Kobayashi M. Orthodontic force facilitates cortical responses to periodontal stimulation. J Dent Res 2015;94:1158–66. [DOI] [PubMed] [Google Scholar]
- [24].Horinuki E, Yamamoto K, Shimizu N, Koshikawa N, Kobayashi M. Sequential changes in cortical excitation during orthodontic treatment. J Dent Res 2016;95:897–905. [DOI] [PubMed] [Google Scholar]
- [25].Iwata K, Imai T, Tsuboi Y, Tashiro A, Ogawa A, Morimoto T, Masuda Y, Tachibana Y, Hu J. Alteration of medullary dorsal horn neuronal activity following inferior alveolar nerve transection in rats. J Neurophysiol 2001;86:2868–77. [DOI] [PubMed] [Google Scholar]
- [26].Jacquin MF, Renehan WE, Mooney RD, Rhoades RW. Structure-function relationships in rat medullary and cervical dorsal horns. I. Trigeminal primary afferents. J Neurophysiol 1986;55:1153–86. [DOI] [PubMed] [Google Scholar]
- [27].Jacquin MF, Wiegand MR, Renehan WE. Structure-function relationships in rat brain stem subnucleus interpolaris. VIII. Cortical inputs. J Neurophysiol 1990;64:3–27. [DOI] [PubMed] [Google Scholar]
- [28].Jasmin L, Rabkin SD, Granato A, Boudah A, Ohara PT. Analgesia and hyperalgesia from GABA-mediated modulation of the cerebral cortex. Nature 2003;424:316–20. [DOI] [PubMed] [Google Scholar]
- [29].Kaneko K, Koyanagi Y, Oi Y, Kobayashi M. Propofol-induced spike firing suppression is more pronounced in pyramidal neurons than in fast-spiking neurons in the rat insular cortex. Neuroscience 2016;339:548–60. [DOI] [PubMed] [Google Scholar]
- [30].Kaneko M, Horinuki E, Shimizu N, Kobayashi M. Physiological profiles of cortical responses to mechanical stimulation of the tooth in the rat: an optical imaging study. Neuroscience 2017;358:170–80. [DOI] [PubMed] [Google Scholar]
- [31].Killackey HP, Koralek KA, Chiaia NL, Rhodes RW. Laminar and areal differences in the origin of the subcortical projection neurons of the rat somatosensory cortex. J Comp Neurol 1989;282:428–45. [DOI] [PubMed] [Google Scholar]
- [32].Kobayashi M, Nakaya Y. Anatomical aspects of corticotrigeminal projections to the medullary dorsal horn. J Oral Sci 2020;62:144–46. [DOI] [PubMed] [Google Scholar]
- [33].Li YQ, Li H, Kaneko T, Mizuno N. Substantia gelatinosa neurons in the medullary dorsal horn: an intracellular labeling study in the rat. J Comp Neurol 1999;411:399–412. [PubMed] [Google Scholar]
- [34].Li YQ, Li H, Yang K, Kaneko T, Mizuno N. Morphologic features and electrical membrane properties of projection neurons in the marginal layer of the medullary dorsal horn of the rat. J Comp Neurol 2000;424:24–36. [DOI] [PubMed] [Google Scholar]
- [35].Limebeer CL, Parker LA, Fletcher PJ. 5, 7-dihydroxytryptamine lesions of the dorsal and median raphe nuclei interfere with lithium-induced conditioned gaping, but not conditioned taste avoidance, in rats. Behav Neurosci 2004;118:1391–99. [DOI] [PubMed] [Google Scholar]
- [36].Maffei A, Haley M, Fontanini A. Neural processing of gustatory information in insular circuits. Curr Opin Neurobiol 2012;22:709–16. [DOI] [PMC free article] [PubMed] [Google Scholar]
- [37].Marfurt CF, Turner DF. The central projections of tooth pulp afferent neurons in the rat as determined by the transganglionic transport of horseradish peroxidase. J Comp Neurol 1984;223:535–47. [DOI] [PubMed] [Google Scholar]
- [38].Murayama S, Yamamoto K, Fujita S, Takei H, Inui T, Ogiso B, Kobayashi M. Extracellular glucose-dependent IPSC enhancement by leptin in fast-spiking to pyramidal neuron connections via JAK2-PI3K pathway in the rat insular cortex. Neuropharmacology 2019;149:133–48. [DOI] [PubMed] [Google Scholar]
- [39].Nagai T, Ibata K, Park ES, Kubota M, Mikoshiba K, Miyawaki A. A variant of yellow fluorescent protein with fast and efficient maturation for cell-biological applications. Nat Biotechnol 2002;20:87–90. [DOI] [PubMed] [Google Scholar]
- [40].Nakamura H, Kato R, Shirakawa T, Koshikawa N, Kobayashi M. Spatiotemporal profiles of dental pulp nociception in rat cerebral cortex: an optical imaging study. J Comp Neurol 2015;523:1162–74. [DOI] [PubMed] [Google Scholar]
- [41].Nakamura H, Shirakawa T, Koshikawa N, Kobayashi M. Distinct excitation to pulpal stimuli between somatosensory and insular cortices. J Dent Res 2016;95:180–87. [DOI] [PubMed] [Google Scholar]
- [42].Neafsey EJ, Hurley-Gius KM, Arvanitis D. The topographical organization of neurons in the rat medial frontal, insular and olfactory cortex projecting to the solitary nucleus, olfactory bulb, periaqueductal gray and superior colliculus. Brain Res 1986;377:261–70. [DOI] [PubMed] [Google Scholar]
- [43].Ostrowsky K, Magnin M, Ryvlin P, Isnard J, Guenot M, Mauguière F. Representation of pain and somatic sensation in the human insula: a study of responses to direct electrical cortical stimulation. Cereb Cortex 2002;12:376–85. [DOI] [PubMed] [Google Scholar]
- [44].Panetsos F, Sanchez-Jimenez A. Single unit oscillations in rat trigeminal nuclei and their control by the sensorimotor cortex. Neuroscience 2010;169:893–905. [DOI] [PubMed] [Google Scholar]
- [45].Pradier B, McCormick SJ, Tsuda AC, Chen RW, Atkinson AL, Westrick MR, Buckholtz CL, Kauer JA. Properties of neurons in the superficial laminae of trigeminal nucleus caudalis. Physiol Rep 2019;7:e14112. [DOI] [PMC free article] [PubMed] [Google Scholar]
- [46].Priestley JV, Somogyi P, Cuello AC. Immunocytochemical localization of substance P in the spinal trigeminal nucleus of the rat: a light and electron microscopic study. J Comp Neurol 1982;211:31–49. [DOI] [PubMed] [Google Scholar]
- [47].Qi J, Zhang H, Guo J, Yang L, Wang W, Chen T, Li H, Wu SX, Li YQ. Synaptic connections of the neurokinin 1 receptor-like immunoreactive neurons in the rat medullary dorsal horn. PLoS One 2011;6:e23275. [DOI] [PMC free article] [PubMed] [Google Scholar]
- [48].Rasmussen R, Nicholas E, Petersen NC, Dietz AG, Xu Q, Sun Q, Nedergaard M. Cortex-wide changes in extracellular potassium ions parallel brain state transitions in awake behaving mice. Cell Rep 2019;28:1182–94.e4. [DOI] [PMC free article] [PubMed] [Google Scholar]
- [49].Saito H, Katagiri A, Okada S, Mikuzuki L, Kubo A, Suzuki T, Ohara K, Lee J, Gionhaku N, Iinuma T, Bereiter DA, Iwata K. Ascending projections of nociceptive neurons from trigeminal subnucleus caudalis: a population approach. Exp Neurol 2017;293:124–36. [DOI] [PubMed] [Google Scholar]
- [50].Sato F, Akhter F, Haque T, Kato T, Takeda R, Nagase Y, Sessle BJ, Yoshida A. Projections from the insular cortex to pain-receptive trigeminal caudal subnucleus (medullary dorsal horn) and other lower brainstem areas in rats. Neuroscience 2013;233:9–27. [DOI] [PubMed] [Google Scholar]
- [51].Sedlacek M, Horak M, VyklickÝ L, Jr. Morphology and physiology of lamina I neurons of the caudal part of the trigeminal nucleus. Neuroscience 2007;147:325–33. [DOI] [PubMed] [Google Scholar]
- [52].Sessle BJ, Hu JW, Dubner R, Lucier GE. Functional properties of neurons in cat trigeminal subnucleus caudalis (medullary dorsal horn). II. Modulation of responses to noxious and nonnoxious stimuli by periaqueductal gray, nucleus raphe magnus, cerebral cortex, and afferent influences, and effect of naloxone. J Neurophysiol 1981;45:193–207. [DOI] [PubMed] [Google Scholar]
- [53].Shigenaga Y, Matano S, Kusuyama M, Sakai A. Cortical neurons responding to electrical stimulations of the rat's incisor pulp. Brain Res 1974;67:153–56. [DOI] [PubMed] [Google Scholar]
- [54].Smith JB, Watson GDR, Alloway KD, Schwarz C, Chakrabarti S. Corticofugal projection patterns of whisker sensorimotor cortex to the sensory trigeminal nuclei. Front Neural Circuits 2015;9:53. [DOI] [PMC free article] [PubMed] [Google Scholar]
- [55].Takemura M, Sugiyo S, Moritani M, Kobayashi M, Yonehara N. Mechanisms of orofacial pain control in the central nervous system. Arch Histol Cytol 2006;69:79–100. [DOI] [PubMed] [Google Scholar]
- [56].Tashiro T, Matsuyama T, Higo S. Distribution of cells of origin of the corticotrigeminal projections to the nucleus caudalis of the spinal trigeminal complex in the cat. A horseradish peroxidase (HRP) study. Exp Neurol 1983;80:178–85. [DOI] [PubMed] [Google Scholar]
- [57].Ting JT, Lee BR, Chong P, Soler-Llavina G, Cobbs C, Koch C, Zeng H, Lein E. Preparation of acute brain slices using an optimized N-methyl-d-glucamine protective recovery method. J Vis Exp 2018;132:e53825. [DOI] [PMC free article] [PubMed] [Google Scholar]
- [58].Travagli RA, Williams JT. Endogenous monoamines inhibit glutamate transmission in the spinal trigeminal nucleus of the Guinea-pig. J Physiol 1996;491(pt 1):177–85. [DOI] [PMC free article] [PubMed] [Google Scholar]
- [59].Tsuruoka M, Matsutani K, Maeda M, Inoue T. Coeruleotrigeminal inhibition of nociceptive processing in the rat trigeminal subnucleus caudalis. Brain Res 2003;993:146–53. [DOI] [PubMed] [Google Scholar]
- [60].Uematsu M, Hirai Y, Karube F, Ebihara S, Kato M, Abe K, Obata K, Yoshida S, Hirabayashi M, Yanagawa Y, Kawaguchi Y. Quantitative chemical composition of cortical GABAergic neurons revealed in transgenic venus-expressing rats. Cereb Cortex 2008;18:315–30. [DOI] [PubMed] [Google Scholar]
- [61].Usui M, Kaneko K, Oi Y, Kobayashi M. Orexin facilitates GABAergic IPSCs via postsynaptic OX1 receptors coupling to the intracellular PKC signalling cascade in the rat cerebral cortex. Neuropharmacology 2019;149:97–112. [DOI] [PubMed] [Google Scholar]
- [62].Wang D, Li YQ, Li JL, Kaneko T, Nomura S, Mizuno N. gamma-aminobutyric acid- and glycine-immunoreactive neurons postsynaptic to substance P-immunoreactive axon terminals in the superficial layers of the rat medullary dorsal horn. Neurosci Lett 2000;288:187–90. [DOI] [PubMed] [Google Scholar]
- [63].Wang D, Wu JH, Dong YX, Li YQ. Synaptic connections between trigemino-parabrachial projection neurons and γ-aminobutyric acid- and glycine-immunoreactive terminals in the rat. Brain Res 2001;921:133–37. [DOI] [PubMed] [Google Scholar]
- [64].Wise SP, Jones EG. Cells of origin and terminal distribution of descending projections of the rat somatic sensory cortex. J Comp Neurol 1977;175:129–57. [DOI] [PubMed] [Google Scholar]
- [65].Wise SP, Murray EA, Coulter JD. Somatotopic organization of corticospinal and corticotrigeminal neurons in the rat. Neuroscience 1979;4:65–78. [DOI] [PubMed] [Google Scholar]
- [66].Yamamoto K, Kobayashi M. Opposite roles in short-term plasticity for N-Type and P/Q-Type voltage-dependent calcium channels in GABAergic neuronal connections in the rat cerebral cortex. J Neurosci 2018;38:9814–28. [DOI] [PMC free article] [PubMed] [Google Scholar]
- [67].Yamamoto T, Matsuo R, Kawamura Y. Localization of cortical gustatory area in rats and its role in taste discrimination. J Neurophysiol 1980;44:440–55. [DOI] [PubMed] [Google Scholar]
- [68].Yasui Y, Breder CD, Saper CB, Cechetto DF. Autonomic responses and efferent pathways from the insular cortex in the rat. J Comp Neurol 1991;303:355–74. [DOI] [PubMed] [Google Scholar]
- [69].Zhang W, Schneider SP. Short-term modulation at synapses between neurons in laminae II-V of the rodent spinal dorsal horn. J Neurophysiol 2011;105:2920–30. [DOI] [PMC free article] [PubMed] [Google Scholar]
- [70].Zhuo M. Cortical excitation and chronic pain. Trends Neurosci 2008;31:199–207. [DOI] [PubMed] [Google Scholar]