Abstract
The Celera Discovery System™ (CDS) is a web-accessible research workbench for mining genomic and related biological information. Users have access to the human and mouse genome sequences with annotation presented in summary form in BioMolecule Reports for genes, transcripts and proteins. Over 40 additional databases are available, including sequence, mapping, mutation, genetic variation, mRNA expression, protein structure, motif and classification data. Data are accessible by browsing reports, through a variety of interactive graphical viewers, and by advanced query capability provided by the LION SRS™ search engine. A growing number of sequence analysis tools are available, including sequence similarity, pattern searching, multiple sequence alignment and Hidden Markov Model search. A user workspace keeps track of queries and analyses. CDS is widely used by the academic research community and requires a subscription for access. The system and academic pricing information are available at http://cds.celera.com.
GENOME NAVIGATION IN CDS
CDS offers a number of ways to retrieve information about a genome. These include query and browse functions at the level of chromosomes, genes, transcripts, proteins and SNPs. All of the genome annotations are cross-referenced in CDS and are accessible from a number of different routes. At the highest level, users can query or browse the genome itself, retrieving genomic sequences, feature maps or lists of genes from any chromosomal region. At a more detailed level, users can query any biological molecule (gene, transcript, protein) by any of its characteristics, retrieving gene lists or BioMolecule Reports.
Genome Assembly
The Genome Assembly query function in CDS allows users to query relationships among chromosomes and scaffolds. The user may select an entire chromosome, optionally select a sub-region, and filter scaffolds by size. The query returns a Chromosome Map Report that lists scaffolds ordered by location on the chromosome. The GA, location, orientation and length of each scaffold is returned in the scaffold list. The GA links to a Scaffold Report that lists 500 000-base regions of the scaffold. The user can retrieve any one of these in turn and launch a BlastN or BlastX query against a variety of databases. The user also has the option of exporting a text file of the sequence, or generating a graphical map of the region or a list of genes contained within the region (see below).
Searching Genome Maps
The CDS Genome Map Query page offers users the ability to create graphical maps of genome features using the MapView applet or create lists of genes within selected boundaries. The parameters from which a user may select include an entire chromosome, or any region defined by cytogenetic bands, map positions using Celera’s coordinate system, STS markers or public BAC clones. In addition, users may select a region around a gene, defined by its Celera gene, transcript or protein unique identifier, gene symbol, or RefSeq [National Center for Biotechnology Information (NCBI); www.ncbi.nlm.nih.gov/LocusLink/refseq.html] identifier. In each of the cases mentioned, the user can retrieve a map or list of genes for just the region identified or a region up to 10 million bases in length flanking either side.
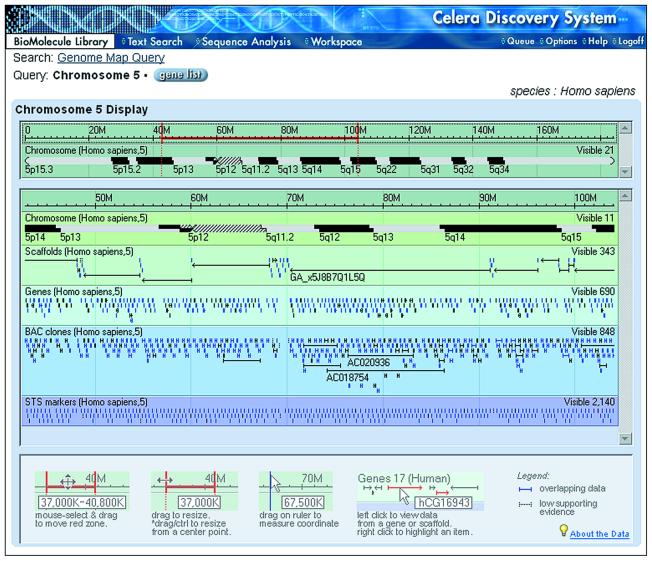
If after selecting the desired parameters, the user chooses the Map function, the MapView applet is launched. MapView is an interactive viewer that displays a variety of features and allows zooming and panning across a chromosome (Fig. 1).
Figure 1.
MapView. The MapView applet is divided into two main panels. The upper panel contains a cytogenetic band representation of the entire selected region, a coordinate scale and a pan/zoom bar (red). The lower panel contains a number of panes that represent features contained in the region defined by the pan/zoom bar: cytogenetic bands, scaffolds from Celera’s assembly, identified genes, public BAC clones mapped to Celera’s assembly and STS markers. The number of visible objects in each pane is reported. Holding the mouse cursor over any object reveals its identifier. Clicking on a gene or scaffold takes the user to a gene BioMolecule Report or Scaffold Report, respectively.
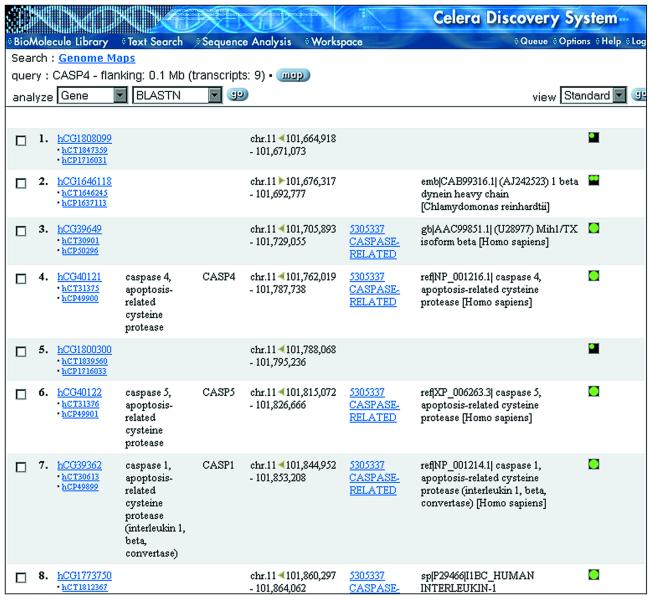
Alternatively, if after selecting the desired parameters, the user chooses the Gene List function, a Gene List Report is returned (Fig. 2). This report displays all of the appropriate BioMolecule identifiers (gene, transcript, protein), an assigned gene name, gene symbol, chromosome location and orientation, Panther protein family/subfamily classification, definition from best match to a non-redundant amino acid database (NRAA), and the transcript class. The transcript class is a symbol that defines the amount of evidence in support of the existence of the gene.
Figure 2.
Gene List Report. Gene lists can be generated from many places within CDS and display identifiers that link to BioMolecule Reports and other information important to understanding the potential function of the gene product. The protein family assignment links to the Panther Function-Family Browser (Fig. 4). There is an option to view an expanded version of the Gene List, which contains gene aliases and RefSeq and NRAA identifiers with links to GenBank reports.
BioMolecule Reports
CDS BioMolecule reports are the core information summaries for genes, transcripts and proteins. BioMolecule Reports can be reached from Gene Lists, directly from the MapView applet, and from SNP Reports (see below). The top of each report lists all of the appropriate Celera identifiers for the related molecules, Panther protein family/subfamily classification (see below), the organism, gene name and symbol, any aliases, and the chromosomal location. If there are multiple transcripts for the gene, all identifiers are displayed. The report for a gene contains three sections, referred to as ‘tabs’, labeled Chromosome, mRNA and Protein. Each tab contains the sequence of the appropriate molecule and the option to launch analysis tools appropriate to that type of molecule. Each tab has a link to the revision history for the sequence and annotation as described above.
Chromosome tab. The main section of this tab is the MapView applet with a zoomed-in view of the gene of interest. The tab also contains the sequence of the gene, including all exons and introns and up to 10 000 bases upstream and downstream.
mRNA tab. The main section of this tab is a modified version of the MapView applet that shows the exon structure of the transcript. The confidence in the prediction is represented by the Transcript Class, a measure of the amount of supporting evidence for the transcript structure. These lines of evidence are listed on the tab. Those sequences from Celera and public sources that have the highest sequence similarity to the transcript are listed with the best NRAA match emphasized on the tab. Other sources of matches include Celera’s Human Gene Index (clusters of ESTs), rodent ESTs and best protein matches from human and model organisms. Links to the BLAST alignments and the original records for the matches are available. In addition, probable paralogs based upon Celera’s LEK clustering method (3) are listed.
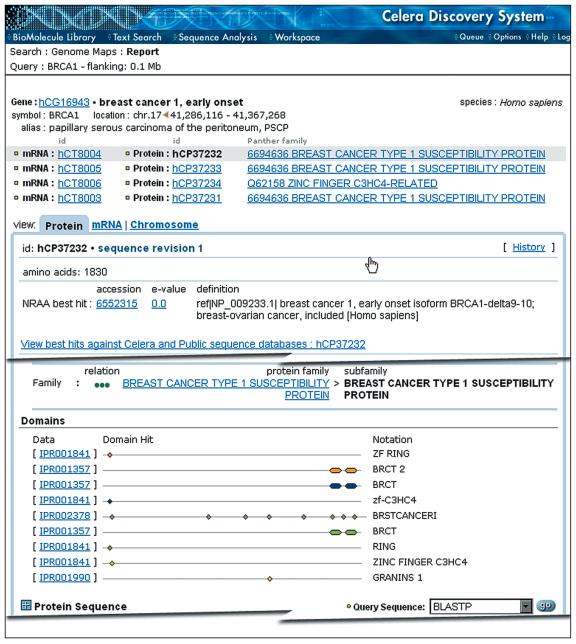
Protein tab. This tab (Fig. 3) provides the same access to best sequence matches as the mRNA tab. The Gene Ontology (GO) classifications (4) for cellular process, molecular function and cellular location are presented with links to other proteins in the same categories. In addition, the Panther protein family, subfamily and Panther ontology categories are listed with a link to the Panther Function-Family Browser (see below).
Figure 3.
Representative features from a Protein BioMolecule Report. The report for the BRCA1 gene shows that four alternative splice forms have been identified leading to four protein BioMolecule Reports (hCP37232 shown). The GO classification is not shown for brevity.
PROTEIN CLASSIFICATION
CDS currently incorporates two methods for classifying proteins. The first uses the full GO to organize proteins by biological process, molecular function and cellular location. The second method is Celera’s proprietary Panther system, which is based on a library of over 40 000 Hidden Markov Models (HMMs) that have been assigned by biologist curators to the Panther biological process and molecular function ontologies. The Panther ontology is a simplified version of the full set of GO classification terms, and Celera is working with the GO Consortium to map this ontology to GO.
The primary distinction between the Panther and GO assignments in CDS is the methodology used for assignment. There are two types of GO assignment: computational and expert-curated. The computational approach uses BLAST with a fixed E-value cut-off to score each predicted protein against a database of sequences that have already been assigned to GO by the Gene Ontology Consortium (http://www.geneontology.org). The set of computational GO assignments for the predicted protein is then defined as the union of all assignments for all GO proteins with a BLAST score above the cut-off. The goal is to provide the user with a list of all possible GO assignments for a given protein (based on sequence similarity), and the approach is therefore much more prone to false positive predictions than false negative. Celera is now in the process of subjecting these computational GO assignments to expert review.
Panther, on the other hand, was designed to avoid the problem of false positive predictions in homology-based function prediction. First, a training set of sequences is clustered into families of related sequences. These families define the set of possible functional inferences for a new family member. The families are divided by expert curators into subfamilies whose members generally share much closer relationships and can all be assigned the same biologically meaningful name, molecular function and biological process(es). Statistical models (HMMs) are built for both families and subfamilies, so that function can be inferred differently for the case of a family-level relationship versus a subfamily-level relationship. For example, a new protein found to have a subfamily-level relationship to cathepsin K can be inferred to be involved in the process skeletal development, while a new protein found to have a more distant family-level relationship to the cathepsin-like cysteine protease family could only be inferred to have the molecular function protease.
The Panther Protein Library (PPL 3.0) contains over 2200 alignments of related protein sequences (protein families), containing a total of 188 000 non-redundant sequences from a variety of organisms. These families are further subdivided into nearly 40 000 subfamilies of closely related protein sequences. For both families and subfamilies, HMMs are built that describe the shared characteristics (‘signature’) of the member sequences. The Panther HMMs are used to score all protein sequences predicted in a given genome, and therefore give a probabilistic prediction of the protein’s name, molecular function(s) and biological role(s). The Panther ontology covers the higher-level categories of the full GO, but it is designed for facilitating navigation and whole genome-level views rather than for detailed annotation vocabulary. Each ontology (molecular function and biological process) contains about 250 categories total in three levels (in contrast, the full GO molecular function hierarchy is up to 12 levels deep and contains nearly 4000 categories).
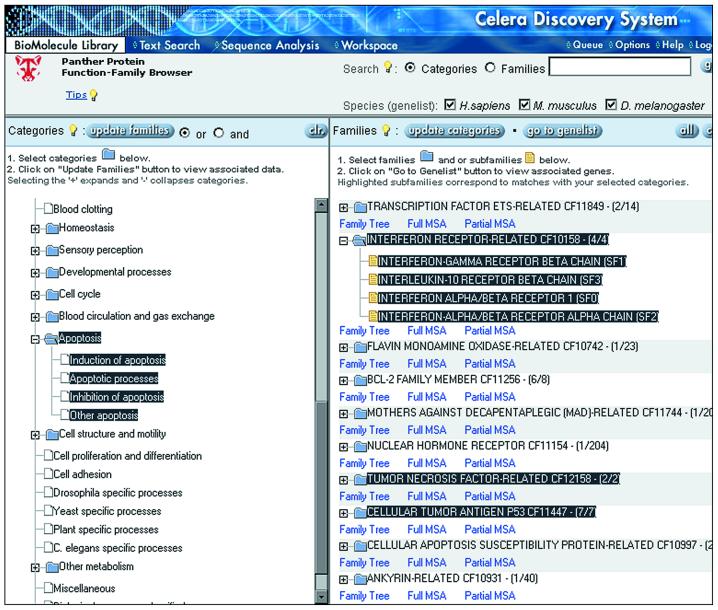
There are several routes for accessing Panther classifications in CDS. Panther and GO classifications are available on each protein BioMolecule Report (Fig. 3). In addition, the Panther classifications can be browsed directly by using the CDS Protein Function-Family Browser (Panther Browser; Fig. 4). Proteins can be browsed either by molecular function or by biological process, or searched by family or subfamily. The Panther Browser supports creating lists of proteins based on (i) evolutionary relationships at the family level (e.g. all cysteine proteases) or subfamily level (e.g. cathepsin K), and (ii) functional relationships as defined by shared molecular function(s) (e.g. all proteins predicted to be proteases) or biological processes (e.g. all proteins predicted to be involved in skeletal development). Boolean and/or operations are also supported to construct lists of, e.g. all proteases involved in skeletal development. These gene lists contain Panther annotations, are linked to BioMolecule Reports, and can be exported. The Panther Browser view also has links to phylogenetic trees and multiple sequence alignments for each family and subfamily.
Figure 4.
Panther Protein Function-Family Browser for exploring the relationship between protein function and sequence. The Panther ontology can be browsed or searched in the left panel. Protein families and/or subfamilies assigned to the selected categories are displayed in the right panel. Families and subfamilies can be also be searched separately and displayed in the right panel. Gene lists can be created by retrieving all proteins assigned to selected families and subfamilies. For each family, links are provided to a distance tree, sequence-level annotation and multiple sequence alignment.
The Web Tree Viewer allows users to explore protein family/subfamily relationships in the library of ‘distance trees’. The views include both Celera-assigned subfamily annotations and SWISS-PROT and GenBank-assigned sequence-level annotation. The library of multiple sequence alignments highlights positions that are conserved across an entire family as well as subfamily-specific positions, revealing amino acid-level determinants of function and specificity.
The Panther family/subfamily classifications are also used in CDS to enhance BLAST search results. The results are organized by family and subfamily, listing the curated name and functional assignments. This can drastically reduce the amount of data for an end user to sift through (only one sequence per subfamily is shown since they all have the same function) as well as provide additional annotation information from the Panther classification.
COMPARATIVE GENOMICS
Comparative analysis of genomes can provide major benefits to the study of genomic organization and biological function. Conservation of features, be they genes, genomic organization or even stretches of sequence, can provide clues to previously unidentified features in one of the genomes being examined. They also provide a way to correlate experimental information determined for one species with that of another. Since a variety of features have been mapped to the assembled human and mouse genomes, the opportunity exists to exploit the relationships of these features between the two genomes. An analysis of conserved regulatory regions is available in CDS. Analyses of synteny and orthologous proteins will be available in the near future (see below).
Conserved regulatory regions
The identification of transcription factor binding sites (TFBS) is hampered by the fact that the sites are very short signals having many false positive occurrences in a genome. Leveraging sequence conservation between human and mouse can provide higher confidence identification of TFBS associated with gene regulatory regions. A set of genomic segments conserved between human and mouse (hmCS, or human/mouse conserved segment) were computed from the assembled human and mouse genomes and used to filter a set of vertebrate TRANSFAC (5) binding sites on the human genome assembly. These data were mapped to Celera genes to provide locations (upstream, intron, downstream) relative to the genes. Binding sites contained in coding regions were removed.
The results of this analysis are available in CDS and can be queried using a number of different parameters, including gene and protein name, chromosome, BAC and STS coordinates, human and mouse conserved region unique identifier (hmCS), TFBS name, TRANSFAC position weight matrix, and score. A variety of data views are available to show a summary of results or a more detailed report. A file of hmCS data is available for export in FASTA format and as a BLAST-accessible data set within CDS. The mRNA tab in BioMolecule Reports have a link to a gene regulatory report that provides a list of all TFBS and hmCS data for a given transcript. Lastly, the MapView applet in the mRNA tab enables users to view hmCS and TFBS data in relation to the transcript, providing a simple way to visualize the spatial organization of these features.
FUTURE DIRECTIONS
The CDS has been designed to provide access to a wealth of experimental and computationally derived information for completed genomes. Keeping such a system current with all of the new data being generated in the quest to understand biological processes is a task that will continue well into the future. Enhancements are constantly being made to the CDS infrastructure. These include the addition of new databases and analysis tools as well as improvements to query and visualization tools and especially expert curation of datasets.
Celera will also be making significant enhancements to CDS to support mRNA expression research. Users can currently query an extensive EST collection and cDNA library information to retrieve a view of transcript expression patterns. This is being enhanced by the mapping of SAGE and MPSS™ data for additional evidence for gene structures as well as to provide a Body Atlas of tissue expression data. Public identifiers from databases such as RefSeq and UniGene (NCBI, www.ncbi.nlm.nih.gov/UniGene) are being mapped to Celera’s transcripts to provide a linkage point for users conducting their own microarray experiments to correlate their results with the annotation available in CDS. Application Programming Interfaces (APIs) are being enhanced to allow commercial expression visualization tools to inter-operate with CDS.
Several methods were employed to identify syntenic genomic regions in the human and mouse genomes, including direct comparison of the DNA sequences and comparison of the predicted proteins from each organism. A set of conserved locations between both genomes, called Syntenic Anchors, was generated by comparing the sequences using BLASTN and identifying hits that are bi-directionally unique between human and mouse.
The density of Syntenic Anchors does not appear to be significantly affected by gene density, making the syntenic anchors an important complement to the orthologous protein pairs. Orthologous protein pairs were determined by either the suffix-tree comparison method, MUMmer (7), or alternatively by matches which have mutual best tBlastX scores.
The results of these analyses will be available in CDS for searching using a variety of parameters. Gene list views will have the ability to display orthologs in another species. BioMolecule Reports will have links to the appropriate orthology or syntenic information for protein and genomic data. MapView is being enhanced to enable the user to load two genomes and view genomic scaffolds, syntenic anchors, genes and orthologous proteins.
CDS is one of several integrated ways that Celera delivers genomic and related data. For example, there is a growing set of APIs which allow access to all of the fields represented on BioMolecule Reports. There is also a Java-client tool, the Genome Browser, which works interactively with CDS. Through applications such as these, Celera is constantly working to improve integration of data generated by users with that delivered by Celera.
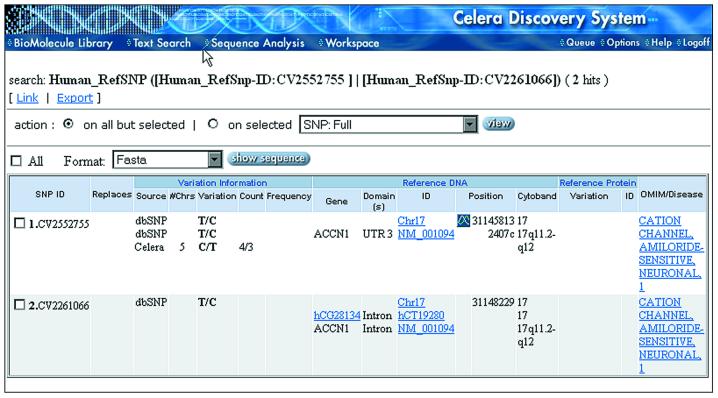
Figure 5.
SNP report. The Report displays information such as source (Celera, dbSNP, HGMD), the number of chromosomes sampled, the nucleotide variation, the count and frequency, gene name, structural position, chromosomal location (number, cytogenetic band, scaffold position), links to Celera and RefSeq DNA sequences with location within that sequence, and links to OMIM for disease information associated with the gene. If the SNP is in a coding region, the codon, its position and affected amino acid are displayed. For Celera SNPs, the raw electropherogram data are also available.
Acknowledgments
ACKNOWLEDGEMENTS
The authors wish to acknowledge the work of a large number of people in the Product Development, Software Engineering, Scientific Annotation, Protein Informatics and Informatics Research Teams at Celera for their contributions to the development of CDS and its content. The authors also wish to thank Sam Broder, Joyce Fuhrmann, Sam Levy, Jason Mollé and Karin Remington for helpful comments on this manuscript.
REFERENCES
- 1.Velculescu V.E., Zhang,L., Vogelstein,B. and Kinzler,K.W. (1995), Serial analysis of gene expression. Science, 270, 484–487. [DOI] [PubMed] [Google Scholar]
- 2.Brenner S., Johnson,M., Bridgham,J., Golda,G., Lloyd,D.H., Johnson,D., Luo,S., McCurdy,S., Foy,M., Ewan,M. et. al. (2000) Gene expression analysis by massively parallel signature sequencing (MPSS) on microbead arrays. Nat. Biotechnol., 18, 630–634. [DOI] [PubMed] [Google Scholar]
- 3.Venter J.C., Adams,M.D., Myers,E.W., Li,P.W., Mural,R.J., Sutton,G.G., Smith,H.O., Yandell,M., Evans,C.A., Holt,R.A. et. al. (2001) The sequence of the human genome. Science, 291, 1304–1351. [DOI] [PubMed] [Google Scholar]
- 4.Ashburner M., Ball,C.A., Blake,J.A., Botstein,D., Butler,H., Cherry,J.M., Davis,A.P., Dolinski,K., Dwight,S.S., Eppig,J.T. et. al. (2000) Gene Ontology: tool for the unification of biology. Nature Genet., 25, 25–29. [DOI] [PMC free article] [PubMed] [Google Scholar]
- 5.Wingender E., Chen,X., Fricke,E., Geffers,R., Hehl,R., Liebich,I., Krull,M., Matys,V., Michael,H., Ohnhäuser,R. et. al. (2001) The TRANSFAC system on gene expression regulation. Nucleic Acids Res., 29, 281–283. [DOI] [PMC free article] [PubMed] [Google Scholar]
- 6.Cooper D.N., Ball,E.V. and Krawczak,M. (1998) The human gene mutation database. Nucleic Acids Res., 26, 285–287. [DOI] [PMC free article] [PubMed] [Google Scholar]
- 7.Delcher A.L., Kasif,S., Fleischmann,R.D., Peterson,J., White,O. and Salzberg,S. (1999) Alignment of whole genomes. Nucleic Acids Res., 27, 2369–2376. [DOI] [PMC free article] [PubMed] [Google Scholar]


