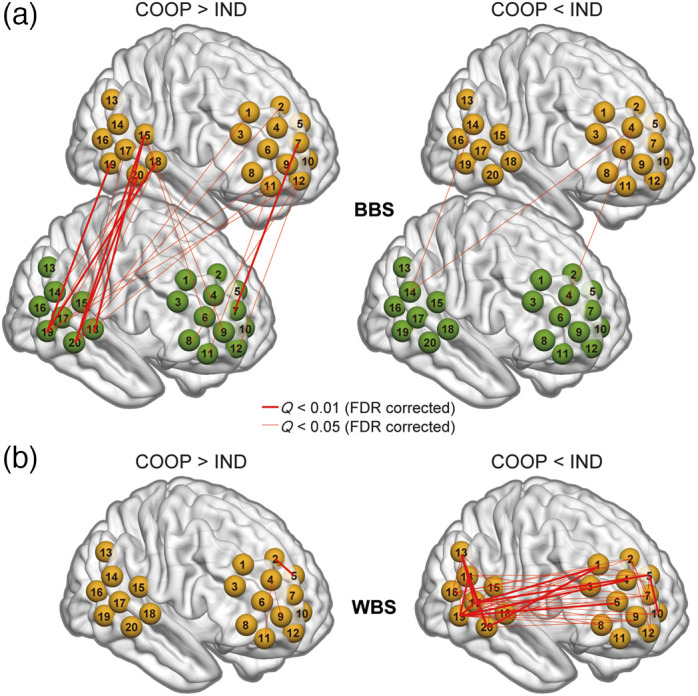
Fig. 4.

Top significant (, FDR corrected) (a) BBS and (b) WBS obtained from oxy-Hb data. Left panel: COOP > IND; Right panel: COOP < IND. The width of the lines reflects the value (the smaller the value is, the thicker the line is). Brain images were created using BrainNetViewer.26
