

Abstract
INTRODUCTION:
There is a great need for fully-automated plasma assays that can measure β-amyloid (Aβ) pathology and predict future Alzheimer’s disease (AD) dementia.
METHODS:
Two cohorts (n=920) were examined: Panel A+ (n=32 cognitively unimpaired [CU], n=106 mild cognitively impairment [MCI] and n=89 AD) and BioFINDER-1 (n=461 CU, n=232 MCI). Plasma Aβ42/Aβ40, P-tau181, two P-tau217 variants, ApoE4 protein, neurofilament light and GFAP were measured using Elecsys® prototype immunoassays.
RESULTS:
The best biomarker for discriminating Aβ-positive vs Aβ-negative participants was Aβ42/Aβ40 (AUCs 0.83–0.87). Combining Aβ42/Aβ40, P-tau181 and ApoE4 improved the AUCs significantly (0.90–0.93; p<0.01). Adding additional biomarkers had marginal effects (ΔAUC≤0.01). In BioFINDER, P-tau181, P-tau217 and ApoE4 predicted AD dementia within 6 years in CU (AUC 0.88) and P-tau181, P-tau217, and Aβ42/Aβ40 in MCI (AUC 0.87).
DISCUSSION:
The high accuracies for Aβ pathology and future AD dementia using fully-automated instruments are promising for implementing plasma biomarkers in clinical trials and clinical routine.
INTRODUCTION
Even though there has been great progress in the development of accurate blood tests for Alzheimer’s disease (AD), they have not yet been widely implemented in clinical practice.[1] Validation of blood biomarkers mainly focuses on clinical AD diagnosis[2–5] and detecting β-amyloid (Aβ) pathology in the brain.[6–12] The accumulation of Aβ is considered the primary pathology of AD.[13] The removal or reduction of cerebral Aβ has therefore been the aim of many clinical trials[14, 15] and the first anti-Aβ drug (aducanumab) was approved by the Food and Drug Administration in 2021.[16] Having tests that accurately estimate the presence of abnormal Aβ accumulation (“Aβ positivity”) is therefore crucial for identifying suitable persons to enroll in drug trials, for ensuring an accurate AD diagnosis[17–19] and before starting anti-Aβ treatment.[20] Implementing blood tests for Aβ pathology would have great benefits since today’s methods for identifying Aβ are either invasive, costly or only available in specialized centers in some parts of the world (these include Aβ positron emission tomography [PET] and cerebrospinal fluid analysis [CSF]). Blood tests for Aβ may become even more important if ongoing prevention trials in cognitively unimpaired (CU) persons are successful.[21] In that case, Aβ positivity would have to be identified before cognitive impairment starts and it would also be important to predict whom will progress to AD dementia (since those that remain stable for many years probably will not benefit the most from the drug). In such screenings of CU individuals, the test would have to be as easily accessible, cost effective, and minimally-invasive as possible.
Promising plasma biomarkers that specifically capture key AD processes are the Aβ42/Aβ40 ratio,[7–12, 22] tau phosphorylated at threonine 181 (P-tau181)[3, 5, 23–25] and P-tau217.[2, 4, 22] Other promising plasma biomarkers that are altered in AD, but not specific to AD pathology, include glial fibrillary acidic protein (GFAP; a marker of glial activation in response to e.g. Aβ accumulation)[6, 7, 26] and neurofilament light (NfL; a marker of axonal injury).[27, 28] To improve the accuracy, the biomarkers have often been combined with APOE genotyping,[8–10, 29, 30] where the presence of an ε4 allele (encoding the E4 isoform of the apolipoprotein E protein) is associated with higher probability of Aβ positivity.[31] One important obstacle for implementing these biomarkers in clinical practice is that most studies have used research-grade assays suitable for single batch analysis of all plasma samples (to reduce variability in test results between batches) or required intensive manual labor. A crucial step forward towards clinical implementation would thus be to establish the biomarkers on automated instruments that can run samples whenever they arrive at the laboratory with minimal manual steps and stable results over time (that is, a fully automated approach). This would allow for setting up the tests in ordinary clinical chemistry laboratories world-wide. Such instruments have been implemented for CSF analyses[32–34] but are not yet readily available for plasma AD biomarkers, although pilot versions have been published (such as the Elecsys® plasma prototype assays for Aβ42 and Aβ40[9]).
The primary aim of this study was to examine the clinical performance and diagnostic utility of a novel fully automated plasma biomarker panel for identifying Aβ positivity. The secondary aim was to examine its ability to predict development of future AD dementia. The panel included plasma Aβ42/Aβ40, P-tau181, two variants of P-tau217, NfL, GFAP and the APOE ε4-encoded E4 isoform of ApoE (ApoE4; i.e., quantification of ApoE4 protein in plasma, not APOE genotyping). This was examined in cognitively unimpaired and cognitively impaired participants using two independent cohorts (N=920). In addition, the association between the plasma biomarkers and corresponding CSF biomarkers was examined. For plasma ApoE4, a comparison with the APOE genotype was performed. Finally, the present plasma Aβ42 and Aβ40 prototype assays were compared in a head-to-head analysis with previous versions on the same fully automated platform.[9]
METHODS
Participants and clinical assessments
The Panel A+ study
Participant enrollment and sample collection were performed between 2001 and 2006 at two clinical sites in Germany (the Geriatric and Rehabilitation Clinic of the Henriettenstift in Hannover and at the Memory Clinic, Department of Neurology, Ulm University) as part of a prospective validation study of new biomarkers. All participants with available plasma and CSF samples were selected for the present study. All patients gave their written informed consent, and the study was approved by the regional ethics committees in Ulm and Hannover, Germany. The study participants were classified as 1) cognitively unimpaired (CU; n=32), 2) mild cognitive impairment (MCI; n=106)[35] or 3) mild AD dementia[36] (MMSE>17) (n=89). Inclusion/exclusion criteria are available in the Supplementary Material and in previous publications.[9, 37, 38]
The Swedish BioFINDER study
The Swedish BioFINDER-1 study consecutively included participants between 2010 and 2015 from the southern part of Sweden (clinical trial ID: NCT01208675). The participants were classified as cognitively unimpaired[13] (CU; n=461, of which 287 were cognitively healthy controls and 174 had subjective cognitive decline [SCD][39]) or as having mild cognitive impairment (MCI; n=232), as previously described.[39] Study design and inclusion/exclusion criteria are described at http://biofinder.se and in the Supplementary Material. The participants were followed longitudinally at participating memory clinics with yearly (bi-annually for controls) follow-ups including cognitive testing, informant-based activities of daily living (ADL) questionnaires and detailed assessments by physicians experienced in neurocognitive disorders. All patients gave their written informed consent to participate, and the study was approved by the regional ethics committee in Lund, Sweden.
Plasma and CSF procedures
Plasma and CSF procedures have been published previously for BioFINDER and Panel A+.[9, 40] The details are described in the Supplementary Material.
Prototype immunoassays on cobas e 601 analyzers were used to analyze plasma Aβ42, Aβ40, P-tau181 using an antibody pair recognizing a mid-domain tau epitope, P-tau217 using an antibody pair recognizing an N-terminal tau epitope (P-tau217 N-terminal; Roche Diagnostics), P-tau217 using an antibody pair recognizing a mid-domain tau epitope (P-tau217 mid-domain; Lilly Research Laboratory[2, 4]), ApoE4, NfL and GFAP (see Supplement, Supplementary Tables 1–4 and Supplementary Fig. 1 for assay specifications and comparison with the Meso Scale Discovery platform). In BioFINDER, cobas e 411 analyzers were used to analyze ApoE4, NfL and GFAP for practical reasons to maximize throughput and the same aliquot was used on both instruments. Note that the assays are designed to run on the same cobas instrument using one aliquot. In the statistical analyses, plasma ApoE4 was empirically binarized at 0.9 µg/mL to provide a perfect separation between APOE ε4 carriers and non-carriers.
In addition to the above-described plasma Aβ42 and Aβ40 assays, data from the previously published[9] Elecsys Aβ42 and Aβ40 prototype assays were included for a head-to-head comparison. The old assays were updated for the present plasma analysis in Panel A+ and then further modified for the analyses in BioFINDER (see Supplementary Material and Supplementary Tables 1–3).
CSF Aβ42, Aβ40, P-tau181, were analyzed on cobas e 601 and NfL, and GFAP cobas e 411 analyzers using the Roche NeuroToolKit as previously described.[41]
Outcomes
The primary outcome was Aβ status (abnormal/normal) determined using the CSF Aβ42/Aβ40 ratio. The cutoff for Aβ positivity was established in an unbiased way using mixture modeling statistics.[9, 40, 42–45] The cutoffs to define Aβ positivity in Panel A+ was <0.047 and in BioFINDER <0.066 (note the pre-analytical differences between cohorts that may explain differences in cut-offs).[46]
The secondary outcome was progression to AD dementia (only BioFINDER) within 6 years. Additional secondary outcomes were 1) Aβ status (abnormal/normal) determined using the CSF P-tau181/Aβ42 ratio and 2) Aβ PET imaging using 18F-Flutemetamol. Further details of the outcomes are described in the Supplementary Material. The CSF P-tau181/Aβ42 cutoffs for Aβ positivity were >0.024 in Panel A+ and >0.018 in BioFINDER (established using mixture modelling statistics in the present populations). For 18F-Flutemetamol PET, a previously published cutoff of >0.53 standardized uptake value ratio (SUVR) was used to define Aβ positivity.[4]
Statistical analysis
Aβ status or progression to AD dementia were used as the dependent variables and the plasma biomarkers were used as independent variables in logistic regression models. Stepwise additions of biomarkers are shown in Figs. 1, 3, and 4, starting with the biomarker with highest area under the receiver operating characteristic (AUC) curve and then adding biomarkers based on the biomarker whose addition resulted in the largest decrease in Akaike Information Criterion (AIC). Accuracy was measured using the AUC and AUCs were compared using DeLong statistics. R version 4.0 was used for all statistical analyses. See Supplement for further description of the statistical analysis.
Figure 1. Discrimination of Aβ positive (n=117) vs negative (n=110) participants in Panel A+.
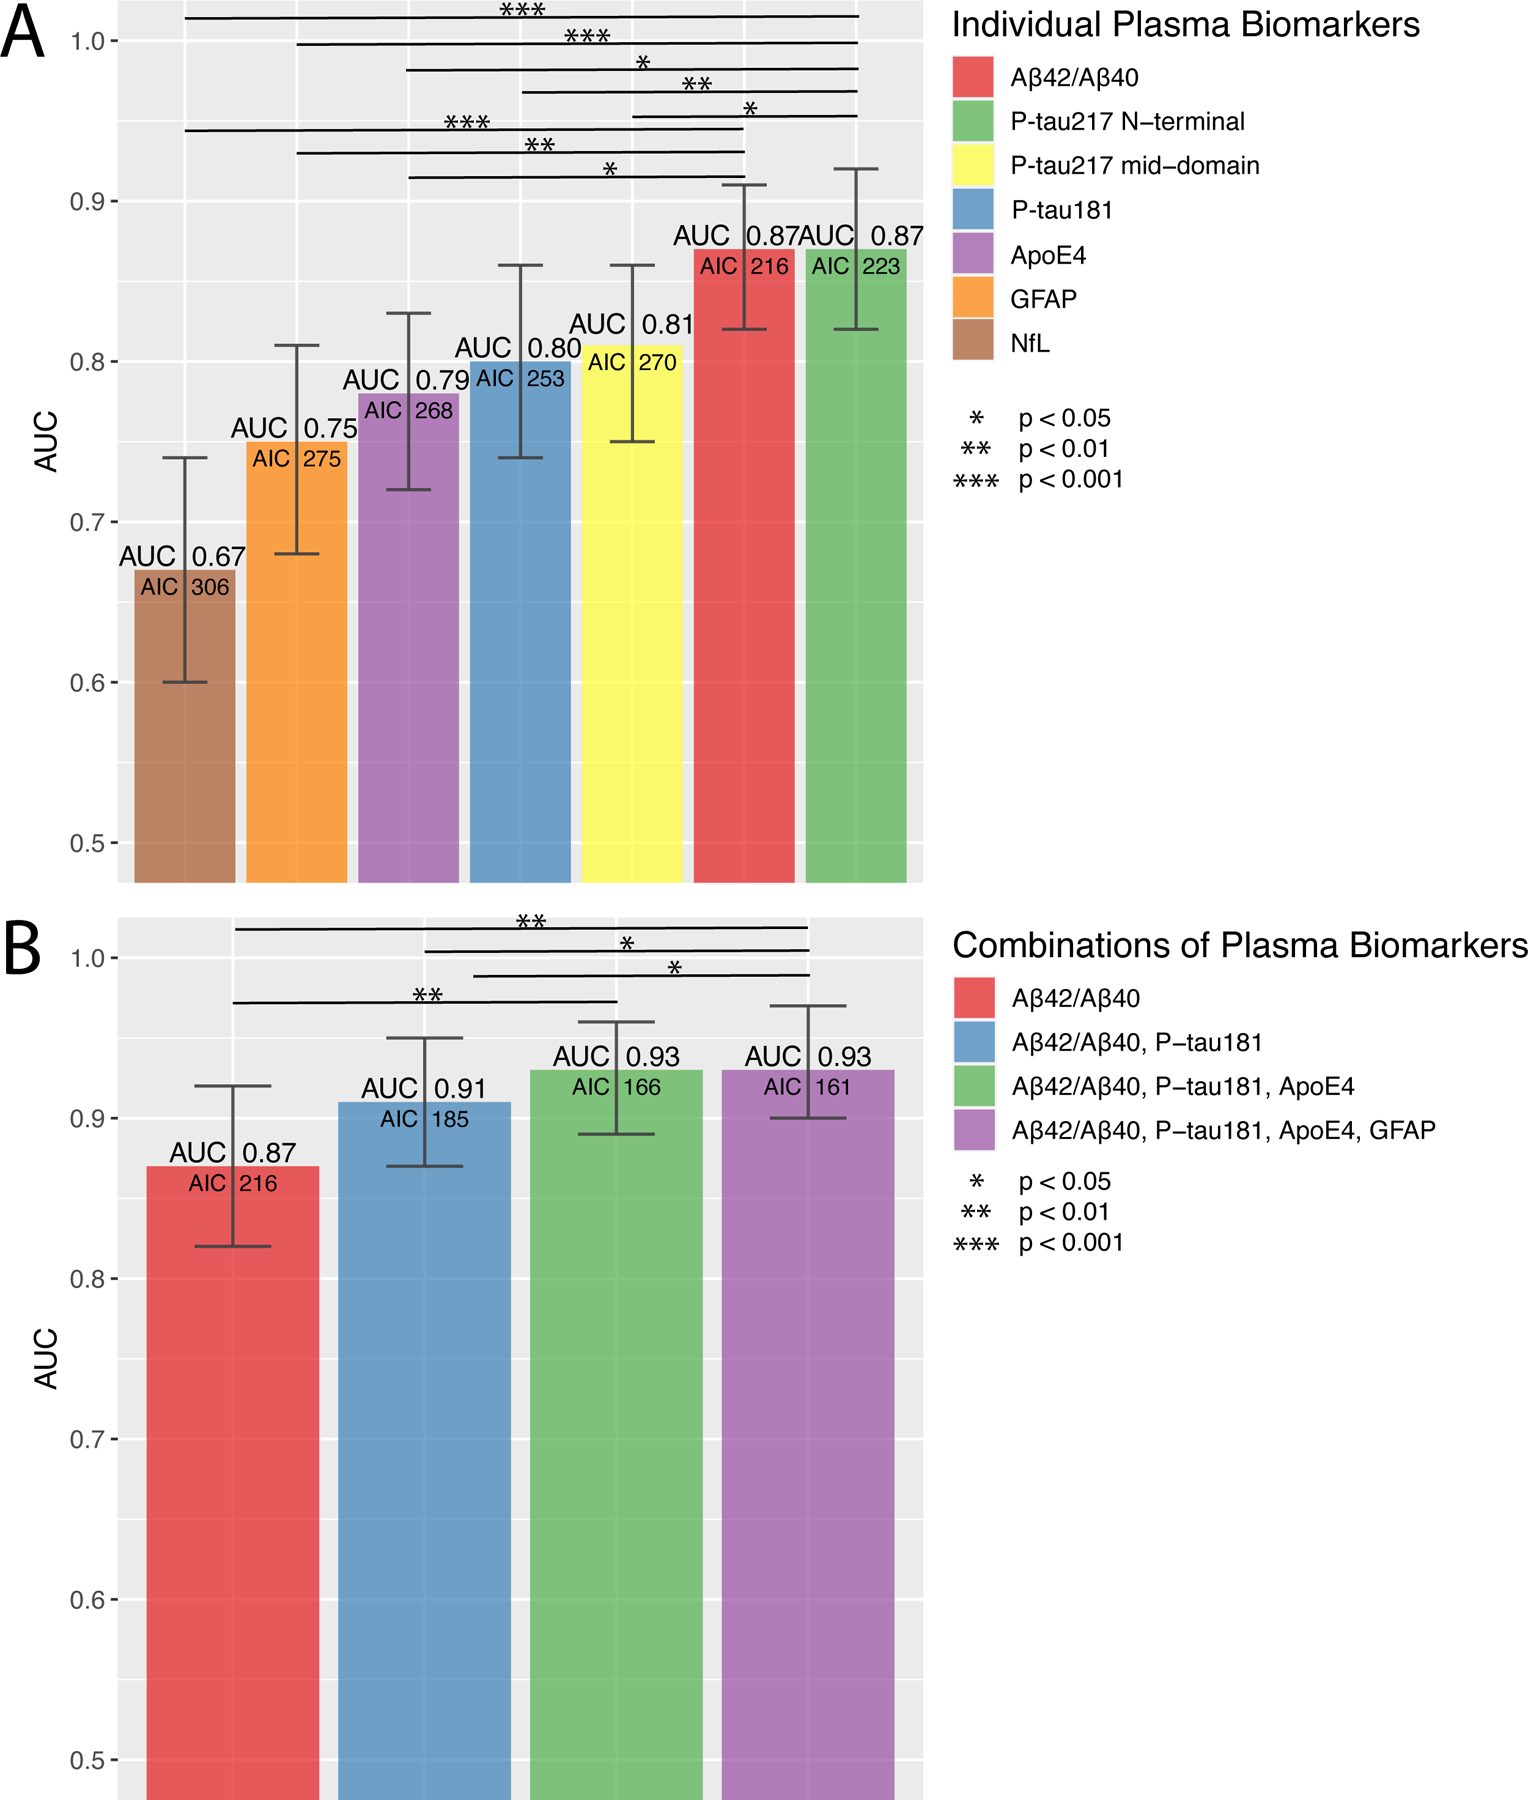
ROC analysis of single (A) and combinations (B) of plasma biomarkers for discriminating Aβ positive vs Aβ negative participants. Bars show the AUC and whiskers the 95% CI of the AUC. Models (B) were built, starting with the biomarker with the highest AUC. Additional biomarkers were added step-wise based on how much the AIC was reduced. Biomarkers that did not reduce the AIC were not added. Statistical comparisons of AUCs between the two best models and the other models are shown in the figures. Note that using P-tau217 N-terminal instead of P-tau181 provided similar AUCs (ΔAUC<0.01), see Supplementary Table 9. Additional models and model comparisons are shown in Supplementary Tables 7–9.
Abbreviations: Aβ, β-amyloid (positivity defined by CSF Aβ42/Aβ40) AIC, Akaike information criterion; ApoE4, the E4 isoform of apolipoprotein E; AUC, area under the receiver operating characteristic curve; CI, confidence interval; GFAP, glial fibrillary acidic protein; NfL, neurofilament light; P-tau217 mid-domain, Phospho-tau217 using an antibody pair recognizing a mid-domain tau epitope; P-tau217 N-terminal, Phospho-tau217 using an antibody pair recognizing an N-terminal tau epitope.
Figure 3. Discrimination of Aβ positive (n=403) vs negative (n=290) participants in BioFINDER (n=693).
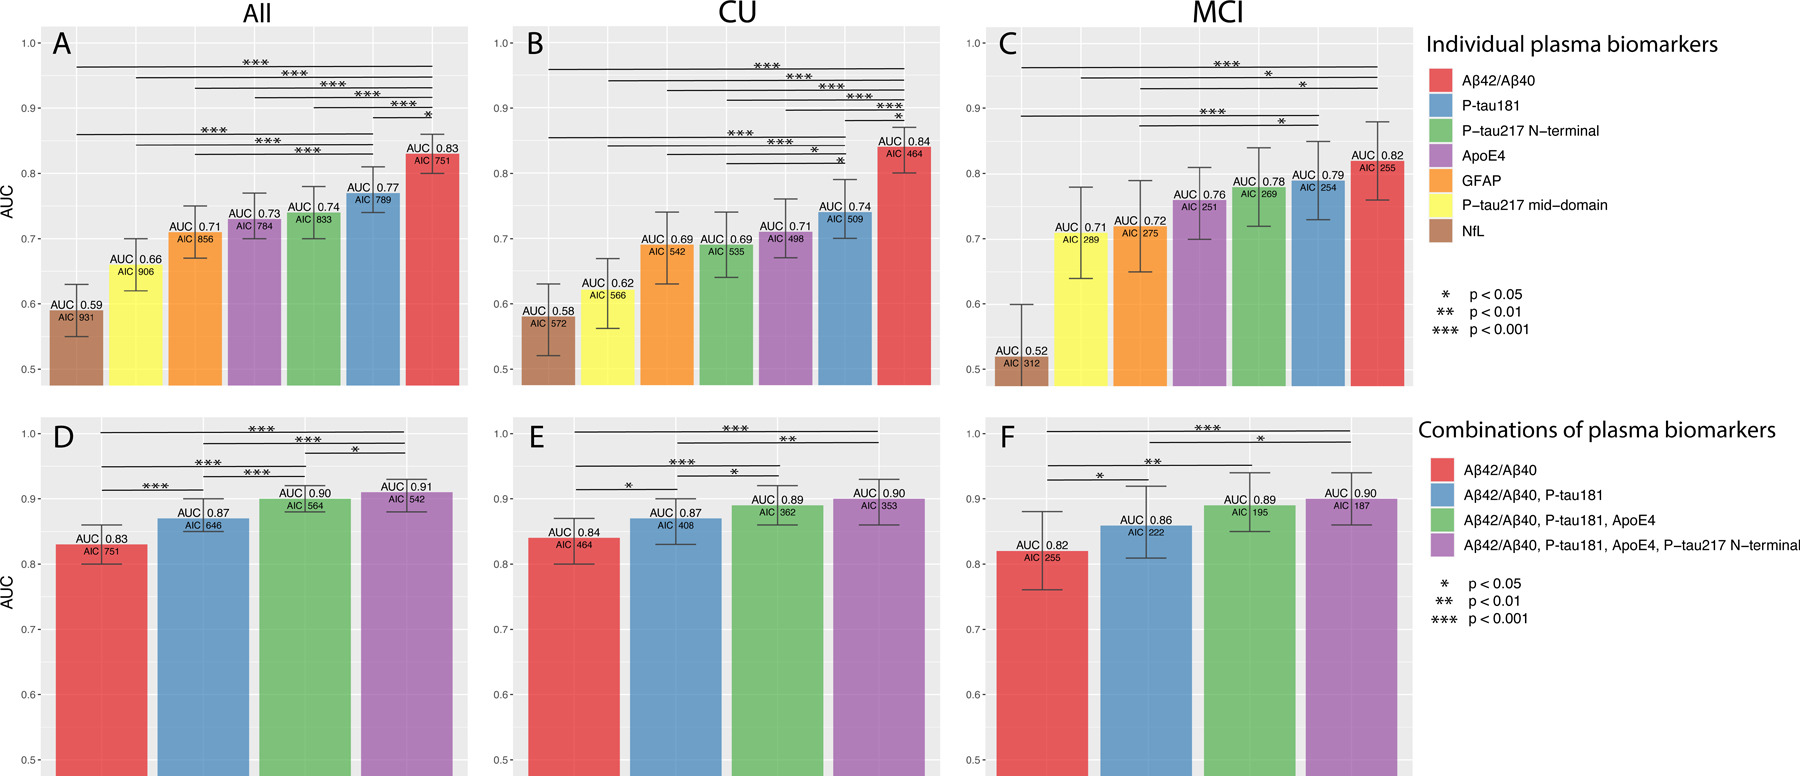
ROC analysis from all participants (A, D), CU (B, E) and MCI (C, F) using single (A–C) and combinations (D–F) of plasma biomarkers. Bars show the AUC and whiskers the 95% CI of the AUC. Models were built, starting with the biomarker with the highest AUC. Additional biomarkers were added step-wise based on how much the AIC was reduced. Biomarkers that did not reduce the AIC were not added. Statistical comparisons of AUCs between the two best models and the other models are shown in the figures. Additional models and model comparisons are shown in Supplementary Tables 10–16.
Abbreviations: Aβ, β-amyloid (positivity defined by CSF Aβ42/Aβ40) AIC, Akaike information criterion; ApoE4, the E4 isoform of apolipoprotein E; AUC, area under the receiver operating characteristic curve; CI, confidence interval; CU, cognitively unimpaired; GFAP, glial fibrillary acidic protein; MCI, mild cognitive impairment; NfL, neurofilament light; P-tau217 mid-domain, Phospho-tau217 using an antibody pair recognizing a mid-domain tau epitope; P-tau217 N-terminal, Phospho-tau217 using an antibody pair recognizing an N-terminal tau epitope.
Figure 4. Prediction of development of AD dementia within 6 years in BioFINDER.
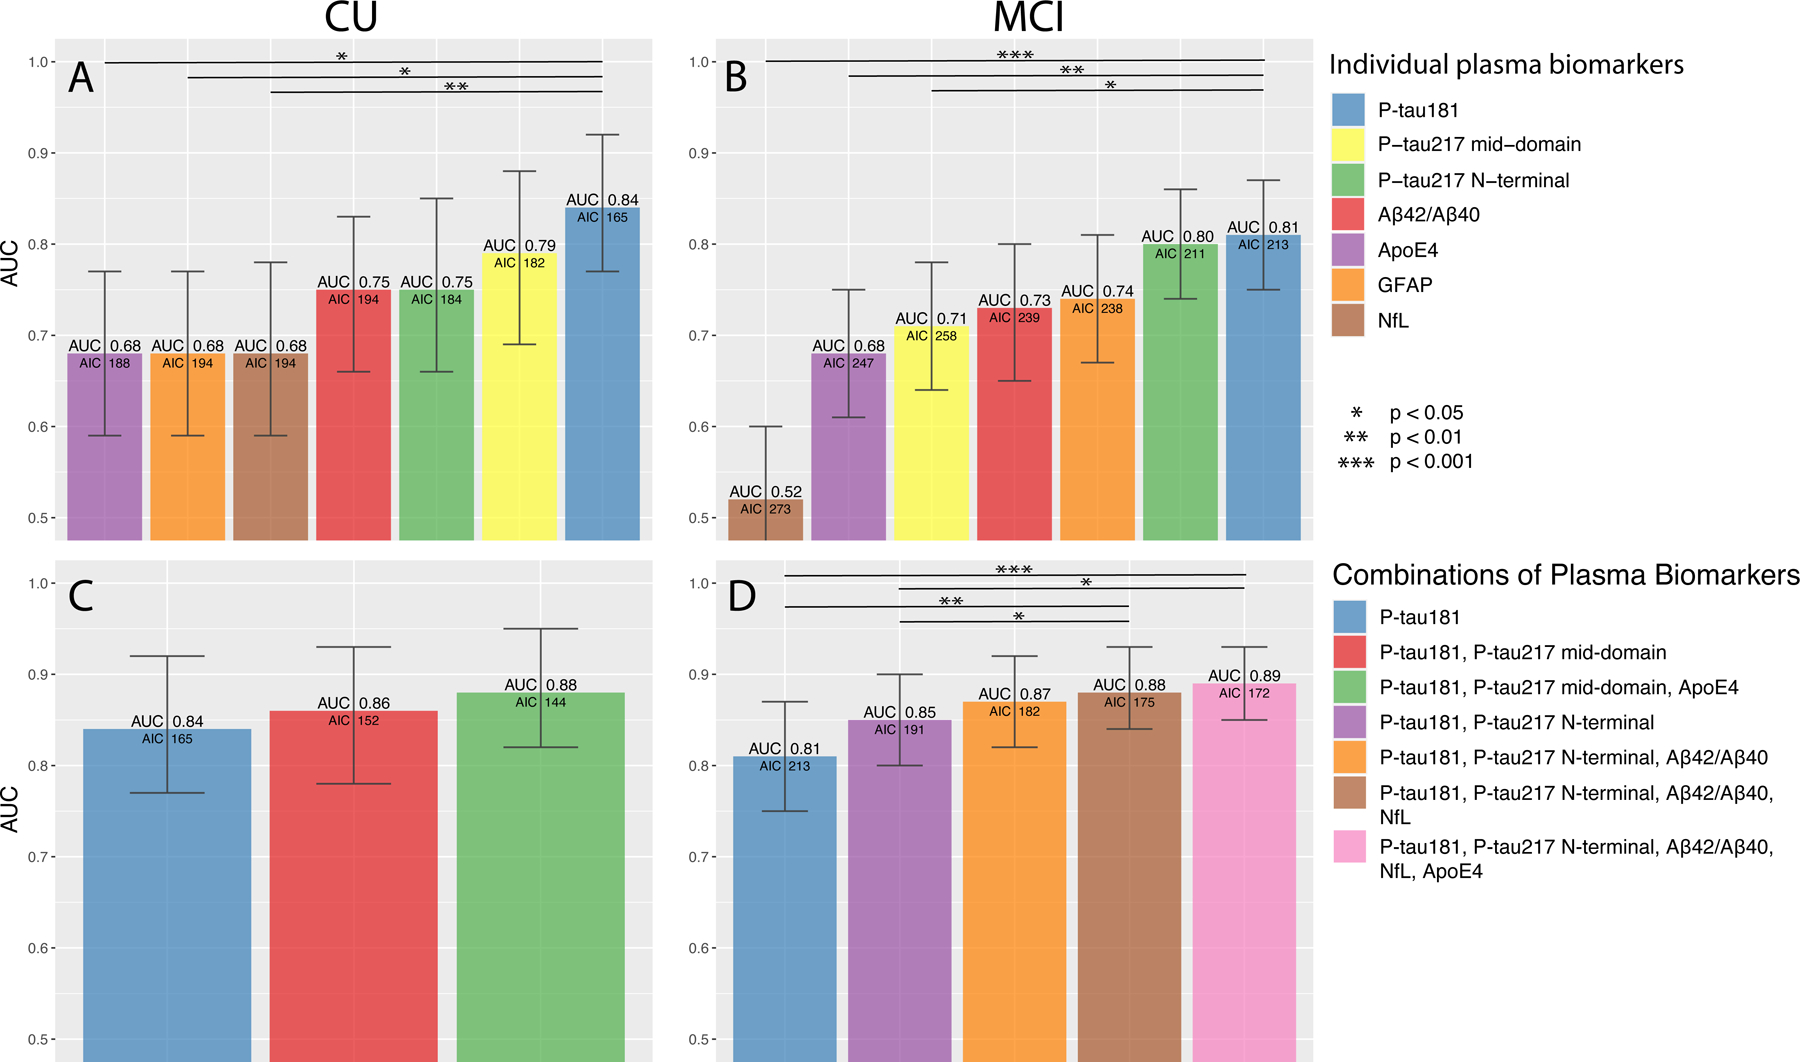
ROC analysis from participants that were CU (A, C) or had MCI (B, D) at baseline using single (A-B) and combinations (C-D) of plasma biomarkers. Bars show the AUC and whiskers the 95% CI of the AUC. Models were built, starting with the one with the highest AUC. Additional biomarkers were added step-wise based on how much the AIC was reduced. Biomarkers that did not reduce the AIC were not added. Statistical comparisons of AUCs between the two best models and the other models are shown in the figures. Additional models and model comparisons are shown in Supplementary Tables 17–20 (including all steps in panel D).
Abbreviations: Aβ, β-amyloid (positivity defined by CSF Aβ42/Aβ40) AIC, Akaike information criterion; ApoE4, the E4 isoform of apolipoprotein E; AUC, area under the receiver operating characteristic curve; CI, confidence interval; CU, cognitively unimpaired; GFAP, glial fibrillary acidic protein; MCI, mild cognitive impairment; NfL, neurofilament light; P-tau217 mid-domain, Phospho-tau217 using an antibody pair recognizing a mid-domain tau epitope; P-tau217 N-terminal, Phospho-tau217 using an antibody pair recognizing an N-terminal tau epitope.
RESULTS
Participants and assay precision
The Panel A+ cohort included 227 participants of which 32 (14%) were CU, 106 (47%) had MCI, and 89 (39%) mild dementia. The BioFINDER-1 study included 693 participants of which 461 (67%) were CU and 232 (33%) had MCI. Baseline characteristics are shown Table 1 and Supplementary Tables 5–6. Inter- and intra-instrument coefficients of variation (CV) were generally below <4.0% for all biomarkers (Supplementary Tables 1 and 4).
Table 1.
Characteristics of the Panel A+ and BioFINDER cohorts
| Variables | Panel A+ | BioFINDER | ||||
|---|---|---|---|---|---|---|
| Aβ negativen n=117 |
Aβ positiven n=110 |
P-value | Aβ negativen n=403 |
Aβ positiven n=290 |
P-value | |
| Clinical diagnosis, n | 28 CU 68 MCI 21 mild dementia |
4 CU 38 MCI 68 mild dementia |
<0.001 | 315 CU* 88 MCI |
146 CU** 144 MCI |
<0.001 |
| Age, years | 63.6 (10.8) | 69.5 (7.9) | <0.001 | 71.9 (5.6) | 73.0 (5.3) | 0.004 |
| Female, n (%) | 52 (44) | 62 (56) | 0.085 | 216 (54) | 153 (53) | 0.83 |
| MMSE, points | 27.0 (2.5) | 25.3 (2.3) | <0.001 | 28.6 (1.5) | 27.6 (1.8) | <0.001 |
| Plasma Aβ42, pg/mL *** | 25.0 (6.4) | 20.3 (5.3) | <0.001 | 32.0 (6.2) | 27.9 (5.2) | <0.001 |
| Plasma Aβ40, ng/mL | 266 (58.2) | 258 (61.1) | 0.665 | 263 (42.4) | 260 (40.1) | 0.34 |
| Plasma Aβ42/Aβ40 *** | 0.0936 (0.0103) | 0.0785 (0.00986) | <0.001 | 0.122 (0.014) | 0.108 (0.012) | <0.001 |
| Plasma P-tau181, pg/mL *** | 0.353 (0.155) | 0.538 (0.216) | <0.001 | 0.90 (0.47) | 1.36 (0.67) | <0.001 |
| Plasma P-tau217 N-terminal, pg/mL *** | 0.127 (0.120) | 0.300 (0.154) | <0.001 | 0.042 (0.10) | 0.112 (0.16) | <0.001 |
| Plasma P-tau217 mid-domain, pg/mL *** | 0.292 (0.934) | 0.492 (1.19) | <0.001 | 0.217 (0.44) | 0.316 (0.32) | <0.001 |
| Plasma GFAP, ng/mL | 0.0989 (0.0863) | 0.155 (0.0940) | <0.001 | 0.0896 (0.059) | 0.130 (0.067) | <0.001 |
| Plasma ApoE4 positivity, n (%) | 23 (20) | 79 (72) | <0.001 | 72 (18) | 188 (65) | <0.001 |
| Plasma NfL, pg/mL | 3.94 (13.6) | 3.33 (2.30) | <0.001 | 2.69 (2.0) | 3.13 (2.2) | <0.001 |
| CSF Aβ42/Aβ40 | 0.0688 (0.00958) | 0.0307 (0.00747) | <0.001 | 0.094 (0.053) | 0.043 (0.01) | <0.001 |
| CSF P-tau181, pg/mL | 16.1 (5.24) | 38.8 (18.7) | <0.001 | 17.3 (5.36) | 29.6 (13.6) | <0.001 |
| CSF GFAP ng/mL | N/A | N/A | 13.6 (11.9) | 15.7 (6.5) | <0.001 | |
| CSF NfL pg/mL | N/A | N/A | 162 (128) | 210 (151) | <0.001 | |
Data are shown as mean (SD) if not otherwise specified.
Including 107 with SCD.
Including 67 with SCD.
Assays were updated after the analysis in Panel A+ (before the BioFINDER analysis). Values in Panel A+ and BioFINDER are therefore not comparable (see Supplementary Table 3 for details on the assay modifications).
Identification of Aβ positivity in Panel A+
110 (48%) participants were Aβ positive in the whole sample. Boxplots and data points of the biomarkers are shown in Supplementary Fig. 2–3. Fig. 1A–B shows the accuracy for estimating Aβ positivity and Supplementary Tables 7–9 additional biomarker combinations as well as model comparisons. Plasma Aβ42/Aβ40 and plasma P-tau217 N-terminal, respectively, had the highest AUCs (both 0.87, 95% CI 0.82–0.91 and 0.82–0.92, respectively). Adding plasma ApoE4 to another biomarker significantly improved its accuracy and these two biomarker combinations had AUCs of 0.86–0.91 except for the combination of plasma ApoE4 and NfL (0.83) (Supplementary Table 8). When combining different biomarkers, the highest AUC was achieved using Aβ42/Aβ40, P-tau181, and ApoE (0.93, 95% CI 0.89–0.96; Fig. 1B). Equally high AUC was achieved when using P-tau217 N-terminal instead of P-tau181 (Supplementary Table 9). Adding GFAP to the model improved the AIC slightly (ΔAIC −5) but with similar AUC (0.93). Using plasma Aβ42 and Aβ40 as separate variables in the models instead of the Aβ42/Aβ40 ratio provided similar AUCs (data not shown). Adding age and/or sex to the models did not result in significantly higher AUCs (data not shown).
Identification of Aβ positivity in BioFINDER
290 (42%) participants were Aβ positive in the whole sample, 146 (32%) in the CU group and 144 (62%) in the MCI group. Boxplots of the biomarkers are shown in Fig. 2 with individual data points in Supplementary Fig. 4. Fig. 3 shows biomarker performance and the main combinations, while Supplementary Tables 10–16 show additional models. Plasma Aβ42/Aβ40 had the highest AUC in the whole sample (0.83, 95% CI 0.80–0.86) and in separate CU (0.84, 95% CI 0.80–0.87) and MCI groups (0.81, 95% CI 0.75– 0.87). Adding ApoE4 to another biomarker significantly improved its accuracy (Supplementary Table 11). Similar to Panel A+, the combination of plasma Aβ42/Aβ40, P-tau181, and ApoE4 had a high AUC (0.90, 95% CI 0.88–0.93; Fig. 3A). Adding P-tau217 N-terminal improved the model fit (ΔAIC −22), but with similar AUC (0.91, 95% CI 0.89–0.93; Fig. 3D, Supplementary Table 12). Results were similar in separate CU and MCI groups (Fig. 3B–C, 2E–F and Supplementary Tables 13–16). Adding age or sex to the models did not result in significantly higher AUCs (data not shown).
Figure 2. Boxplots of the plasma biomarker concentrations in BioFINDER grouped by Aβ status.
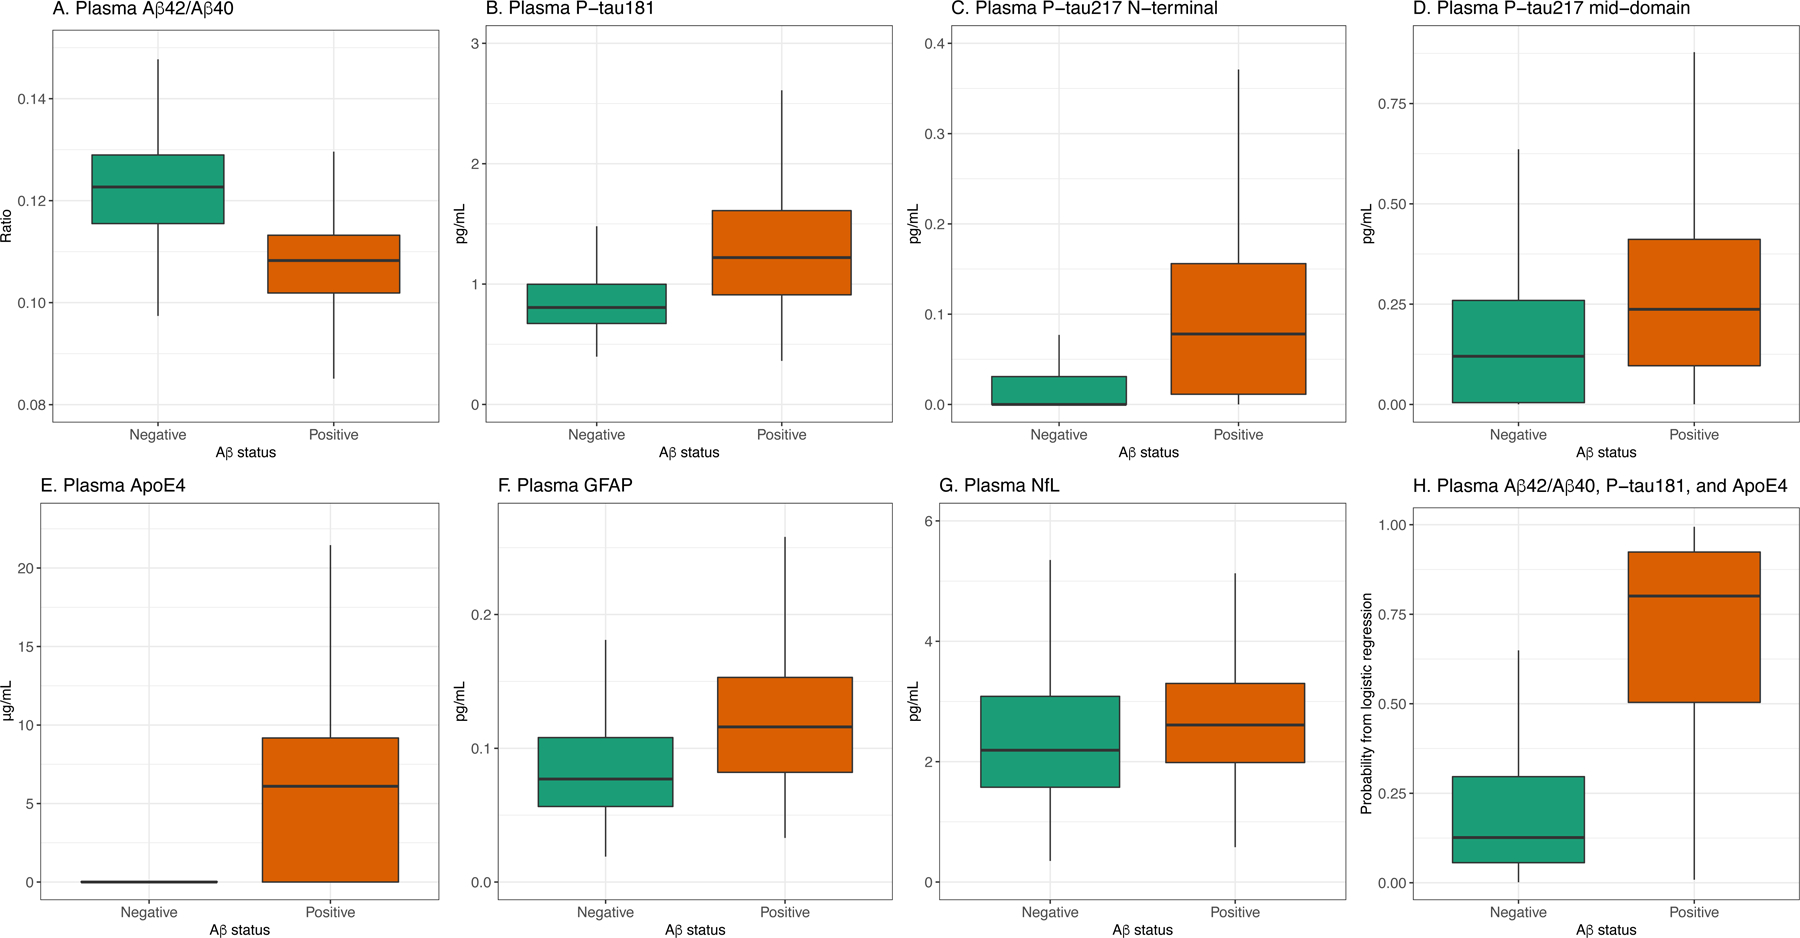
A, Aβ42/40, B, P-tau181, C, P-tau217 N-terminal, D, P-tau217 mid-domain, E, ApoE4, F, GFAP, G, NfL, G, probability from a logistic regression model including Aβ42/40, P-tau181, and ApoE4. Individual data points are shown in Supplementary Fig. 4. Corresponding data for Panel A+ are shown in Supplementary Fig. 2–3.
Prediction of future AD dementia in BioFINDER
Of 342 CU participants who either converted to dementia within 6 years or were followed for ≥6 years, 29 (8%) progressed to AD dementia, 22 (6%) progressed to other dementias, and 292 (85%) did not progress to dementia. Plasma P-tau181 had the highest AUC for predicting progression to AD dementia (0.84, 95%CI 0.77–0.92; Fig. 4A, Supplementary Table 17). Combining P-tau181, P-tau217 mid-domain, and ApoE provided a non-significantly higher AUC (0.88, 95%CI 0.82–0.95; Fig. 4C, Supplementary Table 18).
Of 194 participants with MCI who either converted to dementia within 6 years or were followed for ≥6 years, 99 (51%) progressed to AD dementia, 66 (34%) progressed to other dementias, and 30 (15%) did not progress to dementia. Single biomarkers are presented in Supplementary Table 19 and Fig. 4B and biomarker combinations in Supplementary Table 20 and Fig. 4D. The combination of P-tau181, P-tau217 N-terminal, and Aβ42/Aβ40 had an AUC of 0.87 (0.82–0.92; Fig. 4D). Combining five biomarkers provided the lowest AIC, but did not significantly improve the AUC (0.89, 95%CI 0.85–0.93; p=0.10; Fig. 4D, Supplementary Table 20).
Secondary analyses
Correlation between plasma and CSF biomarkers
Significant correlations among the biomarkers in BioFINDER are visualized in Fig. 5A (correlation coefficients in Supplementary Fig. 5) and for Panel A+ in Supplementary Fig. 6A–B. In BioFINDER, the Spearman rho between the corresponding plasma and CSF biomarkers were 0.63 for NfL, 0.54 for P-tau181, 0.54 for GFAP, and 0.40 for Aβ42/Aβ40. In Panel A+ it was 0.64 for Aβ42/Aβ40 and 0.52 for P-tau181. Note that Elecsys CSF NfL and GFAP were not available in Panel A+ and CSF P-tau217 was not available in either cohort.
Figure 5. Associations between plasma and CSF biomarkers and between plasma ApoE4 and APOE genotype in BioFINDER.
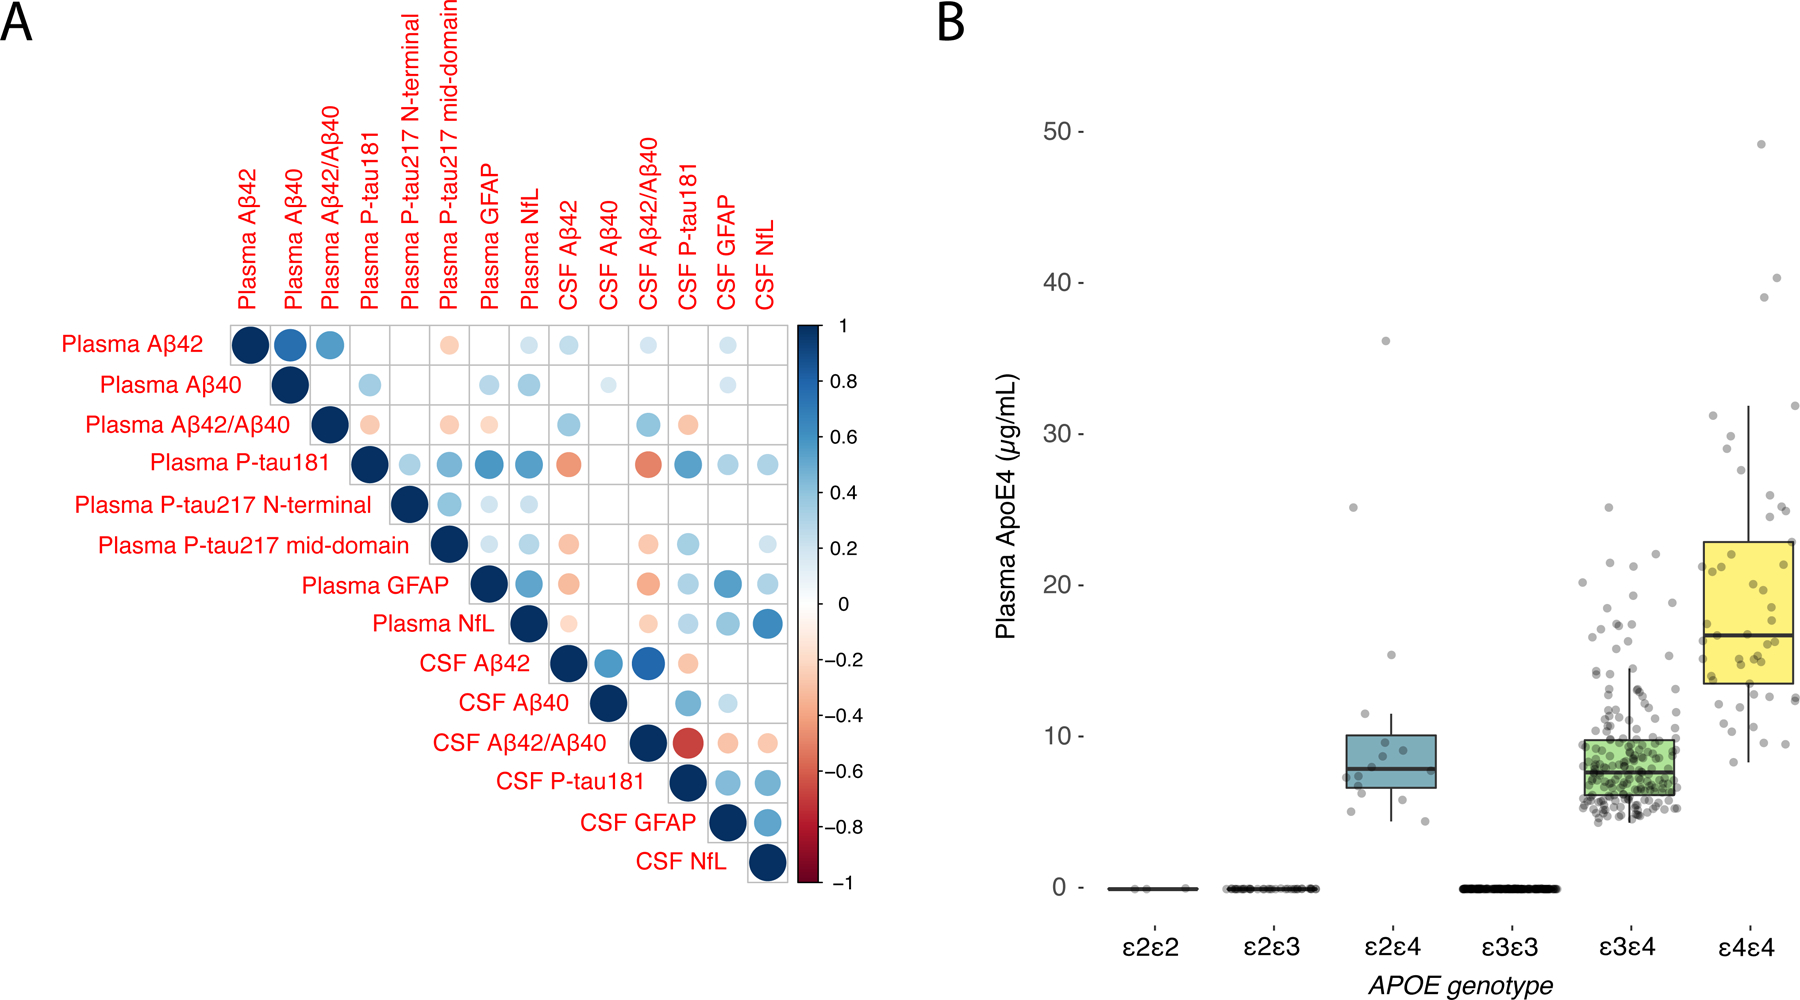
(A) Spearman correlation matrix of the association between plasma and CSF biomarkers. Size and color of the circles indicates the Spearman rho (according to the scale on the right side). Blank boxes are non-significant correlations. Exact Spearman rho values are shown in Supplementary Fig. 5. (B) Boxplots of plasma ApoE4 levels by APOE genotype. Box ends denotes the 25th and 75th percentile and the horizontal line the median. Whiskers extend to the upper and lower adjacent values within 1.5 × interquartile range of the 25th and 75th percentiles. Black dots indicated values above/below the whiskers. In addition, shaded grey dots show all individual participants. 1 participant was missing APOE genotyping and was excluded. 1 outlier with APOE ε4/ε4 genotype and plasma ApoE4 concentration of 117.7 µg/mL is not shown (to improve visualization), but that participant is included in the calculation of the median, box and whiskers.
Corresponding data for Panel A+ is shown in Supplementary Fig. 6.
Abbreviations: Aβ, β-amyloid (positivity defined by CSF Aβ42/Aβ40) AIC, Akaike information criterion; ApoE4, the E4 isoform of apolipoprotein E; AUC, area under the receiver operating characteristic curve; CI, confidence interval; CSF, cerebrospinal fluid; CU, cognitively unimpaired; GFAP, glial fibrillary acidic protein; MCI, mild cognitive impairment; NfL, neurofilament light; P-tau217 mid-domain, Phospho-tau217 using an antibody pair recognizing a mid-domain tau epitope; P-tau217 N-terminal, Phospho-tau217 using an antibody pair recognizing an N-terminal tau epitope.
Plasma ApoE4 concentrations and APOE genotype
As shown in Fig. 5B (BioFINDER) and Supplementary Fig. 6C, plasma ApoE4 levels were only increased in APOE ε4 carriers. Dichotomized plasma ApoE4 concentration separated APOE ε4 carriers vs. non-carriers perfectly, but with a partial overlap between one and two ε4 alleles. As predictor of Aβ status in Panel A+, number of ε4 alleles had an AUC of 0.80, which was non-significantly different from binarized plasma ApoE4 (0.78; p=0.61). In the larger BioFINDER cohort, a similar AUC difference was significant (number of ε4 alleles, 0.75; binarized plasma ApoE4, 0.73; p<0.001).
Head-to-head comparison of the updated and older plasma Aβ42/Aβ40 ratios
In Panel A+, the plasma Aβ42/Aβ40 ratio using the updated Aβ42 immunoassay had a significantly higher AUC (0.87, 95% CI 0.82–0.92) compared with the Aβ42/Aβ40 ratio using the older Aβ42 immunoassay (0.80, 95% CI 0.74–0.86; p=0.0086) for discriminating Aβ-positive vs -negative participants. In BioFINDER (n=668 in this comparison), the new Aβ42/Aβ40 ratio (which was further improved compared to the updated immunoassays in Panel A+; see Supplementary Table 3) also had a significantly higher AUC (0.83, 95% 0.80–0.86) compared with the earlier Aβ42/Aβ40 ratio (AUC 0.79, 95% CI 0.75–0.82; p=0.026).
Results using CSF P-tau181/Aβ42 and Aβ PET as outcomes
Using CSF P-tau181/Aβ42 as outcome instead of CSF Aβ42/Aβ40 in Panel A+ and BioFINDER provided similar accuracies for all plasma biomarkers (Supplementary Tables 21–24). Using Aβ PET as outcome (available in 461 BioFINDER participants) also provided similar results (Supplementary Tables 25–26).
Comparison of plasma P-tau/T-tau ratios in BioFINDER
No significant improvements in AUCs were seen when using plasma P-tau/T-tau ratios for identifying Aβ positivity (Supplementary Table 27).
DISCUSSION
Using the Elecsys prototype immunoassays on fully automated instruments, the combination of plasma Aβ42/Aβ40, P-tau181, and ApoE4 had high accuracy in two independent cohorts for identifying Aβ positivity (AUCs 0.90–0.93), with similar results in CU and MCI subgroups and when using alternative outcomes (CSF P-tau181/Aβ42 or Aβ PET). A combination of three biomarkers could predict progression to AD dementia within 6 years with AUCs of 0.88 (among CU) and 0.87 (among MCI; Fig. 4). Measuring plasma ApoE4 concentration perfectly separated APOE ε4 carriers (identified by genotyping) from non-carriers (Fig. 5B, and Supplementary Fig. 6C). Finally, the updated plasma Aβ42/Aβ40 assays had significantly better accuracy for detecting cerebral Aβ compared to the previous versions.
The greatest novelty of the present study lies in the transformation of all key AD biomarkers onto a fully automated platform (Elecsys immunoassays on a cobas e analyzer). This platform has been well validated for CSF AD biomarkers in several large cohorts and has been implemented for use in routine clinical practice world-wide.[33, 49–51] When running daily analyses in routine clinical practice, stable measurements over time, and between instruments and laboratories are important. This was demonstrated by the low CVs (<4.5%) for all plasma biomarkers (Supplementary Table 1 and 4) and in line with previous CSF biomarker results for the Elecsys immunoassays.[33] For plasma analyses, however, there is only one previous study examining Aβ42 and Aβ40 Elecsys assays.[9] In the present study, we showed that the updated Elecsys Aβ42/Aβ40 assays had higher accuracy for Aβ positivity with precise/robust measurements (CVs of 0.4–2.9%; see Supplementary Table 1), and potentially could be classified as a clinical grade assay. The large overlap between the Aβ positive and negative groups (Fig. 2A) could however become an issue when applying a predefined cutoff and measuring samples in daily/weekly batches over time if e.g. calibration errors occur. One way of overcoming this might be to use a combination of biomarkers that more clearly separate the groups and is less sensitive to errors in a single biomarker assay (Fig. 2H).
A novelty of the plasma biomarker panel was to measure plasma ApoE4 protein concentrations, which perfectly separated APOE ɛ4 carriers from non-carriers (Fig. 5B and Supplementary Fig. 6C). In terms of estimating Aβ positivity, ApoE4 provides similar information as APOE genotyping, but it may facilitate test logistics and implementation. Instead of sending a separate blood sample for APOE genotyping, the present approach allows for an analysis of all essential biomarkers at the same laboratory and on the same instrument from the same sample. In addition to being a risk marker for future and present Aβ pathology, ApoE4 plays an important role in the risk/benefit assessment before starting anti-Aβ treatment.[20] Note, however, that plasma ApoE4 did not perfectly separate carriers of one versus two ɛ4 alleles and in instances where that needs to be specified, traditional APOE genotyping must still be performed.
Regarding P-tau, we compared one P-tau181 and two P-tau217 assays (a mid-domain antibody and an N-terminal antibody). Compared to using P-tau217 mid-domain on other platforms such as the Meso Scale Discovery (MSD)[2], the present accuracies were lower and suggest that further optimization is needed. The P-tau217 N-terminal had higher accuracies for Aβ positivity than the mid-domain assay (Fig. 1A and 3A–C; Supplementary Tables 7, 10, 13, and 15), but on the other hand had a much higher number of participants below the detection limit (discussed under Limitations). For plasma P-tau181, there were no participants below detection limit and its performance both as a single biomarker and in combination with Aβ42/Aβ40 and ApoE4 was overall similar to P-tau217. This highlights that although P-tau217 has performed better in previous studies for identifying AD pathology,[2, 4, 52–55] the type of analysis platform might be just as important[56, 57] and for the present platform P-tau181 seems to more suitable than P-tau217.
When combining Aβ42/Aβ40, ApoE4 and P-tau181, high AUCs were achieved in both cohorts (AUC 0.90–0.93), and in separate populations of CU (AUC 0.89) and MCI (AUC 0.89) participants (Fig. 1 and 3). Although adding additional biomarkers such as GFAP improved model fit (important from the aspect of robust measurements over time and between populations), it did not consistently increase the accuracy for Aβ positivity further (Fig. 1B, Fig. 3E–F; Supplementary Tables 9, 12, 14, and 16).
For predicting development of future AD dementia in BioFINDER, other biomarker combinations had the best performances (Fig. 4C–D; Supplementary Tables 18 and 20). Similar to previous studies,[2, 27] plasma P-tau biomarkers performed best as single biomarkers both in the CU and MCI groups (Fig. 4A–B). When identifying the optimal combination of biomarkers, both P-tau181 and P-tau217 were selected and provided independent information about progression to AD dementia (Fig. 4C–D).
When using a combination of biomarkers to estimate cerebral Aβ or progression to AD dementia, the individual outcome is a probability (for Aβ positivity or AD) from 0 to 1 (Fig. 2H). Instead of defining individual biomarker cutoffs, the cutoff from a combination (i.e., logistic regression model) would naturally be >0.5 (>50% probability of Aβ positivity). Alternatively, more information from the biomarker results could be utilized if results are stratified (low, intermediate, high probability) or even on a continuous scale with the probability of Aβ positivity ranging from 0–100% as implemented in recently published biomarker algorithms.[22, 29]
The main limitation of the present study was that measured plasma P-tau217 N-terminal and mid-domain concentrations were in many cases below the lower level of detection (Supplementary Table 4). For P-tau217 N-terminal, 39% had to be assigned the calculation minimum level and for P-tau217 mid-domain, 18% (Supplementary Table 4). However, >90% of Aβ positive participants had levels above the calculation limit for P-tau217 mid-domain and >80% for P-tau217 N-terminal. This indicates that these unmeasurably low levels to a large extent represent true low concentrations and being able to measure lower concentration might not change the accuracy noticeably. Nonetheless, this issue highlights that further assay optimization is needed and this is also why we advocate the use of P-tau181 on this platform instead. As for future novel biomarkers, it would be interesting to examine other both shorter and longer Aβ peptide ratios such as Aβ37/Aβ42, as recently shown to be promising.[58]
In summary, we found that using a fully automated instrument, a combination of three biomarkers identified Aβ positivity in two independent cohorts with high accuracy and predicted development of future AD dementia. The findings could be important in the implementation of blood-based biomarkers for AD diagnostics, recruitment in AD trials, and monitoring anti-Aβ therapies because of the high precision (intra- and inter-instrument CV) in combination with a high accuracy. Important steps in a clinical implementation process are to validate the assays’ accuracy and robustness when analyzing samples over longer periods of time using predefined cut-offs and to examine the performance in more diverse populations.
Supplementary Material
Systematic review
PubMed was searched for articles on plasma biomarkers of Alzheimer’s disease (AD) pathology. No article described fully automated assays implemented in clinical practice. Very few articles were found on fully automated plasma assays, and none described a comparison of all key AD biomarkers (Aβ42/Aβ40, P-tau181, P-tau217, GFAP, NfL and ApoE4), which was performed in the present study.
Interpretation
In two independent cohorts (n=920), plasma Aβ42/Aβ40 identified Aβ pathology accurately (AUC 0.83–0.87). Combining Aβ42/Aβ40 with P-tau181 and ApoE4 improved the AUCs (0.90–0.93). A combination of three biomarkers predicted AD dementia within 6 years in cognitively unimpaired (AUC 0.88) and mild cognitively impaired individuals (AUC 0.87). These results, obtained using Elecsys® prototype immunoassays on fully automated instruments, are promising for implementing plasma biomarkers in clinical practice and clinical trials.
Future directions
Future studies should examine the assays’ accuracy and robustness when analyzing samples over longer time periods using predefined cut-offs.
FUNDING
Work at the authors’ research centers was supported by the Swedish Research Council (#2016–00906 and 2018–02052), the Knut and Alice Wallenberg foundation (#2017–0383), the Marianne and Marcus Wallenberg foundation (#2015.0125), the European Research Council (#681712), the Alzheimer Drug Discovery Foundation (ADDF), USA (#201809–2016862 and 201809–2016615), the Swedish Alzheimer Foundation (#AF-939932 and AF-940046), Swedish Brain Foundation (#FO2020–0271 and FO2021–0293), the European Union Joint Program for Neurodegenerative Disorders (JPND2019–466-236), the National Institute of Health (NIH), USA, (grant #1R01AG068398–01), the Alzheimer’s Association 2021 Zenith Award (ZEN-21–848495), the Marianne and Marcus Wallenberg foundation, the Strategic Research Area MultiPark (Multidisciplinary Research in Parkinson’s disease) at Lund University, The Parkinson foundation of Sweden, The Parkinson Research Foundation, the Skåne University Hospital Foundation (#2020-O000028), the Greta and Johan Kock Foundation, the Swedish federal government under the ALF agreement (#2018-Projekt0226, ALFGBG-720931, ALFGBG-715986), Region Skåne (#Projekt-2020–0383). HZ is a Wallenberg Scholar. Eli Lilly provided the antibodies and calibrators for the P-tau217 mid-domain assay. The precursor of 18F-flutemetamol was provided by GE Healthcare and the precursor of 18F-RO948 was provided by Roche. COBAS, COBAS E, and ELECSYS are trademarks of Roche. The Roche NeuroToolKit is a panel of exploratory prototype assays designed to robustly evaluate biomarkers associated with key pathologic events characteristic of AD and other neurological disorders.
Footnotes
DISCLOSURES
SP has served on scientific advisory boards and/or given lectures in symposia sponsored by F. Hoffmann-La Roche, Biogen, and Geras Solutions. CAFvA has served at scientific advisory boards for Biogen, Roche, and Dr. Willmar Schwabe GmbH &Co. KG and has received funding for travel and speaker honoraria from Biogen, Roche diagnostics AG and Dr. Willmar Schwabe GmbH &Co. KG and has received research support from Roche diagnostics AG. HZ has served at scientific advisory boards and/or as a consultant for Abbvie, Alector, Eisai, Denali, Roche Diagnostics, Wave, Samumed, Siemens Healthineers, Pinteon Therapeutics, Nervgen, AZTherapies, CogRx, and Red Abbey Labs, has given lectures in symposia sponsored by Cellectricon, Fujirebio, Alzecure and Biogen, and is a co-founder of Brain Biomarker Solutions in Gothenburg AB (BBS), which is a part of the GU Ventures Incubator Program. KB has served as a consultant or at advisory boards for Abcam, Axon, Biogen, Lilly, MagQu, Novartis and Roche Diagnostics, and is a co-founder of Brain Biomarker Solutions in Gothenburg AB, a GU Venture-based platform company at the University of Gothenburg. TB is a full-time employee of F. Hoffmann-La Roche and owns stock in F. Hoffmann-La Roche. IS is a full-time employee of Roche Diagnostics International LtD and owns stock in F. Hoffmann-La Roche. AJ, EM, GK and UE are full-time employees of Roche Diagnostics GmbH. The other authors report no conflicts of interest. OH has acquired research support (for the institution) from AVID Radiopharmaceuticals, Biogen, Eli Lilly, Eisai, GE Healthcare, Pfizer, and Roche. In the past 2 years, he has received consultancy/speaker fees from Roche, Genentech, Siemens, Biogen, Alzpath, and Cerveau.
REFERENCES
- 1.Hansson O, Biomarkers for neurodegenerative diseases. Nat Med, 2021. 27(6): p. 954–963. [DOI] [PubMed] [Google Scholar]
- 2.Palmqvist S, et al. , Prediction of future Alzheimer’s disease dementia using plasma phospho-tau combined with other accessible measures. Nat Med, 2021. 27(6): p. 1034–1042. [DOI] [PubMed] [Google Scholar]
- 3.Thijssen EH, et al. , Diagnostic value of plasma phosphorylated tau181 in Alzheimer’s disease and frontotemporal lobar degeneration. Nat Med, 2020. 26(3): p. 387–397. [DOI] [PMC free article] [PubMed] [Google Scholar]
- 4.Palmqvist S, et al. , Discriminative Accuracy of Plasma Phospho-tau217 for Alzheimer Disease vs Other Neurodegenerative Disorders. JAMA, 2020. 324(8): p. 772–781. [DOI] [PMC free article] [PubMed] [Google Scholar]
- 5.Karikari TK, et al. , Blood phosphorylated tau 181 as a biomarker for Alzheimer’s disease: a diagnostic performance and prediction modelling study using data from four prospective cohorts. Lancet Neurol, 2020. 19(5): p. 422–433. [DOI] [PubMed] [Google Scholar]
- 6.Cicognola C, et al. , Plasma glial fibrillary acidic protein detects Alzheimer pathology and predicts future conversion to Alzheimer dementia in patients with mild cognitive impairment. Alzheimers Res Ther, 2021. 13(1): p. 68. [DOI] [PMC free article] [PubMed] [Google Scholar]
- 7.Verberk IMW, et al. , Combination of plasma amyloid beta(1–42/1–40) and glial fibrillary acidic protein strongly associates with cerebral amyloid pathology. Alzheimers Res Ther, 2020. 12(1): p. 118. [DOI] [PMC free article] [PubMed] [Google Scholar]
- 8.Schindler SE, et al. , High-precision plasma beta-amyloid 42/40 predicts current and future brain amyloidosis. Neurology, 2019. 93(17): p. e1647–e1659. [DOI] [PMC free article] [PubMed] [Google Scholar]
- 9.Palmqvist S, et al. , Performance of Fully Automated Plasma Assays as Screening Tests for Alzheimer Disease-Related beta-Amyloid Status. Jama Neurology, 2019. 76(9): p. 1060–1069. [DOI] [PMC free article] [PubMed] [Google Scholar]
- 10.Verberk IMW, et al. , Plasma Amyloid as Prescreener for the Earliest Alzheimer Pathological Changes. Ann Neurol, 2018. 84(5): p. 648–658. [DOI] [PMC free article] [PubMed] [Google Scholar]
- 11.Nakamura A, et al. , High performance plasma amyloid-beta biomarkers for Alzheimer’s disease. Nature, 2018. 554(7691): p. 249–254. [DOI] [PubMed] [Google Scholar]
- 12.Ovod V, et al. , Amyloid beta concentrations and stable isotope labeling kinetics of human plasma specific to central nervous system amyloidosis. Alzheimers Dement, 2017. 13(8): p. 841–849. [DOI] [PMC free article] [PubMed] [Google Scholar]
- 13.Jack CR Jr., et al. , NIA-AA Research Framework: Toward a biological definition of Alzheimer’s disease. Alzheimers Dement, 2018. 14(4): p. 535–562. [DOI] [PMC free article] [PubMed] [Google Scholar]
- 14.Mintun MA, et al. , Donanemab in Early Alzheimer’s Disease. N Engl J Med, 2021. [DOI] [PubMed]
- 15.Tolar M, et al. , Aducanumab, gantenerumab, BAN2401, and ALZ-801-the first wave of amyloid-targeting drugs for Alzheimer’s disease with potential for near term approval. Alzheimers Res Ther, 2020. 12(1): p. 95. [DOI] [PMC free article] [PubMed] [Google Scholar]
- 16.FDA 2021. [cited 2021 July 20]; Available from: https://www.fda.gov/drugs/postmarket-drug-safety-information-patients-and-providers/aducanumab-marketed-aduhelm-information.
- 17.Beach TG, et al. , Accuracy of the clinical diagnosis of Alzheimer disease at National Institute on Aging Alzheimer Disease Centers, 2005–2010. J Neuropathol Exp Neurol, 2012. 71(4): p. 266–73. [DOI] [PMC free article] [PubMed] [Google Scholar]
- 18.Dubois B, et al. , Clinical diagnosis of Alzheimer’s disease: recommendations of the International Working Group. Lancet Neurol, 2021. [DOI] [PMC free article] [PubMed]
- 19.Rabinovici GD, et al. , Association of Amyloid Positron Emission Tomography With Subsequent Change in Clinical Management Among Medicare Beneficiaries With Mild Cognitive Impairment or Dementia. JAMA, 2019. 321(13): p. 1286–1294. [DOI] [PMC free article] [PubMed] [Google Scholar]
- 20.Cummings J and Salloway S, Aducanumab: Appropriate use recommendations. Alzheimers Dement, 2021. [DOI] [PMC free article] [PubMed]
- 21.Sperling RA, et al. , The A4 study: stopping AD before symptoms begin? Sci Transl Med, 2014. 6(228): p. 228fs13. [DOI] [PMC free article] [PubMed] [Google Scholar]
- 22.Janelidze S, et al. , Detecting amyloid positivity in early Alzheimer’s disease using combinations of plasma Abeta42/Abeta40 and p-tau. Alzheimers Dement, 2021. [DOI] [PubMed]
- 23.Janelidze S, et al. , Plasma P-tau181 in Alzheimer’s disease: relationship to other biomarkers, differential diagnosis, neuropathology and longitudinal progression to Alzheimer’s dementia. Nat Med, 2020. 26(3): p. 379–386. [DOI] [PubMed] [Google Scholar]
- 24.Karikari TK, et al. , Diagnostic performance and prediction of clinical progression of plasma phospho-tau181 in the Alzheimer’s Disease Neuroimaging Initiative. Mol Psychiatry, 2020. [DOI] [PubMed]
- 25.Mielke MM, et al. , Plasma phospho-tau181 increases with Alzheimer’s disease clinical severity and is associated with tau- and amyloid-positron emission tomography. Alzheimers Dement, 2018. 14(8): p. 989–997. [DOI] [PMC free article] [PubMed] [Google Scholar]
- 26.Pereira JB, et al. , Plasma GFAP is an early marker of amyloid-beta but not tau pathology in Alzheimer’s disease. Brain, 2021. [DOI] [PMC free article] [PubMed]
- 27.Cullen NC, et al. , Individualized prognosis of cognitive decline and dementia in mild cognitive impairment based on plasma biomarker combinations. Nature Aging, 2020. [DOI] [PubMed]
- 28.Preische O, et al. , Serum neurofilament dynamics predicts neurodegeneration and clinical progression in presymptomatic Alzheimer’s disease. Nat Med, 2019. 25(2): p. 277–283. [DOI] [PMC free article] [PubMed] [Google Scholar]
- 29.Palmqvist S, et al. , Accurate risk estimation of beta-amyloid positivity to identify prodromal Alzheimer’s disease: Cross-validation study of practical algorithms. Alzheimers Dement, 2019. 15(2): p. 194–204. [DOI] [PMC free article] [PubMed] [Google Scholar]
- 30.West T, et al. , A blood-based diagnostic test incorporating plasma Abeta42/40 ratio, ApoE proteotype, and age accurately identifies brain amyloid status: findings from a multi cohort validity analysis. Mol Neurodegener, 2021. 16(1): p. 30. [DOI] [PMC free article] [PubMed] [Google Scholar]
- 31.Jansen WJ, et al. , Prevalence of cerebral amyloid pathology in persons without dementia: a meta-analysis. JAMA, 2015. 313(19): p. 1924–38. [DOI] [PMC free article] [PubMed] [Google Scholar]
- 32.Campbell MR, et al. , P-tau/Abeta42 and Abeta42/40 ratios in CSF are equally predictive of amyloid PET status. Alzheimers Dement (Amst), 2021. 13(1): p. e12190. [DOI] [PMC free article] [PubMed] [Google Scholar]
- 33.Hansson O, et al. , CSF biomarkers of Alzheimer’s disease concord with amyloid-beta PET and predict clinical progression: A study of fully automated immunoassays in BioFINDER and ADNI cohorts. Alzheimers Dement, 2018. [DOI] [PMC free article] [PubMed]
- 34.Willemse EAJ, et al. , Comparing CSF amyloid-beta biomarker ratios for two automated immunoassays, Elecsys and Lumipulse, with amyloid PET status. Alzheimers Dement (Amst), 2021. 13(1): p. e12182. [DOI] [PMC free article] [PubMed] [Google Scholar]
- 35.Petersen RC, et al. , Mild cognitive impairment: clinical characterization and outcome. Arch Neurol, 1999. 56(3): p. 303–8. [DOI] [PubMed] [Google Scholar]
- 36.McKhann G, et al. , Clinical diagnosis of Alzheimer’s disease: report of the NINCDS-ADRDA Work Group under the auspices of Department of Health and Human Services Task Force on Alzheimer’s Disease. Neurology, 1984. 34(7): p. 939–44. [DOI] [PubMed] [Google Scholar]
- 37.Riepe MW, et al. , Tau-proteins as gender-specific state markers in amnestic mild cognitive impairment. Dement Geriatr Cogn Disord, 2010. 30(2): p. 93–100. [DOI] [PubMed] [Google Scholar]
- 38.Rozga M, et al. , Impact of pre-analytical sample handling on Elecsys® Aβ40, Aβ42 and tTau immunoassays in plasma., in 11th Clinical Trials on Alzheimer’s disease (CTAD) 2018: Barcelona, Spain. [Google Scholar]
- 39.Petrazzuoli F, et al. , Brief Cognitive Tests Used in Primary Care Cannot Accurately Differentiate Mild Cognitive Impairment from Subjective Cognitive Decline. J Alzheimers Dis, 2020. [DOI] [PMC free article] [PubMed]
- 40.Palmqvist S, et al. , Accuracy of brain amyloid detection in clinical practice using cerebrospinal fluid beta-amyloid 42: a cross-validation study against amyloid positron emission tomography. JAMA Neurol, 2014. 71(10): p. 1282–9. [DOI] [PubMed] [Google Scholar]
- 41.Blennow K, et al. , Exploring the need for robust biomarker assays in Alzheimer’s disease and other neurodegenerative diseases. Alzheimers Dement, 2019. 15(75): p. P2–231. [Google Scholar]
- 42.Benaglia T, et al. , mixtools: An R Package for Analyzing Finite Mixture Models. Journal of Statistical Software, 2009. 32(6): p. 1–29. [Google Scholar]
- 43.Bertens D, et al. , Unbiased estimates of cerebrospinal fluid beta-amyloid 1–42 cutoffs in a large memory clinic population. Alzheimers Res Ther, 2017. 9(1): p. 8. [DOI] [PMC free article] [PubMed] [Google Scholar]
- 44.Janelidze S, et al. , Concordance Between Different Amyloid Immunoassays and Visual Amyloid Positron Emission Tomographic Assessment. JAMA Neurol, 2017. 74(12): p. 1492–1501. [DOI] [PMC free article] [PubMed] [Google Scholar]
- 45.Mormino EC, et al. , Synergistic effect of beta-amyloid and neurodegeneration on cognitive decline in clinically normal individuals. JAMA Neurol, 2014. 71(11): p. 1379–85. [DOI] [PMC free article] [PubMed] [Google Scholar]
- 46.Hansson O, et al. , The impact of preanalytical variables on measuring cerebrospinal fluid biomarkers for Alzheimer’s disease diagnosis: A review. Alzheimers Dement, 2018. 14(10): p. 1313–1333. [DOI] [PubMed] [Google Scholar]
- 47.Burnham KP and Anderson DR, Multimodel Inference:Understanding AIC and BIC in Model Selection. Sociological Methods & Research, 2004. 33(2): p. 261–304. [Google Scholar]
- 48.Olofsen E and Dahan A, Using Akaike’s information theoretic criterion in mixed-effects modeling of pharmacokinetic data: a simulation study. F1000Research, 2013. 2: p. 71. [DOI] [PMC free article] [PubMed] [Google Scholar]
- 49.Doecke JD, et al. , Elecsys CSF biomarker immunoassays demonstrate concordance with amyloid-PET imaging. Alzheimers Res Ther, 2020. 12(1): p. 36. [DOI] [PMC free article] [PubMed] [Google Scholar]
- 50.Schindler SE, et al. , Cerebrospinal fluid biomarkers measured by Elecsys assays compared to amyloid imaging. Alzheimers Dement, 2018. 14(11): p. 1460–1469. [DOI] [PMC free article] [PubMed] [Google Scholar]
- 51.Willemse EAJ, et al. , Diagnostic performance of Elecsys immunoassays for cerebrospinal fluid Alzheimer’s disease biomarkers in a nonacademic, multicenter memory clinic cohort: The ABIDE project. Alzheimers Dement (Amst), 2018. 10: p. 563–572. [DOI] [PMC free article] [PubMed] [Google Scholar]
- 52.Ashton NJ, et al. , Plasma p-tau231: a new biomarker for incipient Alzheimer’s disease pathology. Acta Neuropathol, 2021. 141(5): p. 709–724. [DOI] [PMC free article] [PubMed] [Google Scholar]
- 53.Brickman AM, et al. , Plasma p-tau181, p-tau217, and other blood-based Alzheimer’s disease biomarkers in a multi-ethnic, community study. Alzheimers Dement, 2021. 17(8): p. 1353–1364. [DOI] [PMC free article] [PubMed] [Google Scholar]
- 54.Karikari TK, et al. , Head-to-head comparison of clinical performance of CSF phospho-tau T181 and T217 biomarkers for Alzheimer’s disease diagnosis. Alzheimers Dement, 2021. 17(5): p. 755–767. [DOI] [PMC free article] [PubMed] [Google Scholar]
- 55.Thijssen EH, et al. , Plasma phosphorylated tau 217 and phosphorylated tau 181 as biomarkers in Alzheimer’s disease and frontotemporal lobar degeneration: a retrospective diagnostic performance study. Lancet Neurol, 2021. 20(9): p. 739–752. [DOI] [PMC free article] [PubMed] [Google Scholar]
- 56.Bayoumy S, et al. , Clinical and analytical comparison of six Simoa assays for plasma P-tau isoforms P-tau181, P-tau217, and P-tau231. Alzheimers Res Ther, 2021. 13(1): p. 198. [DOI] [PMC free article] [PubMed] [Google Scholar]
- 57.Mielke MM, et al. , Comparison of Plasma Phosphorylated Tau Species With Amyloid and Tau Positron Emission Tomography, Neurodegeneration, Vascular Pathology, and Cognitive Outcomes. JAMA Neurol, 2021. 78(9): p. 1108–1117. [DOI] [PMC free article] [PubMed] [Google Scholar]
- 58.Liu L, et al. , Identification of the Abeta37/42 peptide ratio in CSF as an improved Abeta biomarker for Alzheimer’s disease. Alzheimers Dement, 2022. [DOI] [PMC free article] [PubMed]
Associated Data
This section collects any data citations, data availability statements, or supplementary materials included in this article.