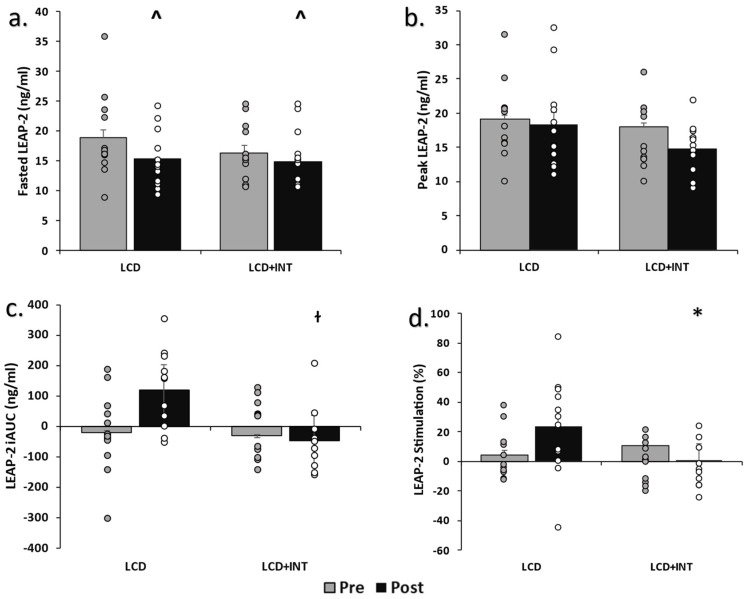
Figure 1.
Circulating LEAP-2 before and after treatments. Note: Raw data shown as mean ± SEM, log transformed for analysis. (a). Fasted LEAP-2 pre- and post-intervention measurements, (b). LEAP-2 peak pre- and post-intervention, (c). LEAP-2 incremental area under the curve pre- and post-intervention, (d). LEAP-2 precent stimulation pre- and post-intervention, LCD: Low-calorie diet; LCD+INT: Low-calorie diet plus interval training; iAUC: incremental area under the curve; LEAP-2: Liver-expressed antimicrobial enzyme-2, Peak: highest observed value, ^ Time effect p = 0.05, ɫ Group × time effect, p = 0.06, * Group × time effect, p = 0.04.

