Abstract
Hydrogen sulfide (H2S) is an essential signaling gas within the cell, and its endogenous levels are correlated with various health diseases such as Alzheimer’s disease, diabetes, Down’s syndrome, and cardiovascular disease. Because it plays such diverse biological functions, being able to detect H2S quickly and accurately in vivo is an area of heightened scientific interest. Using probes that fluoresce in the near-infrared (NIR) region is an effective and convenient method of detecting H2S. This approach allows for compounds of high sensitivity and selectivity to be developed while minimizing cytotoxicity. Herein, we report a review on the synthesis, mechanisms, optical properties, and selected biomedical applications of H2S sensors.
Keywords: H2S sensor, cyanine dye synthesis, UV/Vis spectroscopy, ICT, TICT, FRET, PET, azide reduction
1. Introduction
Hydrogen sulfide (H2S) is the third most important endogenous signal gas that cells use [1,2], after carbon monoxide and nitric oxide. It mediates multiple physiological and pathological processes [3,4]. While crucial to normal biological function, H2S can prove an extremely toxic gas at higher concentrations. Some basic physicochemical and thermodynamic properties of H2S are listed in Table 1 [5].
Table 1.
Basic physicochemical and thermodynamic properties of H2S. Reprinted with permission from Ref. [5]. Copyright ©2018 American Chemical Society.
| Properties | Data |
|---|---|
| Dipole moment | 0.97 D |
| Solubility (in H2O) | 110 mM/atm, 25 °C |
| 210 mM/atm, 0 °C | |
| Boiling temperature | −60.2 °C |
| Density (25 °C, 1 atm) | 1.36 kg/m3 |
| IR | ν1 2525, 2536 cm−1 |
| ν2 1169, 1184, 1189 cm−1 | |
| ν3 2548 cm−1 | |
| 1H-NMR | 0.52 ppm |
| pK1 | 6.98 |
| pK2 | >17 at 25 °C |
| λmax (HS−) | 230 nm |
| ε | 8 × 10³ M−1·cm−1 |
| Henry’s law coefficient (298 K) | 0.087135 mol solute/mol water atom |
| Detection threshold by human nose | 0.02–0.03 ppm |
| Lethal dose | >500 ppm |
| ΔfG° (H2S) | −28 kJ/mol |
| ΔfG° (HS−) | +12 kJ/mol |
| ΔfG° (S2−) | +86 kJ/mol |
| E°′ (S•−, H+/HS−) | +0.91 V |
| E°′ (HS2−, H+/2HS−) | −0.23 V |
A simple molecule, H2S is a marker of some of society’s most prevalent maladies. Cardiovascular disease, diabetes, and Down’s syndrome have all been associated with an increased level of H2S [6]. It is known to regulate myriad biological functions in vivo; oxidative stress, insulin signaling, and cell growth and death are all mediated by this species [7,8]. Energy available to the cell can also be affected by levels of H2S because it is involved in the inhibition of adenosine triphosphate (ATP) [9,10,11,12,13].
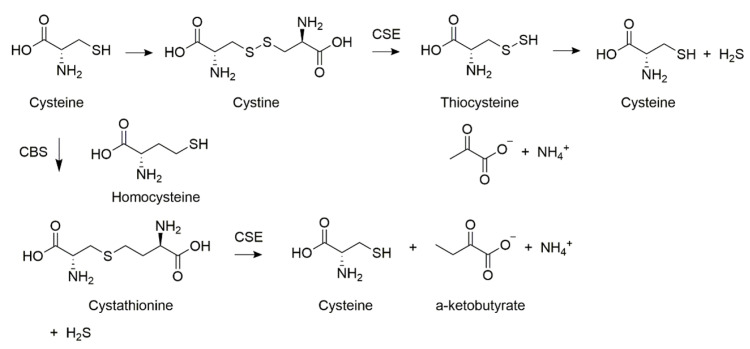
Biosynthesis of H2S in mammals is carried out by the enzymes cystathionine β-synthase (CBS), 3-mercaptopyruvate sulfotransferase (3-MST), and cystathionine γ-lyase (CSE) [14]. The endogenous pathways are laid out in Scheme 1 [15]. Homocysteine acts as the substrate for CBS, with H2S and cystathionine being liberated. The second mode involves a “desulfurization” reaction, whereby sulfur is cleaved from cysteine directly without its oxidation. Furthermore, it has been reported that the activities of these two enzymes in different cells and tissues are correlated to several health disorders [16,17,18]. For these reasons, H2S has become an important medium in the detection of disease [19,20,21].
Scheme 1.
Endogenous hydrogen sulfide synthesizing pathways. Reprinted with permission from Ref. [15]. Copyright ©2010 American Chemical Society.
Traditional methods of H2S detection, such as electrochemical analysis and gas chromatography, require a sample of living cells from target tissues [22,23]. However, since H2S can exist at levels as low as 30 μM in human blood, such methods are inadequate for detecting the analyte in the blood [24]. With these limitations in mind, the discovery of highly sensitive and selective detection methods for H2S is of peak interest [25,26,27,28,29,30]. Traditional methods also present the inherent drawbacks of trauma from conducting biopsies, inconsistent concentrations of the analyte within the target tissue, and an overall more tedious process. To improve results, various probes have been synthesized for the selective and specific detection of H2S [31,32,33].
Recent studies have shown the visible and NIR probes to be favorable due to their high-yield synthesis, modular structures, low cytotoxicity, and high sensitivity and selectivity [34,35,36,37,38,39,40,41,42,43,44,45,46]. Importantly, they work in real time and require nothing but an injection [47]. In the past few years, much work has been put into shortening response times, reducing Stokes shifts, and increasing the fluorescence wavelengths of these compounds [48,49,50,51]. Such findings would provide healthcare workers with new tools to prevent, detect, and treat various diseases.
Most probes featured in this review comprise cyanines and coumarins, operate via the mechanisms of nucleophilic addition and azide group reduction, and produce signals in the NIR region. Their synthesis, optical properties, and applications in the biomedical field are the main focus of this paper. In addition, we discuss the attributes unique to these sensors and challenges in their synthesis while speculating on the future direction of H2S probe development [52,53,54,55,56].
2. Different Mechanisms of H2S Detection
There are many kinds of H2S probes which have been designed and synthesized to date [57,58,59]. In the subsequent sections, we summarize two different mechanisms of H2S detection reported over the last 7 years [60,61,62,63,64,65,66,67,68,69,70,71,72,73,74,75,76,77,78,79,80]. These include probes (Table 2) based on the principles of nucleophilic attack [60,61,62,63,64,65,66,67,68,69,70,71,72,73,74] and reduction of azide groups [75,76,77,78,79,80]. Probes of each type can detect the H2S concentration at different biological levels. For each approach, we can provide examples detailing the structure and synthesis of the pertinent probes. Then, the optical properties and physical characteristics are laid out. Lastly, biomedical applications of these H2S probes are discussed.
Table 2.
A summary of all probes discussed in this review.
| Probe Number | Detection Mechanism | Fluorescence Emission | LOD | Bioapplication | Ref. |
|---|---|---|---|---|---|
| 3 | ICT | 600 nm | 15 nM | HeLa Cells | [61] |
| 6 | ICT | 625 nm | 3.2 μM | A549 cells and liver tissue | [62] |
| 11 | ICT | 490 nm | 75 nM | MCF-7 cells | [63] |
| 13 | TICT | 535 nm | 1.7 μM | HeLa Cells | [64] |
| 16 | TICT | 510 nm | 0.17 μM | HeLa cells | [65] |
| 18 | TICT | 537 nm | 0.15 μM | Ec1 cells | [66] |
| 20 | FRET | 587 nm | 40 nM | HeLa cells | [67] |
| 23 | FRET | 650 nm | 0.2 μM | HeLa cells and zebrafish | [68] |
| 26 | FRET | 665 nm | 0.5 μM | HepG-2 cells | [69] |
| 31 | PET | 643 nm | 62 nM | RAW 264.7 cells and zebrafish | [72] |
| 34 | PET | 650 nm | 40 nM | HepG2 and L02 cells | [73] |
| 37 | PET | 460 nm | 0.2 μM | HeLa cells and zebrafish | [74] |
| 40 | Azide reduction | 422 nm | 3.5 nM | HeLa cells and zebrafish | [75] |
| 43 | Azide reduction | 450 nm | 24.3 nM | HeLa cells | [76] |
| 47 | Azide reduction | 550 nm | 0.57 μM | HeLa cells | [77] |
2.1. Nucleophilic Addition to the Conjugated System for H2S Detection
Under the physiological condition of pH 7.6, H2S was deprotonated to HS−. This species was then able to be added to the conjugated system by way of nucleophilic attack onto the electrophilic center of the probe. In this way, cyanine dyes were able to detect H2S. Such a mechanism has four different modes of signal transduction. These include intramolecular charge transfer (ICT) [61,62,63], twisted intramolecular charge transfer [64,65,66] (TICT), fluorescence resonance energy transfer (FRET) [67,68,69], and photoinduced electron transfer (PET) [72,73,74]. Each of these processes involves the transfer of energy within the probe in the presence of the analyte. These mechanisms are discussed individually under the banner of H2S detection by way of nucleophilic addition to a conjugated system.
2.1.1. Intramolecular Charge Transfer (ICT)
This is the process of converting light energy into chemical energy. An example is photosynthesis, where plants use sunlight to carry out key charge separation processes in the production of food. The ICT process depends on the relationship between intensities of the donor and acceptor in the system. The donor resides at the HOMO energy level, and the acceptor resides at the LUMO. Moreover, the energy gap between the two can serve to insulate or conduct depending on the circumstances, which determines the electronic coupling degree between the two orbitals [61,62,63].
Synthesis and Mechanism of H2S Probes Based on ICT
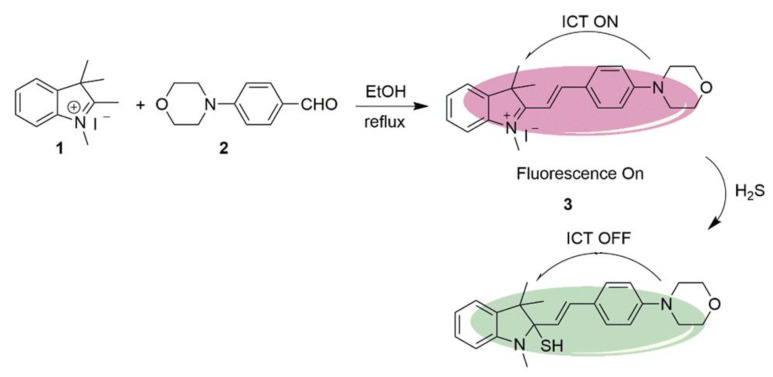
An example of a H2S probe performing on the basis of ICT is the morpholinostyryl probe 3, as illustrated in Scheme 2. It was synthesized by Li et al. following the reaction of indolium salt 1 with aldehyde 2. Under reflux in ethanol, a yield of 70% was achieved. The probe behaves as a switch, with fluorescence turning on and off in the absence and presence of H2S, respectively. This occurs because H2S, behaving as the nucleophile, attacks the indolium moiety to break conjugation. The result was a loss of fluorescence in the presence of the H2S at levels as low as 30 μM [61].
Scheme 2.
Synthetic route and detection mechanism of H2S probe 3.
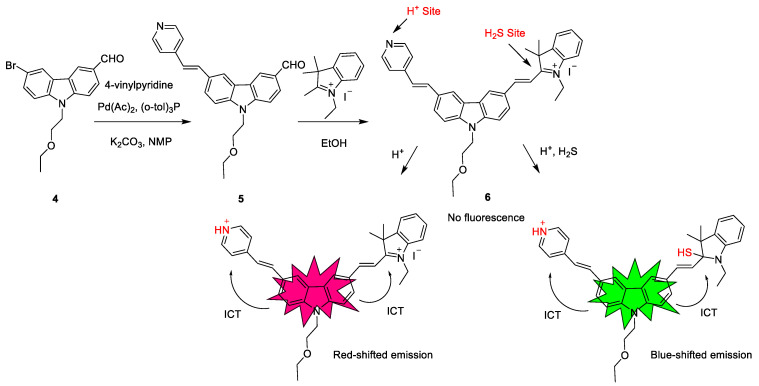
In the previous example of a H2S probe, the detection is indicated by a loss of fluorescence. A different probe was synthesized by Yong Liu et al. to have a hypsochromic shift upon binding with the H2S analyte. Scheme 3 shows the production of probe 6 following a two-step reaction. First, the bromine of compound 4 is substituted with 4-vinylpyridine under basic conditions using a Pd(Ac)2 catalyst to yield compound 5. Next, the conjugated system is extended following a Vilsmeier–Haack coupling with an indolium salt. The resulting probe 6 contains two separate sites where the fluorescence wavelength can be altered. Protonation can occur at the pyridine moiety to result in a bathochromic shift, and the indolium moiety can undergo nucleophilic attack in the presence of H2S to give a hypsochromic shift. As it is able to distinguish between H2S present in acidic versus nonacidic conditions, probe 6 can be useful in detecting the H2S analyte in different parts of the body. This is possible because the fluorescence wavelength can easily be measured by spectroscopy, and whichever shift is observed can indicate the environment in which the analyte was present. For instance, tumors are known to be more acidic than the surrounding healthy tissue while blood is normally slightly alkaline [62].
Scheme 3.
Synthetic route and detection mechanism of probe 6.
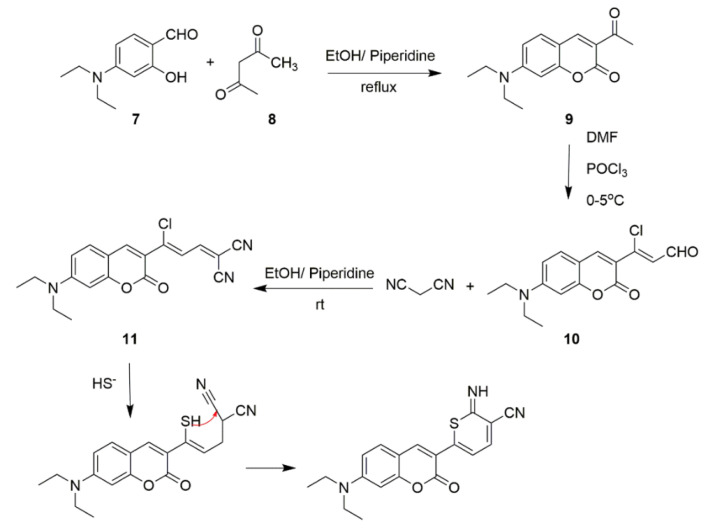
A novel on/off NIR fluorescent probe was developed by Fengzao Chen et al. which is unique in that it can detect H2S simultaneously by cyclization to form the six-member ring. Its synthesis and ICT mechanism are laid out in Scheme 4, involving three steps before being able to bind to H2S. The aldehyde derivative 7 and the 1,3-dicarbonyl compound 8 are refluxed under basic conditions to yield coumarin derivative 9. The resulting ketone group of 9 is formylated via a Vilsmeier–Haack coupling reaction with DMF in the presence of POCl3 to yield compound 10. Subsequent condensation with malononitrile produced compound 11 at a yield of 60%. This step is carried out at room temperature using EtOH and piperidine as solvents, and it results in the conjugated system being lengthened, as well as the addition of the strongly electron-donating cyano groups. This final product is then able to detect H2S under physiological conditions. The deprotonated species HS− substitutes the chloride to give a thiol which then undergoes a proton transfer with one of the cyano groups. A six-membered ring is formed, and this can be detected by the shift in fluorescence wavelength [63].
Scheme 4.
Synthetic route and detection mechanism of H2S probe 11.
Optical Properties of ICT H2S Probes
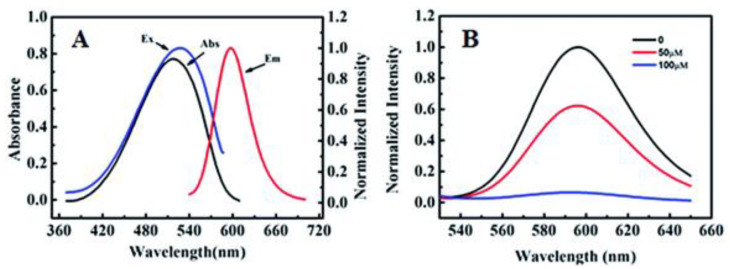
Referring to the on/off H2S probe synthesized by Li et al. in Scheme 2, probe 3 was shown to absorb light at a wavelength of 520 nm and fluoresce at 596 nm, as shown in Figure 1A. Its fluorescence intensity was then measured at 600 nm in the presence of H2S at varying concentrations. Figure 1B reveals that the signal of probe 3 was strongest with the analyte absent, but its signal was unobservable at a concentration of 100 μM of H2S. These results prove that probe 3 is a useful H2S sensor [61].
Figure 1.
(A) Absorption and fluorescence spectra of probe 3. (B) Fluorescence spectra of probe 3 (10 μM) in H2S at varying concentrations. Reprinted with permission from Ref. [61]. Copyright ©2017 Royal Society of Chemistry.
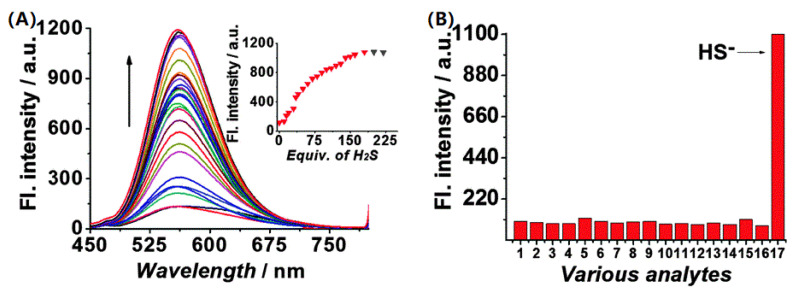
H2S probe 6 reported by Yong Liu et al. (Scheme 3), which displayed a bathochromic shift upon detection of the H2S analyte, was also found to exhibit spectral changes at varying pH of H2S. The absorption and fluorescence spectra of probe 6 at different pH values are shown in Figure 2A,B, respectively. Furthermore, probe 6 is highly sensitive to H2S under acidic conditions (Figure 2A). As presented in Figure 2B, probe 6 has good selectivity of H2S over various other sulfur-containing molecules such as SO42−, S2O32−, and cysteine [62].
Figure 2.
(A) Fluorescence spectra of probe 6 (10 μM) in pH 4.4 PBS buffer solution (containing 5% DMSO) with the addition of H2S. (B) Fluorescence responses of probe 6 at 405 nm in the presence of: 1. Probe 6; 2, Cl−; 3, K+; 4, Ca2+; 5, Mg2+; 6, GSH; 7, H2O2; 8, Hcy; 9, HSO3−; 10, I−; 11; Cys; 12, NO2−; 13, S2O32−; 14, SO32−; 15, SO42−; 16, Zn2+; 17, HS− [62]. Reprinted with permission from Ref. [62]. Copyright ©2016 Royal Society of Chemistry.
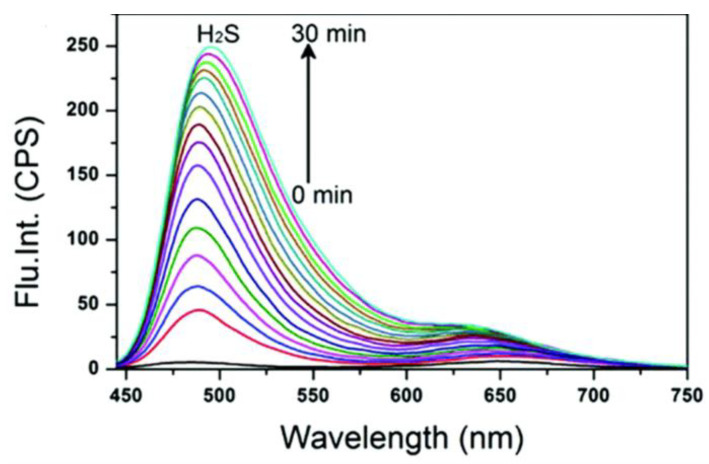
The third H2S probe operating on the ICT principle, probe 11 (Scheme 4), was also studied to undergo changes to its fluorescence spectra at 490 nm by Fengzao Chen et al., as shown in Figure 3. Intensity of fluorescence took 30 min to reach a plateau in the presence of H2S, at which point there was only marginal increase in signal strength with time [63].
Figure 3.
Time-dependent fluorescence spectral changes of probe 11. Reprinted with permission from Ref. [63]. Copyright ©2018 Royal Society of Chemistry.
The Application of H2S Probes Based on ICT
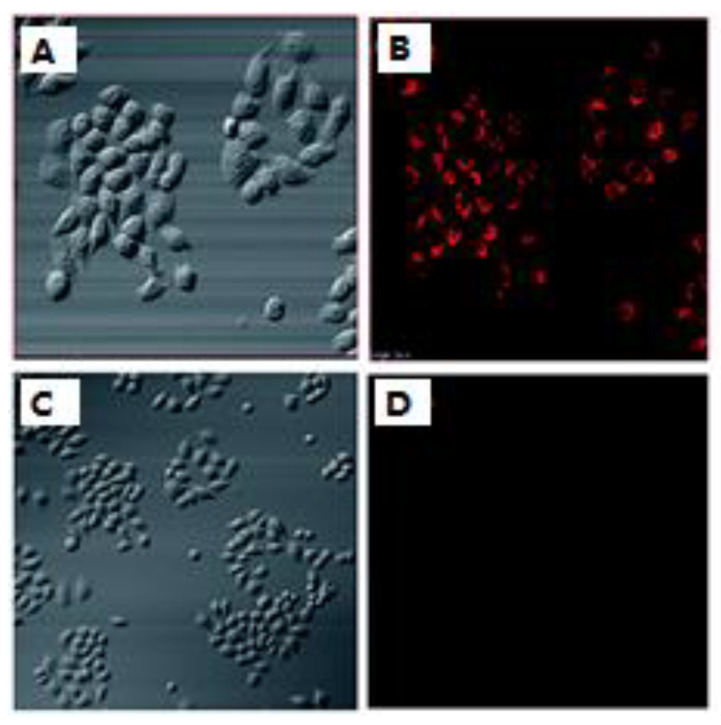
The immortalized cells of Henrietta Lacks, who died of advanced cancer in 1951, were used to further bolster the ability of probe 3 (Scheme 2) to detect H2S in living cells. This sensor penetrated the cell membrane as shown by the contrast between bright-field and fluorescence images of cells incubated with probe 3 (Figure 4A,B). Overlaying the bright-field and fluorescence images of cells treated with probe 3 verified this claim. Conversely, there was no visible fluorescence upon addition of H2S to the culture (Figure 4C,D). These images indicate that probe 3 could effectively penetrate the membrane and was selective toward H2S in living cells [61].
Figure 4.
(A) Bright-field images of cells treated with probe 3. (B) Bright-field images of cells preincubated with probe 3 and NaHS. (B,D) are fluorescence images of (A,C), respectively. Reprinted with permission from Ref. [61]. Copyright ©2017 Royal Society of Chemistry.
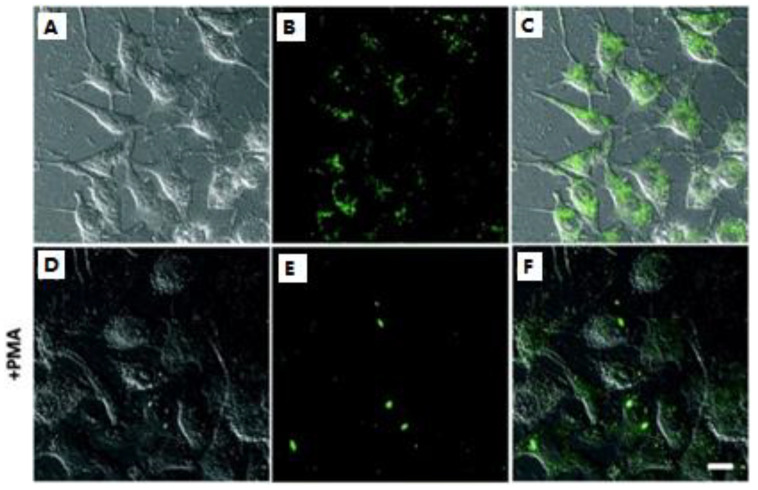
Probe 6 (Scheme 3) was used to detect endogenous H2S in the lysosomes of A549 cells. To highlight the probe’s ability to detect H2S, an assay was performed both with and without the presence of PMS (12-O-tetradecanoylphorbol 13-acetate, 4β,9α,12β,13α,20-pentahydroxytiglia-1,6-dien-3-one 12-tetradecanoate 13-acetate), which was used to reduce endogenous H2S levels. Figure 5 illustrates that probe 6 did indeed detect the analyte within the lysosomes of the A549 cells (A–C), but the signal was reduced upon the addition of the H2S inhibitor, PMA (D–F). The addition of the inhibitor serves to prove the probe’s selectivity toward H2S and not simply any sulfur-containing analyte. The study confirms the ability of probe 6 to detect endogenous H2S in the cell lysosome under the green channel [62].
Figure 5.
Fluorescence imaging of the endogenous H2S in the lysosomes: (A–C) the cells incubated with 5.0 μM probe 6 only; (D–F) the cells pretreated with PMA and then incubated with probe 6. (A,D) bright-field images; (B,E) fluorescence; (C,F) merged. Reprinted with permission from Ref. [62]. Copyright ©2016 Royal Society of Chemistry.
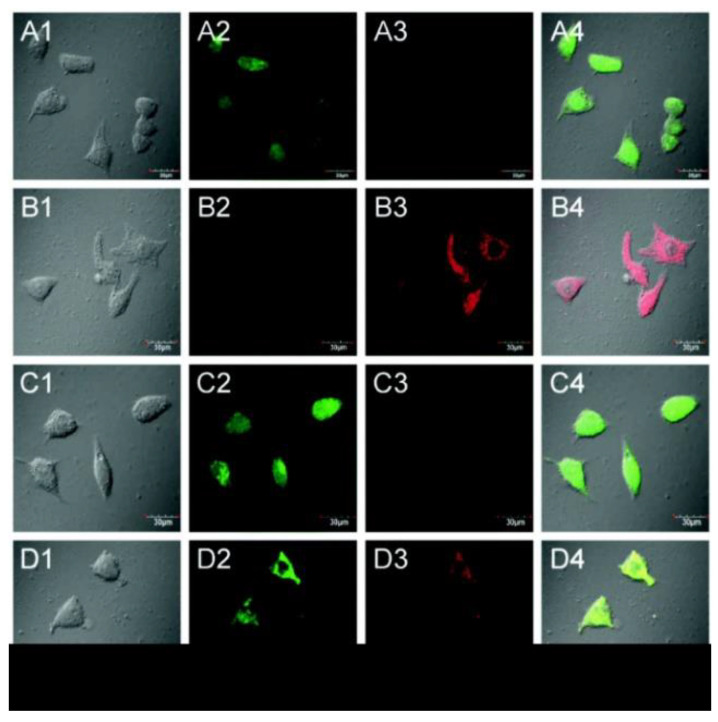
Probe 11 (Scheme 4) was used to detect H2S levels in MCF-7 cells. As shown in Figure 6, a strong fluorescence signal was observed in the green channel from 470–530 nm with H2S present (Figure 6(D2)), but hardly any was seen in the red channel from 620–680 nm (Figure 6(D3)). Upon addition of probe 11 following treatment with the H2S inhibitor NEM, only red-channel signals were seen (Figure 6(B4)). This means that, without H2S, probe 11 would show red channel signals. In the groups with supplemental H2S in addition to the inhibitor, the phenomenon was quite different; all others were only detectable in the green channel (Figure 6C,D). H2S causes a blue shift, and the signal is shown in the green channel. These results proved that probe 11 has use as an effective tool in detecting H2S in MCF-7 cells [63].
Figure 6.
(A) Cells incubated with only probe 11; (B) cells were preincubated with NEM and subsequently treated with probe 11; (C) cells pretreated with NEM followed by treatment with probe 11 and GSH; (D) cells pretreated with 0.6 mM NEM followed by probe 11 and then with H2S. Column 1, bright field; column 2, green channel; column 3, red channel; column 4, merged images of columns 1, 2, and 3. Reprinted with permission from Ref. [63]. Copyright ©2018 Royal Society of Chemistry.
2.1.2. Twisted Intramolecular Charge Transfer (TICT)
This is a process of electron transduction which is always linked by a single bond between donor and acceptor units. The twist of a single bond is an essential component of this process, unlike the ICT, which sees a lateral translation of electrons across a rigid structure. The TICT process occurs upon absorption of an electron. The excited molecular structure becomes twisted and then relaxes to the ground state, emitting light at a longer wavelength. Many TICT-based fluorescent probes are potential detectors for some small biological molecules [64,65,66].
Synthesis and Mechanism of H2S Probes Based on TICT
Mingguang Ren et al. synthesized the first H2S TICT probe 13 (Scheme 5) based on the BODIPY scaffold. Probe 13 was obtained by the reaction between compound 12 and the indolium salt under reflux in EtOH. The salt was condensed with the aldehyde group in compound 12 to form probe 13 at 60% yield. For this probe, the combination of the conjugated structure of indolium with the BODIPY group turned on the TICT process, which showed a strong fluorescence. In the presence of H2S, the indolium moiety underwent a nucleophilic attack, thereby quenching the TICT process. Probe 13 could detect the H2S levels in living cells [64].
Scheme 5.
Synthetic route and detection mechanism of probe 13.
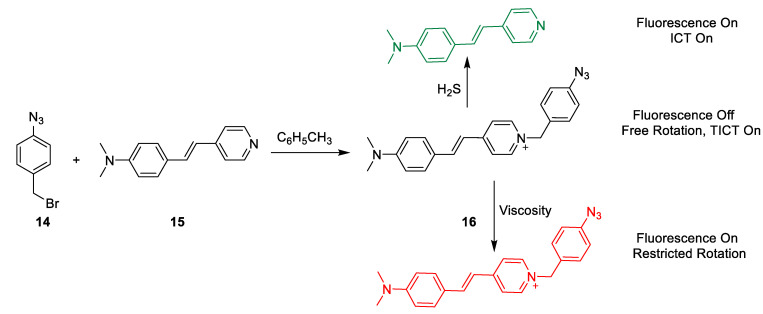
Songjiao Li et al. designed H2S probe 16 to monitor levels of H2S in cells (Scheme 6). This compound performs according to the TICT mechanism in the NIR region of the EM spectrum. Under reflux conditions in toluene, the pyridine ring of compound 15 is alkylated by the azide derivative 14 to produce probe 16 at a yield of 90% In the absence of the H2S analyte, probe 16 does not show a fluorescence signal due to the free rotation in the TICT state. Upon the addition of H2S, the pyridine undergoes nucleophilic attack, and the azide moiety is liberated. At this point, fluorescence was induced. In this way, probe 16 could target the mitochondrion and visualize H2S at different concentrations in HeLa cells [65].
Scheme 6.
Synthetic route and detection mechanism of probe 16.
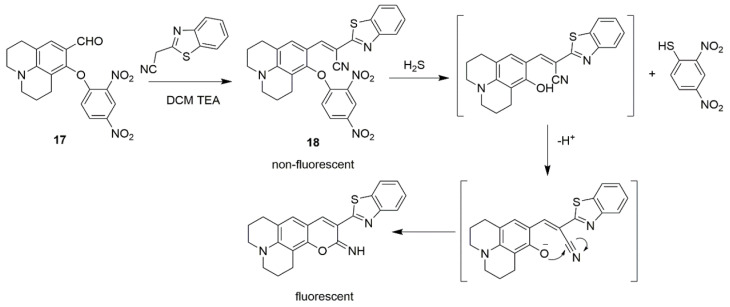
Yongru Zhang et al. designed the dinitrophenyl H2S fluorescent probe 18. Basic conditions facilitated the condensation of the benzothiazole derivative with the aldehyde of compound 17 to produce probe 18 in 12% yield. The mechanism via which H2S was sensed occurs via the analyte undergoing a nucleophilic aromatic substitution on the dinitrobenzene ring. In the process, 2,3-dinitrobenzothiol was liberated, and the cyano group of the intermediate was reduced to an imine (Scheme 7). The formation of a six-membered ring brought conjugation to the molecule, and this could be detected by spectroscopy. In this way, probe 18 could detect endogenous levels of H2S within living cells [66].
Scheme 7.
Synthetic route and detection mechanism of probe 18.
Optical Properties of H2S Probes Based on TICT
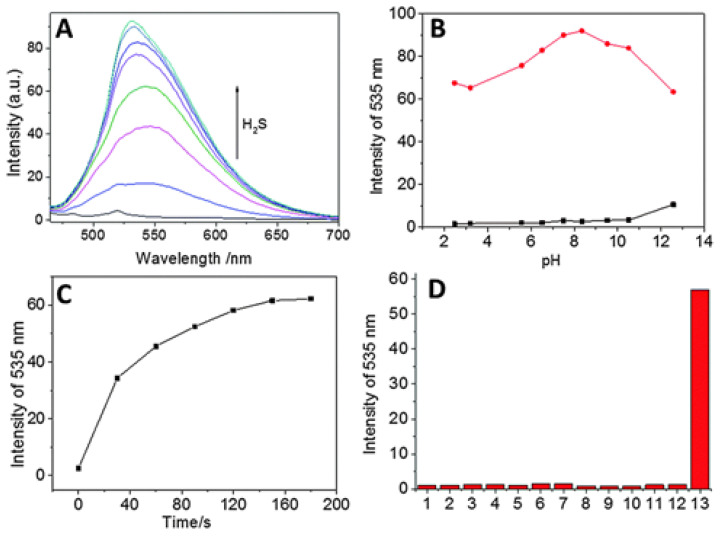
Mingguang Ren et al. investigated the optical properties of probe 13 in the presence of H2S (Scheme 5). A detection plateau was observed at 100 μM (Figure 7A). The fluorescence intensity of probe 13 was shown to be stable across a wide pH range (Figure 7B). As shown in Figure 7C, it took up to 3 min for a maximum detection of fluorescence to be detected. Probe 13 was reported to have high specificity to H2S, as supported by Figure 7D; signals were negligible for a dozen other analytes, such as cysteine, SO32−, and GSH. With these studies, it was proven that probe 13 has a high specificity, sensitivity, and selectivity toward H2S [64].
Figure 7.
(A) Fluorescence spectra of probe 13 treated with Na2S (0–100 μM); (B) fluorescence intensity of probe 13 in the absence (black) and presence (red) of Na2S, and at varying pH; (C) time course of fluorescence intensity of probe 13 in the presence of Na2S; (D) fluorescence intensities of probe 13 treated with various relevant analytes (1) probe only; (2) F−; (3) GSH; (4) H2O2; (5) Hcy; (6) I−; (7) Cys; (8) NO2−; (9) S2O32−; (10) SO32−; (11) HSO32−; (12) NO3−; (13) Na2S, in PBS buffer (pH 7.4, containing 50% DMF as a cosolvent). Reprinted with permission from Ref. [64]. Copyright ©2016 Royal Society of Chemistry.
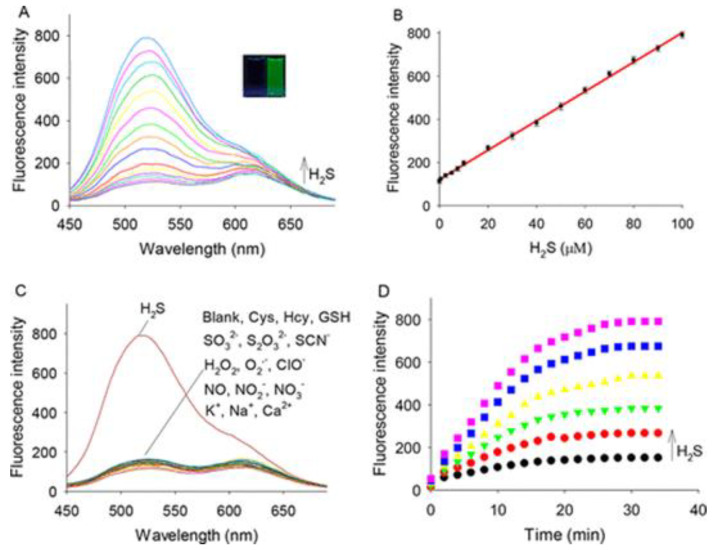
Songjiao Li et al. investigated the fluorescence response of probe 16 (Scheme 6) to H2S in PBS (Figure 8A). As shown in Figure 8B, the limit of detection was as low as 0.17 μM. As shown in Figure 8C, with various interference chemicals including H2O2, NO2−, and Ca2+, there was no obvious fluorescence change of probe 16, and, after 25 min, the fluorescence reached its maximum value (Figure 8D). These results suggest the probe 16 has high selectivity toward H2S [65].
Figure 8.
(A) Fluorescence spectra of probe 16; (B) fluorescence intensity versus H2S concentrations; (C) fluorescence response of probe 16 toward H2S, GSH, and other interference species; (D) time-dependent fluorescence intensity change of probe 16 at varied concentrations of H2S. Reprinted with permission from Ref. [65]. Copyright ©2018 American Chemical Society.
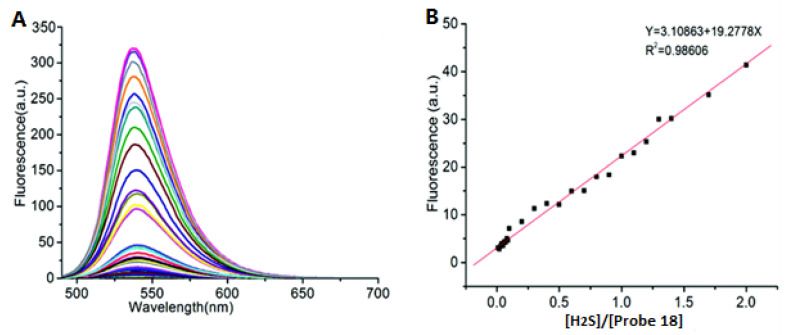
Yongru Zhang et al. examined the sensitivity of probe 18 (Scheme 7) toward H2S. Na2S was used for the source of H2S. As outlined in Figure 9A, in HEPES buffer, probe 18 responded to Na2S with different fluorescence signals at 537 nm, which indicated an excellent linear relationship (R2 = 0.9860) at 537 nm. Moreover, a detection limit of 0.15 μM H2S was reported for probe 18 (Figure 9B). These results showed that probe 18 was a good monitoring system for H2S [66].
Figure 9.
(A) Fluorescence spectra of probe 18 on the adjunction of Na2S in HEPES; (B) linear relationship between the fluorescence response at 537 nm and the concentration of Na2S in HEPES buffer. Reprinted with permission from Ref. [66]. Copyright ©2019 Royal Society of Chemistry.
Applications of H2S Probes Based on TICT
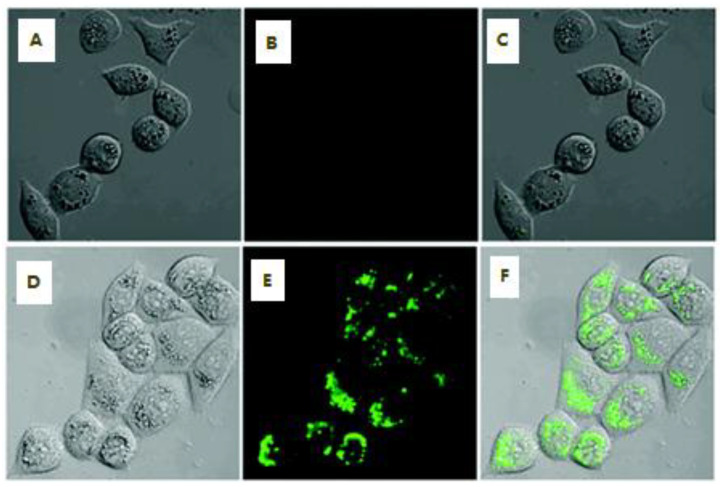
Probe 13 (Scheme 5) was used to detect H2S in HeLa cells. As shown in Figure 10B, a weak fluorescence signal was associated with the cells being only incubated with the probe. In contrast, after probe 18 was treated with Na2S for 30 min, the HeLa cells had strong fluorescence signals (Figure 10E). The overlaid image (Figure 10F) clearly showed the green fluorescence in the HeLa cells. These results prove the utility of probe 13 as a H2S sensor [64].
Figure 10.
Visualization of H2S within HeLa cells; (A) HeLa cells and probe 13, bright field; (B) cells and probe 13, fluorescence; (C) merged image of (A,B); (D) cells, probe 13, and Na2S, bright field; (E) cells, probe 13, and Na2S, fluorescence; (F) merged image of (D,E). Reprinted with permission from Ref. [64]. Copyright ©2016 Royal Society of Chemistry.
Probe 16 (Scheme 6) was used to image H2S in HeLa cells, as shown in Figure 11. There was only a weak fluorescence signal when HeLa cells treated by the probe alone (Figure 11A). With the addition of Na2S to the cells, the green fluorescence signal increased (Figure 11B). However, when the H2S inhibitor PAG was added, the fluorescence signal was weak again (Figure 11C). This indicates that probe 16 could be useful in monitoring exogenous H2S in living cells. In contrast, the use of cystine, which could induce the production of endogenous H2S, leads to an increase in green signal once more (Figure 11D). When PAG and cystine were added concurrently, the fluorescence intensity in the HeLa cells was weak. This was due to the inhibition of H2S (Figure 11E,F) [66].
Figure 11.
Fluorescence imaging of HeLa cells; (A) HeLa cells stained with probe 16; (B) HeLa cells stained with probe 16 and then treated with Na2S; (C) HeLa cells preincubated with PAG and then treated with probe 16; (D) HeLa cells stimulated with Cys and probe 16; (E) HeLa cells stimulated with Cys, PAG, and probe 16; (F) Intensities of (A–E). Reprinted with permission from Ref. [66]. Copyright ©2019 Royal Society of Chemistry.
2.1.3. Nucleophilic Addition Based on FRET
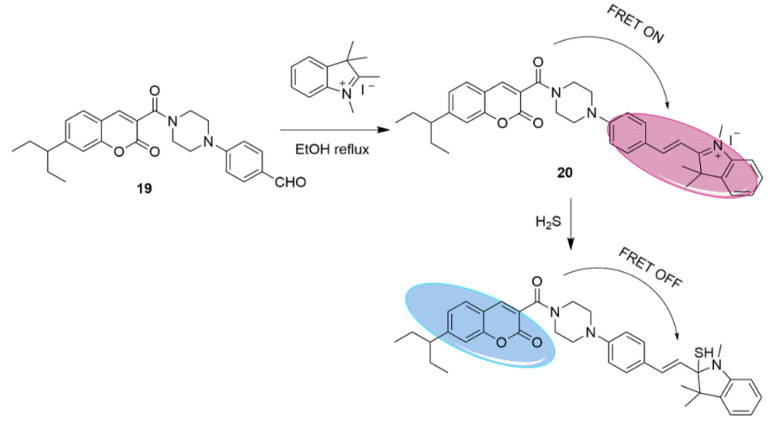
Fluorescence resonance energy transfer (FRET) occurs between an excited donor and an acceptor at the ground state. Donors emit in a shorter wavelength that overlaps with the acceptor’s absorbance. A nonradioactive energy transfer occurs, i.e., the FRET phenomenon, such that the fluorescence intensity of the donor is much lower than when it exists alone, while the fluorescence emitted by the acceptor is greatly enhanced. This energy transfer occurs without the appearance of a photon and results from long-range dipole–dipole interactions between the donor and acceptor. Fluorescence of excited species is quenched in the presence of the analyte (H2S), which transduces a signal [67,68,69]. As an example, in Scheme 8, the coumarin is excited and transfers energy to the indolium, which fluoresces. Upon H2S reacted with the indolium, the FRET process is interrupted, and the coumarin fluoresces.
Scheme 8.
Synthetic route and detection mechanism of Probe 20.
Synthesis of H2S Probes Based on FRET
Xiao Feng et al. synthesized an NIR fluorescent probe operating according to the FRET principle. The coumarin derivative 20 was obtained via a single-step condensation reaction (Scheme 8). The aldehyde of compound 19 was allowed to react with the N-methyl indolium salt under reflux to form a new carbon–carbon bond. A good yield of 70% was reported, and the induced conjugation provided a means of detection through spectroscopy. During the detection of H2S, the indolium moiety undergoes nucleophilic attack. Conjugation was lost, thereby quenching the FRET process. It was noted that, under a single-wavelength excitation, this probe could show different signal changes with the H2S concentration [67].
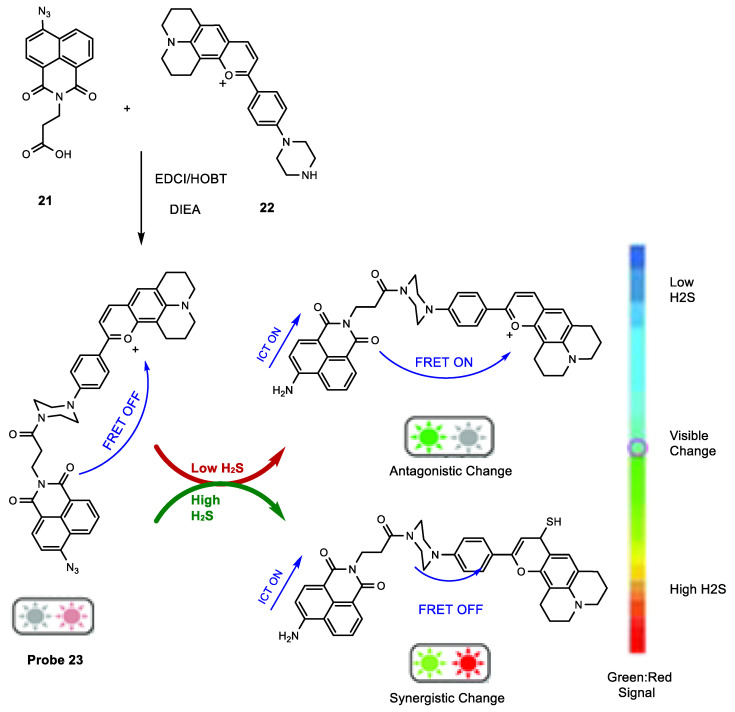
Yunzhen Yang et al. designed a ratiometric fluorescent probe working via both the ICT and the FRET mechanisms. Scheme 9 illustrates the coupling reaction between the carboxylic acid group of 21 and the secondary cyclic amine of 22 with EDCI, HOBT, and DIEA as coupling conditions. The new carbon–carbon bond resulted in probe 23 with a yield of 70%. In response to H2S, probe 23 could exhibit different signals depending on the concentration of the analyte. At higher concentrations, the azide group was reduced to a terminal amine whose lone pair contributed to the conjugated system. The ICT was activated, and this was revealed by a signal with more red character. However, at lower concentrations, FRET was the indicator, with a signal of more blue character [68].
Scheme 9.
Synthetic route and detection mechanism of probe 23.
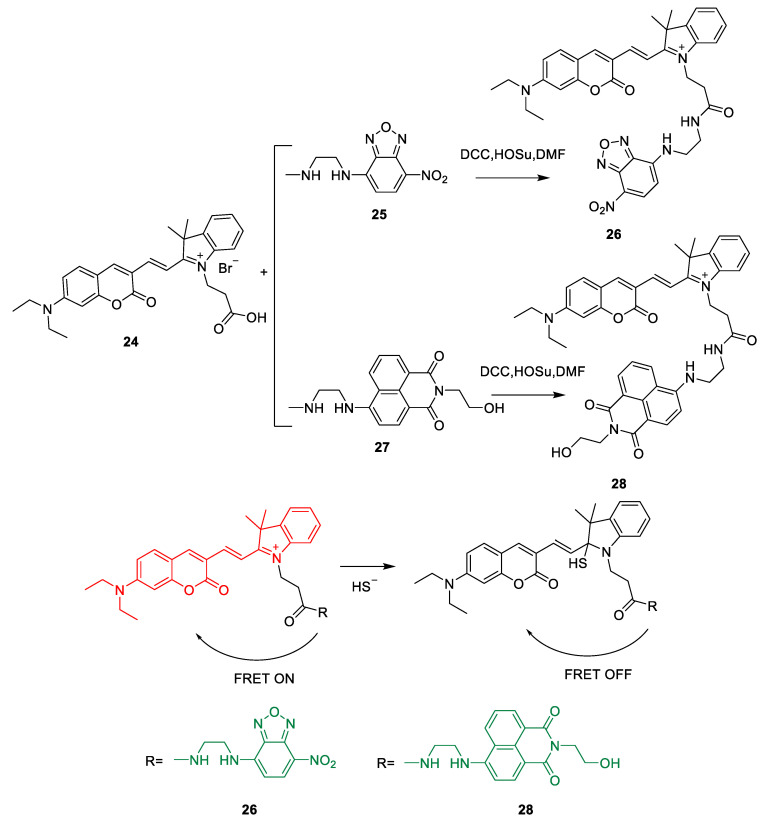
Yuming Zhang et al. developed two ratiometric fluorescent H2S sensors. Both were formed following condensation reactions between the carboxylic acid group of the coumarin derivative merocyanine fluorophore 24 and the amine groups of the two green-emitting fluorophores 25 and 27. Probes 26 and 28, respectively, were obtained as shown in Scheme 10 using DCC chemistry and a HOSu catalyst. Low yields of 35% were reported. In detection of the H2S analyte, the indolium moieties of the probes underwent nucleophilic attack by H2S. FRET was turned off in the process, thereby transducing the signal [69].
Scheme 10.
Synthetic route and detection mechanism of probe 26 and 28.
Optical Properties of H2S Probes Based on FRET
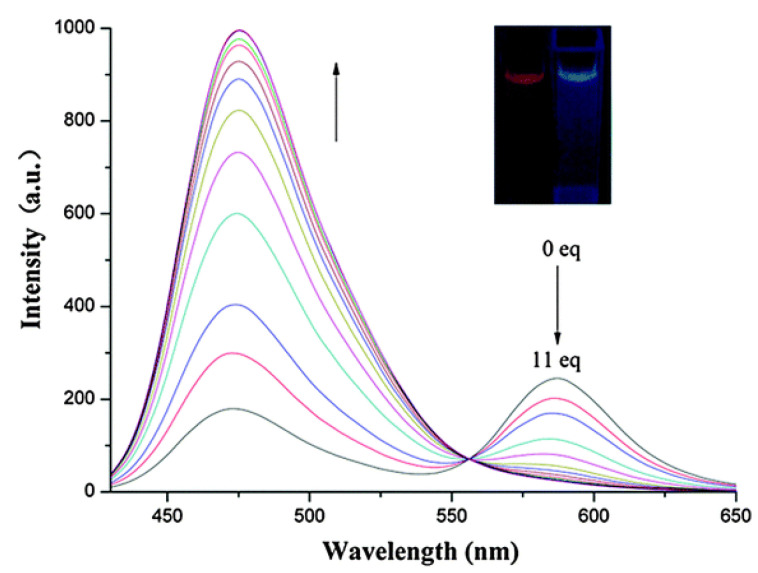
Xiao Feng et al. investigated the sensitivity of probe 20 (Scheme 8) for H2S. As shown in Figure 12, the fluorescence titration demonstrated that probe 20 had two distinct emission bands. Interestingly, as the concentration of H2S was increased, the ratio of these two peaks changed; the 587 nm signal became more intense while the 474 nm signal became less intense as H2S was added. The opposite was also found to be true; lower concentrations increased the lower wavelength signal and reduced the higher one. These findings prove that probe 20 could be potentially used to quantitatively determine the concentration of H2S in a sample [67].
Figure 12.
Fluorescence spectra of the probe 20 with the addition of Na2S in PBS buffer. Reprinted with permission from Ref. [67]. Copyright ©2016 Royal Society of Chemistry.
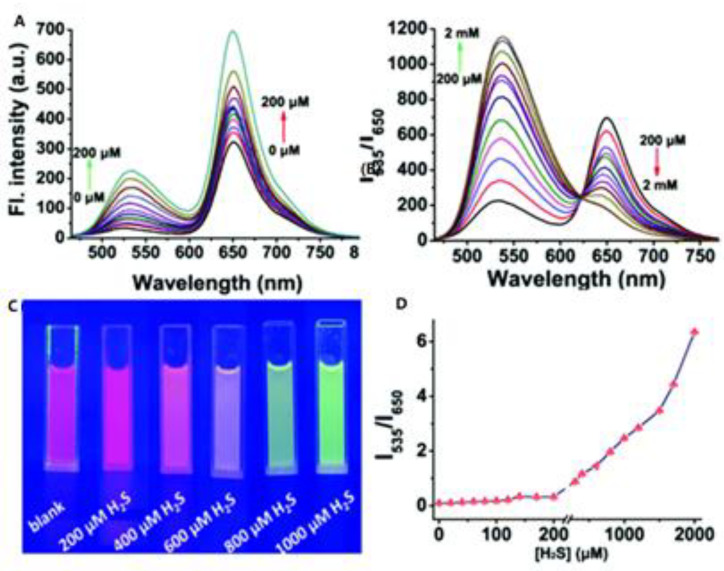
Yunzhen Yang et al. studied the optical properties of probe 23 (Scheme 9). The free probe was shown to emit at 650 nm (Figure 13A); however, with increasing concentrations of H2S, this peak at 650 nm decreased in favor of the emerging peak at 540 nm (Figure 13B). At concentrations below 200 uM, 650 nm was the major peak, whereas 550 nm was the major peak between a concentration of 200 uM and 2 mM. This phenomenon revealed an isosbestic point in Figure 13B at 620 nm. The color of emission varied depending on the concentration of H2S as illustrated in Figure 13C; more blue character was correlated to higher concentrations of the analyte. As shown in Figure 13D, concentrations of H2S below 200 μm gave peak ratios overwhelmingly favoring the peak at 650 nm. This agreed with the rest of the data because lower concentrations resulted in signals with redder intensity [68].
Figure 13.
(A) Fluorescence spectra of probe 23 with NaHS in phosphate buffer; (B) fluorescence spectra of probe 23 with NaHS in phosphate buffer; (C) color change of the chemosensor 23 solution; (D) ratio values of fluorescence intensity of probe 23 with NaHS. Reprinted with permission from Ref. [68]. Copyright ©2019 Royal Society of Chemistry.
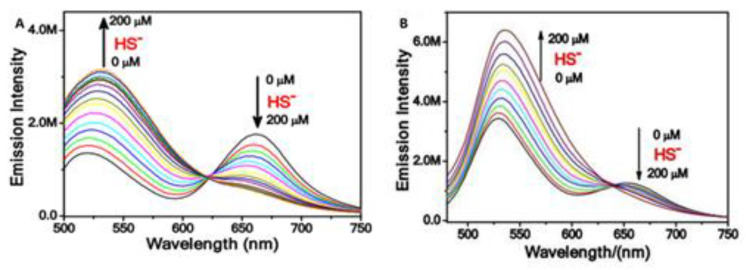
Yuming Zhang et al. studied the optical properties of probe 26 (Scheme 10) and its ability to sense H2S. As shown in Figure 14A, when HS− was added, the signal at 530 nm increased significantly, while the signal at 665 nm showed a decrease. Probe 28 was shown to behave similarly in Figure 14B. The isosbestic point resulted around 625 nm (Figure 14A) and 640 nm (Figure 14B). These results prove that both probes 26 and 28 could potentially serve as radiometric sensing probes for H2S.
Figure 14.
Emission spectra of probe 26 10 μM (A)and 28 (B) in PBS solution in the presence of different amounts of HS− excited at 475 nm. Reprinted with permission from Ref. [69]. Copyright ©2020 Royal Society of Chemistry.
The Application of H2S Based on FRET Probes
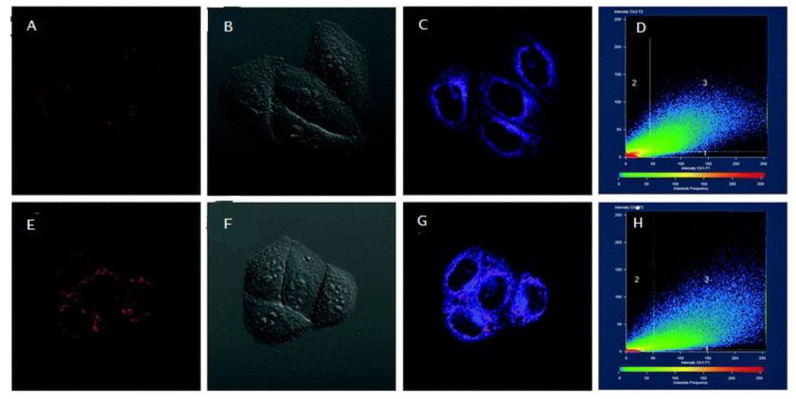
Probe 20, the first mentioned sensor operating by FRET, was used to detect H2S in HeLa cells (Scheme 8). Figure 15 shows the probe colocalization in the cells both with (Figure 15E–H) and without (Figure 15A–D) the H2S analyte. When H2S was added, probe 20 was found to preferentially distribute in the mitochondrion, where it remained even after sensing for 1 h. This quality is displayed by the merged images of the cells under bright-field and deep-red wavelengths (Figure 15C,G). Furthermore, the probe’s photostability was evaluated by the HeLa cell images which were exposed for different lengths of time. Coefficients for quantitation of colocalization with the cells were reported as 0.924 and 0.891 (Figure 15D,H). These images suggest that probe 20 has use as a ratiometric tracker of H2S levels within the mitochondrion [67].
Figure 15.
(A–D) Probe 20 with Mito Tracker Deep Red; (E–H) HeLa cells treated with Na2S for 1 h, followed by probe 20 for 1 h, and then incubated with Mito Tracker for 0.5 h; (A,E) HeLa cells with probe 20, bright field; (B,F) MTDR; (C,G) merged image; (D,H) colocalization studies. Reprinted with permission from Ref. [67]. Copyright ©2016 Royal Society of Chemistry.
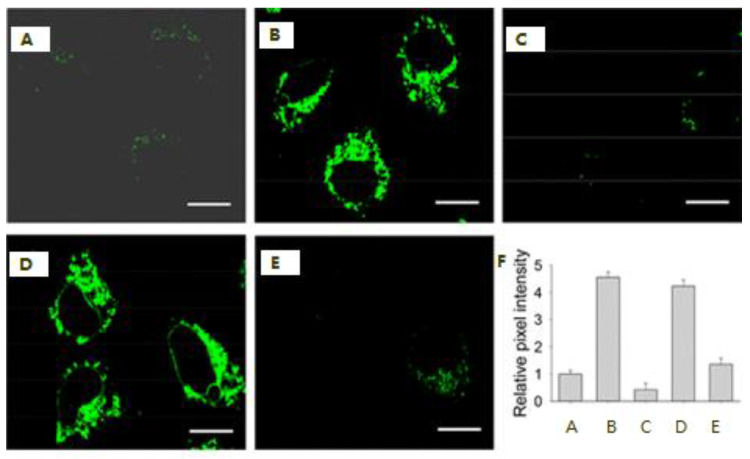
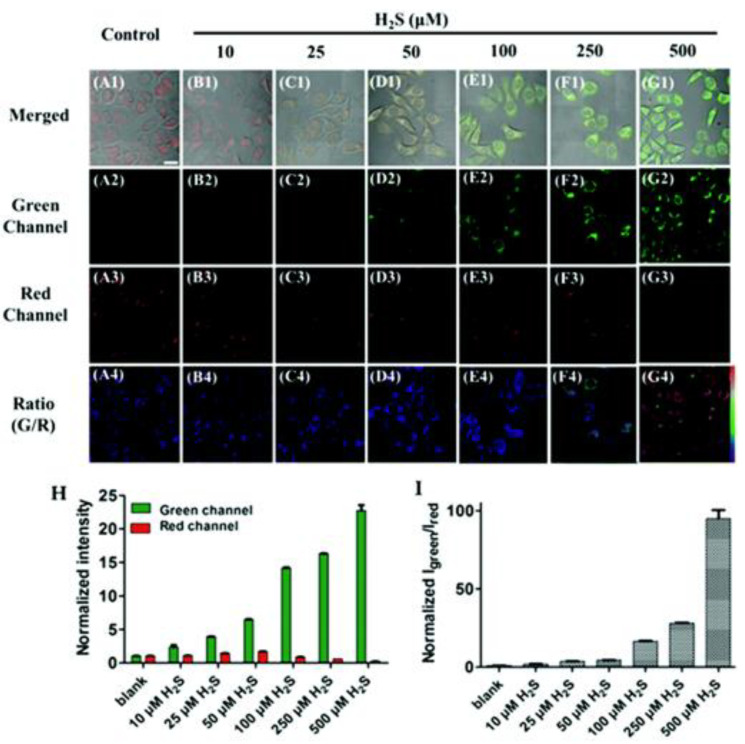
Probe 23 (Scheme 9) was also used to detect H2S in the HeLa cells; however, unlike probe 20, this compound was able to distinguish between high and low levels of concentration, with a cutoff at 50 μM (Figure 16I). In the control group, only weak fluorescence was shown (Figure 16A). As shown in Figure 16B–D, the intensities of fluorescence signals increased in both the green and the red channels at concentrations from 10 to 50 µM. As the concentration of NaHS was increased from 100 to 500 μM, the emission in the green channel maintained this enhancement (Figure 16(E2,F2,G2)); meanwhile, the emission in the red channel was weakened conspicuously (Figure 16(E3,F3,G3)). The ratios between the two signals were marked by a significant increase (Figure 16E–G). As shown in Figure 16H, the normalized fluorescence intensity of the green and red channels first exhibited a synergistic change (increased together) and then an antagonistic change (green channel increased while red channel decreased). Moreover, as shown in Figure 16I, the ratio of the signals first exhibited a slow increase; then, in the high range of the H2S concentrations, it increased significantly, which could help in identifying the cutoff point [68].
Figure 16.
(A) Confocal fluorescence images of the chemosensor probe 23 responding to exogenous H2S in living cells. HeLa cells incubated with the chemosensor probe 23, followed by treatment with NaHS; (H) normalized average fluorescence intensity of the green and red channels in (A–G); (I) normalized ratio of the fluorescence signals from the green channel and red channel in the panels (A4–G4). Reprinted with permission from Ref. [68]. Copyright ©2019 Royal Society of Chemistry.
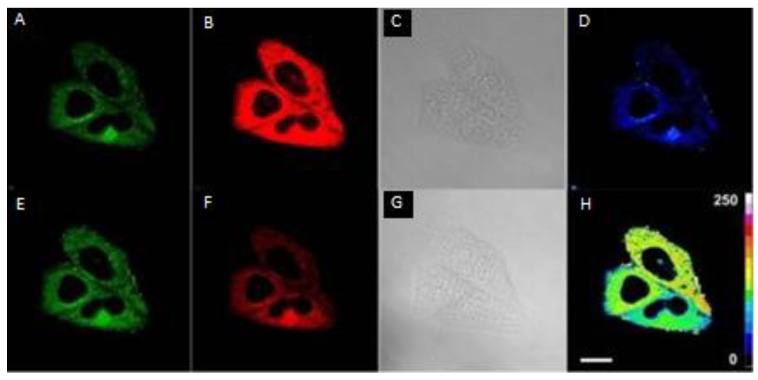
The third FRET-based H2S probe, 26, was used to detect intracellular levels of the H2S analyte (Scheme 10). In Figure 17A, the green channel shows medium-intensity fluorescence while Figure 17B shows the red channel with strong emission. The combinatory image of Figure 17D indicates low intracellular H2S level in HepG-2 cells. When the cells were treated with NaHS for 30 min, the green channel was increased (Figure 17E), while the red channel was significantly reduced (Figure 17F), resulting in enhancement of the ratio image (Figure 17H). These results showed that probe 26 could detect the intracellular H2S [69].
Figure 17.
Confocal fluorescent microscopic images of probe 26 stained HepG-2 cells in the absence (A–D) and presence (E–H) of NaHS; (A,E) green channel; (B,F) red channel; (C,G) bright-field images; (D,H) pseudo-color ratio images obtained from green channel and red channel. Reprinted with permission from Ref. [69]. Copyright ©2020 Royal Society of Chemistry.
2.1.4. Photoinduced Electron Transfer (PET)
In PET fluorescent molecular probes, there is a photoinduced electron transfer between the fluorophore and the acceptor unit, which has a very strong quenching effect on fluorescence; usually, electrons are transferred from the donor to the excited fluorophore. Therefore, before binding to the analyte, the probe does not emit fluorescence or the fluorescence is very weak. Once the receptor is bound to the analyte, the photoinduced electron transfer is inhibited, which causes the fluorophore to emit fluorescence [72,73,74].
Synthesis and Mechanism of H2S Probes Based on PET
Hanchuang Zhu et al. designed probe 31 according to the PET mechanism (Scheme 11). The chloro substituent of compound 30 was displaced under basic conditions, and its adjacent carbon was attacked by the hydroxy group of compound 29. The resulting probe 31 served as the H2S sensor, and it achieved a yield of 70%. In the presence of H2S, nucleophilic attack occurred at the C–O bond para to the nitro group. As a result, probe 29 was formed again along with a thiol derivative of compound 32. The PET was turned off in the process, and the H2S analyte was detected [72].
Scheme 11.
Synthetic route and detection mechanism of probe 31.
Similar to the previous example, Jinshuai Lan et al. also produced an NIR probe capable of detecting H2S by PET (Scheme 12). Probe 34 was obtained through a coupling reaction between the chloro substituent of compound 30 and the hydroxyl group of compound 33. This reaction produced probe 34 with a yield of 50%. In the presence of the H2S analyte, the NBD C–O bond was cleaved as indicated in Scheme 12, and the PET process was turned off [73].
Scheme 12.
Synthetic route and detection mechanism of probe 34.
Xinying Jing et al. developed a novel H2S probe 37 based on PET mechanism. Using a different approach from the previous two examples, the hydroxyl group of compound 35 reacted with the sulfonyl chloride group of compound 36 under basic conditions (Scheme 13). This coupling reaction produced compound 37 with a yield of 40%. The C–O bond of probe 37 underwent a nucleophilic attack by the H2S analyte, resulting in its cleavage. A species identical to staring material 35 and a thiol derivative of 36 were left as products. This reduction in conjugation quenches the PET, allowing for a signal to be detected [74].
Scheme 13.
Synthetic route and detection mechanism of probe 37.
Optical Properties of H2S Based on PET Probes
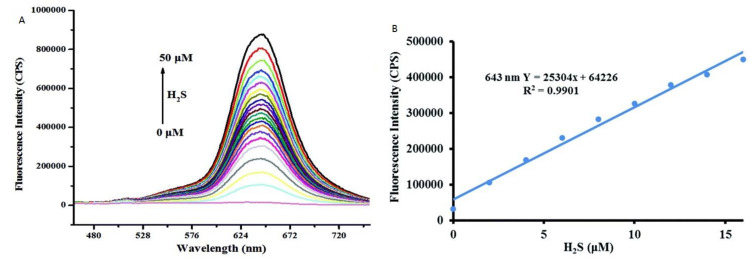
The optical properties of H2S probe 31 (Scheme 11) were summarized by Hanchuang Zhu et al. as shown in Figure 18. Compound 31 displayed a fluorescence wavelength at 643 nm upon addition of H2S up to 50 μM (Figure 18A), demonstrating a high sensitivity toward the analyte. The definite linear relationship between the concentration of H2S and fluorescence intensity indicated that H2S could be detected accurately in levels as low as 6.2 × 10⁻⁸ mol·L−1 (Figure 18B). These results indicate that probe 31 has potential as a H2S sensor and deserves further research [72].
Figure 18.
(A) Concentration-dependent fluorescence of probe 31 in the presence of H2S; (B) linear relationship between fluorescence intensities and biothiols. Reprinted with permission from Ref. [72]. Copyright ©2019 Royal Society of Chemistry.
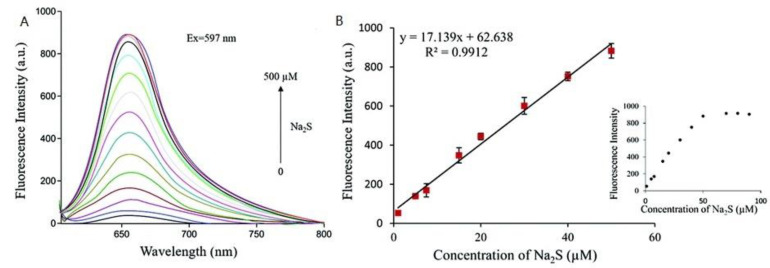
Jinshuai Lan et al. presented the optical properties of probe 34 (Scheme 12; Figure 19A). The fluorescence signal at 650 nm increased as the concentration of Na2S increased from 0 to 500 μm. As such, a distinct linear relationship was reported between the concentration of the H2S analyte and the fluorescence intensity. The best fit line was used to report that S2− concentrations under 60 μm could be accurately detected by probe 34 (Figure 19B) [73].
Figure 19.
Fluorescence spectra changes of the probe 34 upon addition of increasing amount of Na2S. Reprinted with permission from Ref. [73]. Copyright ©2019 Royal Society of Chemistry.
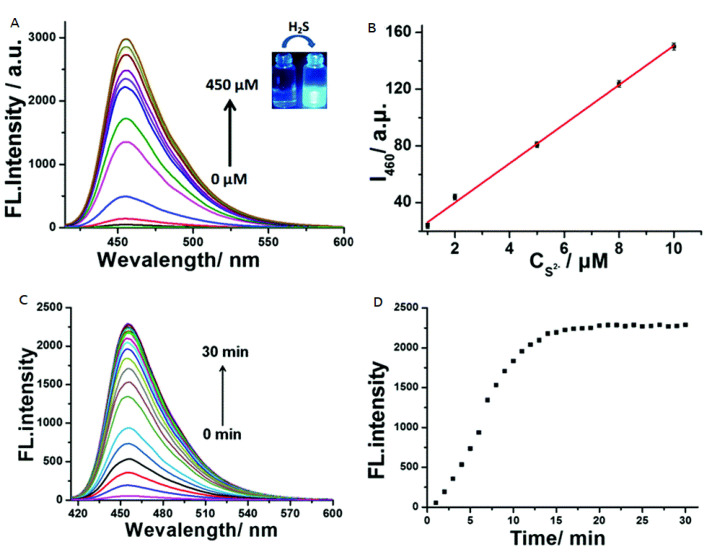
The optical properties of probe 37 in response to H2S (Scheme 13) were presented by Xinying Jing et al. in Figure 20A. Although the free probe did fluoresce weakly at 460 nm, this signal increased significantly upon addition of the H2S analyte. The strong linear relationship between the concentration of S2− and fluorescence intensity at 460 nm (Figure 20B) suggests that the limit of detection of the probe could be as low as 2.07 × 10⁻⁷ M. As shown in Figure 20C, D, the fluorescence signal approached its maximum intensity after 15 min [74].
Figure 20.
(A) Fluorescence spectra of the probe 37 in aqueous buffer; (B) linear relationship between the concentration of H2S and the fluorescence intensity; (C) fluorescence spectral changes of probe 37 with H2S; (D) Time–fluorescence intensity curve of probe 37 in the presence of H2S in buffer. Reprinted with permission from Ref. [74]. Copyright ©2019 Royal Society of Chemistry.
Applications of H2S PET Probes
Zebrafish were used as living models to demonstrate the biological applications of probe 31 (Scheme 11). As shown in Figure 21A, when the zebrafish were only incubated with probe 31, the images showed fluorescence in the green and red channels due to inherent biothiols within the cells. After treatment with the probe plus N-ethylmaleimide (NEM), a scavenger of biothiols, the zebrafish showed no fluorescence signal in either the green or the red channel (Figure 21B). Lastly, H2S and probe 31 were added (Figure 21C), which resulted in red and green fluorescence signals, as seen in Figure 21A. This strongly supports the potential use of probe 31 to detect both intracellular and extracellular H2S in zebrafish. Future research might discover applications of this compounds in other animal models [72].
Figure 21.
Zebrafish imaging: (A) zebrafish treated with probe 31; (B) zebrafish preconditioned with NEM treated with probe 31; (C) NEM-pretreated zebrafish treated with H2S then treated with probe 31. Reprinted with permission from Ref. [72]. Copyright ©2019 Royal Society of Chemistry.
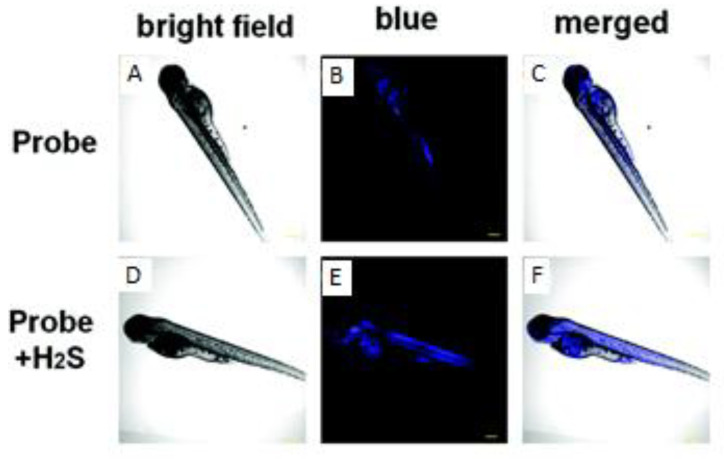
The biological applications of probe 37 (Scheme 13) were also demonstrated using zebrafish (Figure 22). Half an hour after being treated with only probe 37, a fluorescence signal was seen, albeit dim, but this was solely due to intracellular biothiols (Figure 22B). Upon the addition of Na2S at 100 μM, the blue fluorescence was enhanced significantly by 20 min (Figure 22E). This proves that probe 37 is useful in detecting H2S in a living organism [74].
Figure 22.
Fluorescence imaging of H2S by the probe 37 in zebrafish; (A–C) zebrafish were treated with the probe 37 solely; (D–F) zebrafish were treated with probe 37 and then incubated with H2S. (A,D) Bright-field images; (B,E) fluorescence images from the blue channel. Reprinted with permission from Ref. [74]. Copyright ©2019 Royal Society of Chemistry.
2.2. H2S Probes Based on Azide Group Reduction
In addition to nucleophilic addition, the reduction of azide groups is also a useful method for detecting H2S [75,76,77,78,79,80]. Typically, this involves a unit of hydrogen sulfide attacking an azide and reducing it to an amine via a reduction reaction, as opposed to nucleophilic attack of the H2S analyte to quench the fluorescence reaction. In the process, the overall electron distribution of the probe is altered, which can lead to an increase in fluorescence under certain conditions. These probes have been applied for both in vivo and in vitro testing by chemists to target the lysosomes and mitochondria of cells [79,80].
2.2.1. Synthesis and Detection Mechanism of H2S Probes Based on Azide Group Reduction
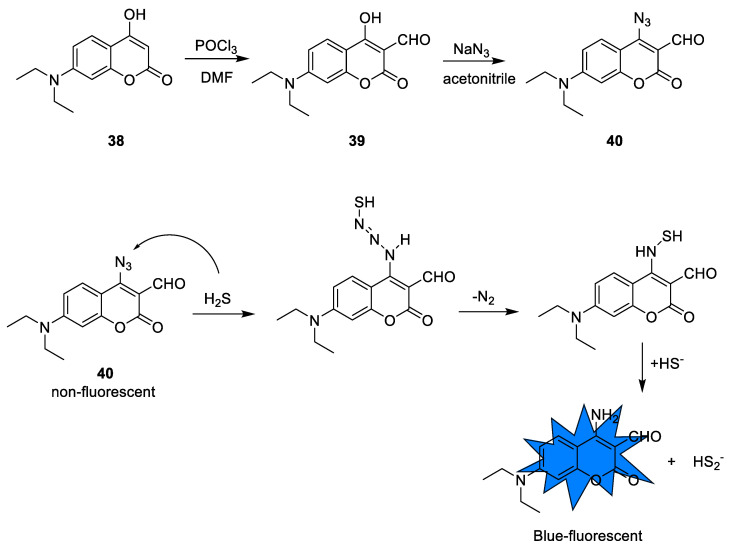
One example of an NIR fluorescent H2S probe operating via azide reduction is compound 40 (Scheme 14), which was reported by Qian Fang et al. The synthesis of probe 40 is shown in Scheme 14. Vilsmeier–Haack formylation of coumarin derivative 38 using phosphoryl chloride produced compound 39. Subsequent substitution of the hydroxyl group with sodium azide yielded probe 40 at 70%. In the presence of H2S, the azide underwent nucleophilic attack. The thioazide intermediate readily released a unit of nitrogen gas, and the resulting amine was protonated to make the molecule strongly fluorescent [75].
Scheme 14.
Synthetic route and detection mechanism of probe 40.
Nithya Velusamy et al. reported a separate on/off probe, compound 43, which could monitor H2S in living cells. With HATU and DiPEA in THF as coupling conditions, the carboxylic acid of compound 41 reacted with the terminal amine of compound 42 to form probe 43 at a yield of 40% (Scheme 15). In the presence of H2S, the azido group was reduced to an amino group, thereby transducing a signal in the blue region upon fluorescence [76].
Scheme 15.
Synthetic route and detection mechanism of probe 43.
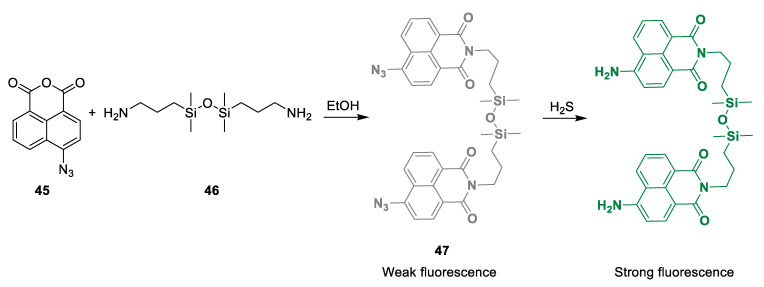
A sort of H2S double probe was produced by Xiaoni Wang et al. Probe 47 comprised two probe moieties linked by a Si–O–Si bridge. Compounds 45 and 46 were condensed in EtOH to form compound 47 with a 70% yield. A strong green fluorescence signal was observed when the azido groups of probe 47 (Scheme 16) were attacked by H2S and reduced to amino groups [77].
Scheme 16.
Synthetic route and detection mechanism of probe 47.
2.2.2. Optical Properties of Probes Based on Azide Group Reduction
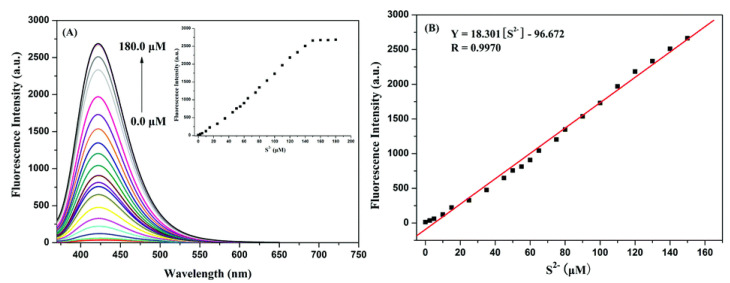
The probe developed by Qian Fang et al. (Scheme 14) was investigated, and its optical properties were determined. Figure 23A shows that the fluorescence signal at 422 nm increased conspicuously while the concentration of H2S was raised to 180 μM. Manipulation of the fluorescence spectra provided a definite linear relationship between the fluorescence intensity and the concentration of Na2S [75].
Figure 23.
(A) Concentration-dependent fluorescence spectroscopy of probe 40 with Na2S; (B) linear correlation of (A). Reprinted with permission from Ref. [75]. Copyright ©2019 Royal Society of Chemistry.
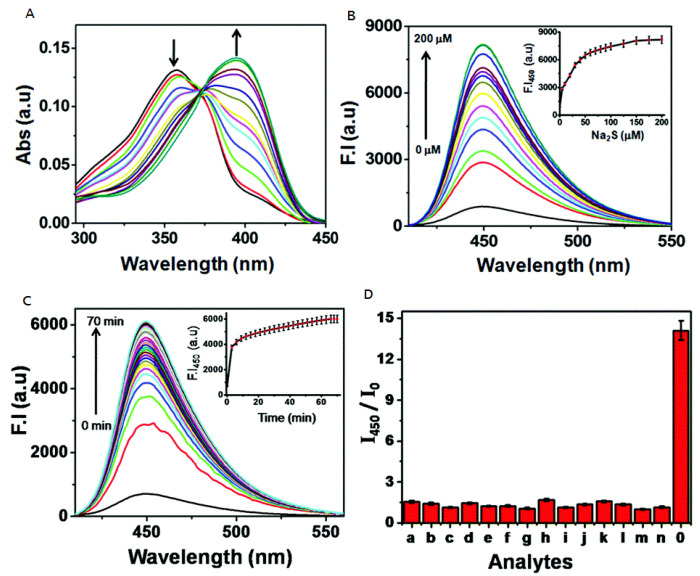
Nithya Velusamy et al. reported the optical properties of probe 43 (Scheme 15; Figure 24). Absorption spectra showed a bathochromic shift as concentration of the H2S analyte was increased (Figure 24A), and fluorescence spectra indicated that the detection limit was as low as 10 μM (Figure 24B). As shown in Figure 24C, the fluorescence intensity reached a plateau after 70 min. Many sulfur-containing biomarkers were added to the probe, but only Na2S produced a strong signal (Figure 24D). These data show that probe 40 was very useful as a H2S probe because of its high selectivity and sensitivity [76].
Figure 24.
(A) UV/Vis absorption and (B) fluorescence spectra of probe 43; (C) fluorescence change of probe 43 with Na2S; (D) fluorescence responses of probe 43 in the presence of various biologically important analytes: (a) cysteine (Cys), (b) H2O2, (c) NaNO2, (d) Cu(OAc)2, (e) Zn(OAc)2, (f) FeSO4, (g) FeCl3, (h) Na2CO3, (i) GSH, (j) NO, (k) Na2S2O3, (l) K2S5, and (m) N2S4. Reprinted with permission from Ref. [76]. Copyright ©2017 Royal Society of Chemistry.
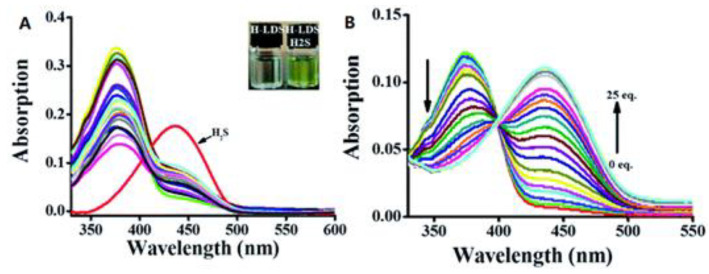
Figure 25 illustrates the optical properties of probe 47 (Scheme 16) as investigated by Xiaoni Wang et al. Figure 25A indicates a strong response to the addition of H2S and no response to other selected bioanalytes such as cysteine, glutamine, and glycine. The shift in absorption wavelength from 375 to 440 nm could even be detected by the naked eye. Increasing the concentration of H2S from 0 eq. to 25 eq. (equivalent volume of the probe), the absorption intensity of the peak at 375 nm gave way to another at 440 nm (Figure 25B). The isosbestic point shown in Figure 25B was around 400 nm. This selectivity shows that probe 47 has potential to be used as a H2S sensor [77].
Figure 25.
(A) Absorption spectra of probe 47 (10 μM) in the present of different ions (Cys, Glu, Gly, NaBr, NaCl, NaClO, NaCNS, NaF, BaCl2, CaCl2, CoCl2, CuCl2, FeCl3, MgCl2, NiSO4 ZnSO4, and SnCl2); (B) absorption spectra of probe 47 (10 μM) in aqueous solution upon addition of different amounts of H2S. Reprinted with permission from Ref. [77]. Copyright ©2020 Royal Society of Chemistry.
2.2.3. The Application of H2S Probe Based on Azide Group Reduction
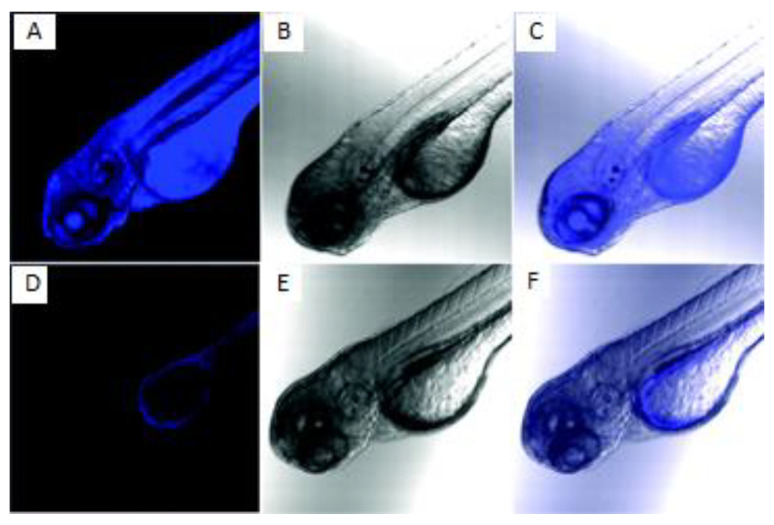
Compound 40 (Scheme 14) was used to detect H2S in living zebrafish. Following the treatment with probe 40 only, weak fluorescence was seen. This was solely due to the H2S which would normally be found within cells (Figure 26D,F). However, after adding H2S and incubating with probe 40 for another 30 min, a strong blue fluorescence signal was observed (Figure 26A,C). These results show that probe 40 can be useful to detect H2S in living zebrafish [75].
Figure 26.
Fluorescence (left column), bright field (middle column) and merged (right column) images of 3-day old zebrafish. Top row: zebrafish incubated with probe 40 for 30 min and then treated with Na2S for 30 min. Bottom row: zebrafish incubated with probe 40 for 30 min. Reprinted with permission from Ref. [75]. Copyright ©2019 Royal Society of Chemistry.
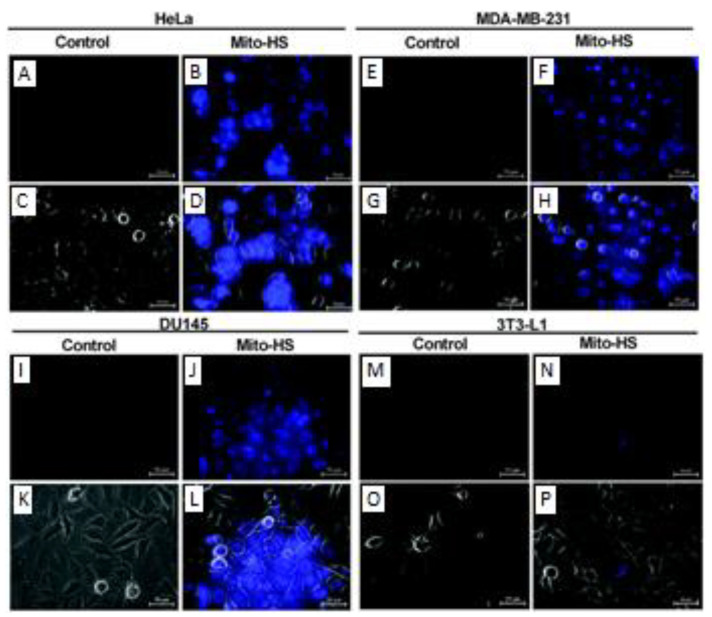
The presence of H2S was detected in four different cell lines by probe 43 (Scheme 15). HeLa (Figure 27A–D), MDA-MB-231 (E–H), DU145 (I–L), and 3T3-L1 cells (M–P) were all used to demonstrate this ability. As shown in all control groups, the fluorescence signals were all very weak without the probe present. This is because endogenous H2S levels are insufficient to elicit a signal. However, adding H2S increased the signal dramatically in most cases (Figure 27D,H,L). The 3T3-L1 cell line displayed the last pronounced response to H2S by probe 43 (Figure 27P). There is strong evidence that probe 43 is a useful probe for H2S in living cells [76].
Figure 27.
Fluorescence microscopy images of untreated HeLa (A), MDA-MB-231 (E), DU145 (I), and 3T3-L1 (M) cells and (B,F,J,N) the same cells, respectively, treated with probe 43 (5 μM). (C,D,G,H) and (K,L,O,P) are overlays of DIC bright-field images with the corresponding fluorescence images. Reprinted with permission from Ref. [76]. Copyright ©2017 Royal Society of Chemistry.
Another compound was investigated as a potential sensor for H2S in HeLa cells. Probe 47 (Scheme 16) displayed only weak fluorescence intensity within the cells by themselves (Figure 28(A1–3)). However, when the cells were treated with H2S, an obvious green fluorescence was seen (Figure 28(A4–9)). Varying concentrations of H2S were used, and their quantitative fluorescence intensities are plotted in Figure 28B. Together, this study shows that probe 47 has potential in detecting elevated levels of H2S within HeLa cells [77].
Figure 28.
Confocal microscopy images of exogenous H2S in living cells using probe 47; (A) (1–3) The fluorescence images of probe 47 in HeLa cells; (4–6) probe 47 treated with H2S; (B) analysis of the quantitative fluorescence intensity in (A) using Image software. Reprinted with permission from Ref. [77]. Copyright ©2020 Royal Society of Chemistry.
3. Summary and Outlook
Hydrogen sulfide is one of the most important gases in living organisms, and any abnormal changes in the concentration of it in vivo have been associated with many kinds of diseases [81]. Therefore, the development of highly sensitive H2S probes for use in living cells has become an important goal for research groups all around the world. Chemists have developed an assortment of on/off sensors which can be visualized with readily available NIR cameras. In this review, we exhibited many hydrogen sulfide probes based on several detection mechanisms, discussed their optical properties, and provided examples of their biological applications. In summary, most of the characteristic absorption peaks of fluorescent probes were in the visible and near-infrared range. The probes have exhibited promising, applicable prospects both in vivo and in vitro. These probes show excellent characteristics, such as good selectivity, low toxicity, and high sensitivity.
The diverse roles played by H2S in the body provide myriad avenues of scientific discovery. Already, it has been demonstrated that H2S is an important signaling gas in the nervous system [82]. For example, neurodegenerative diseases such as Parkinson’s disease have been linked to a reduction in its levels, and targeted supplementation of H2S to affected structures has proven to be therapeutical [81,83]. Not only certain diseases but also aging itself is connected to endogenous H2S levels because it has powerful properties against oxidative stress [84]. For this reason, future work should go into improving the applicability of these probes and perhaps integrating them with therapeutic techniques. The sensitivity of these probes needs to be improved to allow for more precise quantitative analysis, i.e., a better map of the H2S concentration gradient in the body. Additionally, by further extending the excitation wavelengths of the probes, signaling could improve due to less background interference. Lastly, applying H2S sensors to living models such as rodents would allow researchers to observe how these sensors behave under more variables. Perhaps one day, novel H2S-based treatments will be added to our pharmacopeia to slow, halt, or even reverse some of the most unavoidable afflictions we face.
Author Contributions
This review was cowritten by D.L. and W.H. under the supervision and revision by M.H. All authors read and agreed to the published version of the manuscript.
Conflicts of Interest
The authors declare no conflict of interest.
Funding Statement
M.H. Wishes to thank the Department of Chemistry at GSU, Brains and Behavior Seed Grant, the Atlanta Clinical and Translational Science Institute for the Healthcare Innovation Program Grant, as well as the Georgia Research Alliance for the Ventures Phase 1 Grant.
Footnotes
Disclaimer/Publisher’s Note: The statements, opinions and data contained in all publications are solely those of the individual author(s) and contributor(s) and not of MDPI and/or the editor(s). MDPI and/or the editor(s) disclaim responsibility for any injury to people or property resulting from any ideas, methods, instructions or products referred to in the content.
References
- 1.Wu D., Si W., Wang M., Lv S., Ji A., Li Y. Hydrogen Sulfide in Cancer: Friend or Foe? Nitric Oxide-Chem. Biol. 2015;50:38–45. doi: 10.1016/j.niox.2015.08.004. [DOI] [PubMed] [Google Scholar]
- 2.Wang B., Wang X., Guo Z., Gai S., Li Y., Wu Y. A Highly Sensitive Ppb-Level H2S Gas Sensor Based on Fluorophenoxy-Substituted Phthalocyanine Cobalt/RGO Hybrids at Room Temperature. RSC Adv. 2021;11:5993–6001. doi: 10.1039/D0RA08832C. [DOI] [PMC free article] [PubMed] [Google Scholar]
- 3.Yuvaraja S., Bhyranalyar V.N., Bhat S.A., Surya S.G., Yelamaggad C.V., Salama K.N. A Highly Selective Electron Affinity Facilitated H2S Sensor: The Marriage of Tris (Keto-Hydrazone) and an Organic Field-Effect Transistor. Mater. Horiz. 2021;8:525–537. doi: 10.1039/D0MH01420F. [DOI] [PubMed] [Google Scholar]
- 4.Abe K., Kimura H. The Possible Role of Hydrogen Sulfide as an Endogenous Neuromodulator. J. Neurosci. 1996;16:1066–1071. doi: 10.1523/JNEUROSCI.16-03-01066.1996. [DOI] [PMC free article] [PubMed] [Google Scholar]
- 5.Filipovic M.R., Zivanovic J., Alvarez B., Banerjee R. Chemical Biology of H2S Signaling through Persulfidation. Chem. Rev. 2018;118:1253–1337. doi: 10.1021/acs.chemrev.7b00205. [DOI] [PMC free article] [PubMed] [Google Scholar]
- 6.Chen W., Zhang Y., Li X., Chen H., Sun J., Feng F. H2S Activated Drug Release from Protein Cages. ACS Appl. Mater. Interfaces. 2017;9:33571–33575. doi: 10.1021/acsami.7b12524. [DOI] [PubMed] [Google Scholar]
- 7.Zanardo R.C.O., Brancaleone V., Distrutti E., Fiorucci S., Cirino G., Wallace J.L. Hydrogen Sulfide was an Endogenous Modulator of Leukocyte-Mediated Inflammation. Faseb J. 2006;20:2118–2120. doi: 10.1096/fj.06-6270fje. [DOI] [PubMed] [Google Scholar]
- 8.Jiao X., Li Y., Niu J., Xie X., Wang X., Tang B. Small-Molecule Fluorescent Probes for Imaging and Detection of Reactive Oxygen, Nitrogen, and Sulfur Species in Biological Systems. Anal. Chem. 2018;90:533–555. doi: 10.1021/acs.analchem.7b04234. [DOI] [PubMed] [Google Scholar]
- 9.Kimura H. Hydrogen Sulfide: Its Production and Functions. Exp. Physiol. 2011;96:833–835. doi: 10.1113/expphysiol.2011.057455. [DOI] [PubMed] [Google Scholar]
- 10.Zhang H., Kong X., Tang Y., Lin W. Hydrogen Sulfide Triggered Charge-Reversal Micelles for Cancer-Targeted Drug Delivery and Imaging. ACS Appl. Mater. Interfaces. 2016;8:16227–16239. doi: 10.1021/acsami.6b03254. [DOI] [PubMed] [Google Scholar]
- 11.Fu M., Zhang W., Wu L., Yang G., Li H., Wang R. Hydrogen Sulfide (H2S) Metabolism in Mitochondria and Its Regulatory Role in Energy Production. Proc. Natl. Acad. Sci. USA. 2012;109:2943–2948. doi: 10.1073/pnas.1115634109. [DOI] [PMC free article] [PubMed] [Google Scholar]
- 12.Blackstone E., Morrison M., Roth M.B. H2S Induces a Suspended Animation-like State in Mice. Science. 2005;308:518. doi: 10.1126/science.1108581. [DOI] [PubMed] [Google Scholar]
- 13.Zhao X., Ning L., Zhou X., Song Z., Zhang J., Guan F., Yang X.-F. An Activatable Near-Infrared Fluorescence Hydrogen Sulfide (H2S) Donor for Imaging H2S Release and Inhibiting Inflammation in Cells. Anal. Chem. 2021;93:4894–4901. doi: 10.1021/acs.analchem.0c05081. [DOI] [PubMed] [Google Scholar]
- 14.Huang C.W., Moore P.K. H2S Synthesizing Enzymes: Biochemistry and Molecular Aspects. In: Moore P.K., Whiteman M., editors. Chemistry, Biochemistry and Pharmacology of Hydrogen Sulfide. Springer International Publishing; Cham, Switzerland: 2015. pp. 3–25. Handbook of Experimental Pharmacology. [DOI] [PubMed] [Google Scholar]
- 15.Caliendo G., Cirino G., Santagada V., Wallace J.L. Synthesis and Biological Effects of Hydrogen Sulfide (H2S): Development of H2S-Releasing Drugs as Pharmaceuticals. J. Med. Chem. 2010;53:6275–6286. doi: 10.1021/jm901638j. [DOI] [PubMed] [Google Scholar]
- 16.Cai W.-J., Wang M.-J., Ju L.-H., Wang C., Zhu Y.-C. Hydrogen Sulfide Induces Human Colon Cancer Cell Proliferation: Role of Akt, ERK and P21. Cell Bio. Int. 2010;34:565–572. doi: 10.1042/CBI20090368. [DOI] [PubMed] [Google Scholar]
- 17.Liu X., Gong X., Yuan J., Fan X., Zhang X., Ren T., Yang S., Yang R., Yuan L., Zhang X.-B. Dual-Stimulus Responsive Near-Infrared Reversible Ratiometric Fluorescent and Photoacoustic Probe for In Vivo Tumor Imaging. Anal. Chem. 2021;93:5420–5429. doi: 10.1021/acs.analchem.0c04804. [DOI] [PubMed] [Google Scholar]
- 18.Bailey T.S., Pluth M.D. Chemiluminescent Detection of Enzymatically Produced Hydrogen Sulfide: Substrate Hydrogen Bonding Influences Selectivity for H2S over Biological Thiols. J. Am. Chem. Soc. 2013;135:16697–16704. doi: 10.1021/ja408909h. [DOI] [PMC free article] [PubMed] [Google Scholar]
- 19.Tian X., Li Z., Lau C., Lu J. Visualization of in Vivo Hydrogen Sulfide Production by a Bioluminescence Probe in Cancer Cells and Nude Mice. Anal. Chem. 2015;87:11325–11331. doi: 10.1021/acs.analchem.5b03712. [DOI] [PubMed] [Google Scholar]
- 20.Shi B., Yan Q., Tang J., Cin K., Zhang J., Zhu Y., Xu G., Wang R., Chen J., Gao W., et al. Hydrogen Sulfide-Activatable Second Near-Infrared Fluorescent Nanoassemblies for Targeted Photothermal Cancer Therapy. Nano Lett. 2018;18:6411–6416. doi: 10.1021/acs.nanolett.8b02767. [DOI] [PubMed] [Google Scholar]
- 21.Hosoki R., Matsuki N., Kimura H. The Possible Role of Hydrogen Sulfide as an Endogenous Smooth Muscle Relaxant in Synergy with Nitric Oxide. Biochem. Biophys. Res. Commun. 1997;237:527–531. doi: 10.1006/bbrc.1997.6878. [DOI] [PubMed] [Google Scholar]
- 22.Jimenez D., Martinez-Manez R., Sancenon F., Ros-Lis J.V., Benito A., Soto J. A New Chromo-Chemodosimeter Selective for Sulfide Anion. J. Am. Chem. Soc. 2003;125:9000–9001. doi: 10.1021/ja0347336. [DOI] [PubMed] [Google Scholar]
- 23.Furne J., Saeed A., Levitt M.D. Whole Tissue Hydrogen Sulfide Concentrations were Orders of Magnitude Lower than Presently Accepted Values. Am. J. Physiol. Regul. Integr. Comp. Physiol. 2008;295:R1479–R1485. doi: 10.1152/ajpregu.90566.2008. [DOI] [PubMed] [Google Scholar]
- 24.Wallace J.L. Hydrogen Sulfide-Releasing Anti-Inflammatory Drugs. Trends Pharmacol. Sci. 2007;28:501–505. doi: 10.1016/j.tips.2007.09.003. [DOI] [PubMed] [Google Scholar]
- 25.Kaushik R., Ghosh A., Jose D.A. Simple Terpyridine Based Cu(II)/Zn(II) Complexes for the Selective Fluorescent Detection of H2S in Aqueous Medium. J. Lumin. 2016;171:112–117. doi: 10.1016/j.jlumin.2015.10.005. [DOI] [Google Scholar]
- 26.Wang S., Zhang L., Zhao J., Hou L., Wen C., Liang H., Zhao S. Hydrogen Sulfide Dual-Activated NIR-II Photoacoustic Probes for Accurate Imaging and Efficient Photothermal Therapy of Colon Cancer. ACS Appl. Bio. Mater. 2021;4:974–983. doi: 10.1021/acsabm.0c01428. [DOI] [Google Scholar]
- 27.Chen Y., Zhu C., Yang Z., Chen J., He Y., Jiao Y., He W., Qiu L., Cen J., Guo Z. A Ratiometric Fluorescent Probe for Rapid Detection of Hydrogen Sulfide in Mitochondria. Angew. Chem. Int. Ed. 2013;52:1688–1691. doi: 10.1002/anie.201207701. [DOI] [PubMed] [Google Scholar]
- 28.Hammers M.D., Taormina M.J., Cerda M.M., Montoya L.A., Seidenkranz D.T., Parthasarathy R., Pluth M.D. A Bright Fluorescent Probe for H2S Enables Analyte-Responsive, 3D Imaging in Live Zebrafish Using Light Sheet Fluorescence Microscopy. J. Am. Chem. Soc. 2015;137:10216–10223. doi: 10.1021/jacs.5b04196. [DOI] [PMC free article] [PubMed] [Google Scholar]
- 29.Yang X., Lu X., Wang J., Zhang Z., Du X., Zhang J., Wang J. Near-Infrared Fluorescent Probe with a Large Stokes Shift for Detection of Hydrogen Sulfide in Food Spoilage, Living Cells, and Zebrafish. J. Agric. Food Chem. 2022;9:3047–3055. doi: 10.1021/acs.jafc.2c00087. [DOI] [PubMed] [Google Scholar]
- 30.Peng H., Cheng Y., Dai C., King A.L., Predmore B.L., Lefer D.J., Wang B. A Fluorescent Probe for Fast and Quantitative Detection of Hydrogen Sulfide in Blood. Angew. Chem. Int. Ed. 2011;50:9672–9675. doi: 10.1002/anie.201104236. [DOI] [PMC free article] [PubMed] [Google Scholar]
- 31.Deng Z., Bi S., Jiang M., Zeng S. Endogenous H2S-Activated Orthogonal Second Near-Infrared Emissive Nanoprobe for In Situ Ratiometric Fluorescence Imaging of Metformin-Induced Liver Injury. ACS Nano. 2021;15:3201–3211. doi: 10.1021/acsnano.0c09799. [DOI] [PubMed] [Google Scholar]
- 32.Zhang L., Wang J.-L., Ba X.-X., Hua S.-Y., Jiang P., Jiang F.-L., Liu Y. Multifunction in One Molecule: Mitochondrial Imaging and Photothermal & Photodynamic Cytotoxicity of Fast-Response Near-Infrared Fluorescent Probes with Aggregation-Induced Emission Characteristics. ACS Appl. Mater. Interfaces. 2021;13:7945–7954. doi: 10.1021/acsami.0c20283. [DOI] [PubMed] [Google Scholar]
- 33.Chuang C.-H., Chen W.-Y., Tseng W.-B., Lin A., Lu C.-Y., Tseng W.-L. Microwave-Mediated Synthesis of Near-Infrared-Emitting Silver Ion-Modified Gold Nanoclusters for Ratiometric Sensing of Hydrosulfide in Environmental Water and Hydrogen Sulfide in Live Cells. ACS Sustain. Chem. Eng. 2022;10:2461–2472. doi: 10.1021/acssuschemeng.1c07440. [DOI] [Google Scholar]
- 34.Liu T., Xu Z., Spring D.R., Cui J. A Lysosome-Targetable Fluorescent Probe for Imaging Hydrogen Sulfide in Living Cells. Org. Lett. 2013;15:2310–2313. doi: 10.1021/ol400973v. [DOI] [PubMed] [Google Scholar]
- 35.Cao X., Lin W., Zheng K., He L. A Near-Infrared Fluorescent Turn-on Probe for Fluorescence Imaging of Hydrogen Sulfide in Living Cells Based on Thiolysis of Dinitrophenyl Ether. Chem. Commun. 2012;48:10529–10531. doi: 10.1039/c2cc34031c. [DOI] [PubMed] [Google Scholar]
- 36.Gong S., Zheng Z., Guan X., Feng S., Feng G. Near-Infrared Mitochondria-Targetable Fluorescent Probe for High-Contrast Bioimaging of H2S. Anal. Chem. 2021;93:5700–5708. doi: 10.1021/acs.analchem.0c04639. [DOI] [PubMed] [Google Scholar]
- 37.Bae S.K., Heo C.H., Choi D.J., Sen D., Joe E.-H., Cho B.R., Kim H.M. A Ratiometric Two-Photon Fluorescent Probe Reveals Reduction in Mitochondrial H2S Production in Parkinson’s Disease Gene Knockout Astrocytes. J. Am. Chem. Soc. 2013;135:9915–9923. doi: 10.1021/ja404004v. [DOI] [PubMed] [Google Scholar]
- 38.Wu M.-Y., Li K., Hou J.-T., Huang Z., Yu X.-Q. A Selective Colorimetric and Ratiometric Fluorescent Probe for Hydrogen Sulfide. Org. Biomol. Chem. 2012;10:8342–8347. doi: 10.1039/c2ob26235e. [DOI] [PubMed] [Google Scholar]
- 39.Jose A., Sakla R., Sharma N. Sensing and Bioimaging of the Gaseous Signaling Molecule Hydrogen Sulfide by Near-Infrared Fluorescent Probes. ACS Sens. 2020;5:3365–3391. doi: 10.1021/acssensors.0c02005. [DOI] [PubMed] [Google Scholar]
- 40.Yang Q.-Q., Tian Q.-Q., Ji N., Duan X.-H., Zhu X.-H., Zhang Y.-L., He W. A Novel Fluorescent Probe for the Detection of Sulfur Dioxide Derivatives and Its Application in Biological Imaging. New J. Chem. 2022;46:1483–1488. doi: 10.1039/D1NJ03184H. [DOI] [Google Scholar]
- 41.Huang X., Liu H., Zhang J., Xiao B., Wu F., Zhang Y., Tan Y., Jiang Y. A Novel Near-Infrared Fluorescent Hydrogen Sulfide Probe for Live Cell and Tissue Imaging. New J. Chem. 2019;43:6848–6855. doi: 10.1039/C9NJ00210C. [DOI] [Google Scholar]
- 42.Kang H., Shamim M., Yin X., Adluru E., Fukuda T., Yokomizo S., Chang H., Park S.H., Cui Y., Moy A.J. Tumor-Associated Immune Cell Mediated Tumor Targeting Mechanism with NIR-II Fluorescence Imaging. Adv. Mater. 2021;34:2106500. doi: 10.1002/adma.202106500. [DOI] [PMC free article] [PubMed] [Google Scholar]
- 43.Chang M.J., Kim K., Kang C., Lee M.H. Enhanced Aggregability of AIE-Based Probe through H2S-Selective Triggered Dimerization and Its Applications to Biological Systems. Acs Omega. 2019;4:7176–7181. doi: 10.1021/acsomega.9b00458. [DOI] [Google Scholar]
- 44.Dhivya R., Kavitha V., Gomathi A., Keerthana P., Santhalakshmi N., Viswanathamurthi P., Haribabu J. Dinitrobenzene Ether Reactive Turn-on Fluorescence Probes for the Selective Detection of H2S. Anal. Methods. 2021;14:58–66. doi: 10.1039/D1AY01700D. [DOI] [PubMed] [Google Scholar]
- 45.Cao Y., Wang L., Liu Z., Sun C., Li Y. Theoretical Study on the Sensing Mechanism of Chalcone-Based Fluorescence Probe for Detecting Hydrogen Sulfide and Biothiols. New J. Chem. 2021;45:16906–16912. doi: 10.1039/D1NJ03052C. [DOI] [Google Scholar]
- 46.Lin V.S., Lippert A.R., Chang C.J. Azide-based fluorescent probes: Imaging hydrogen sulfide in living systems. Methods Enzymol. 2015;554:63–80. doi: 10.1016/bs.mie.2014.11.011. [DOI] [PubMed] [Google Scholar]
- 47.Lippert A.R., New E.J., Chang C.J. Reaction-Based Fluorescent Probes for Selective Imaging of Hydrogen Sulfide in Living Cells. J. Am. Chem. Soc. 2011;133:10078–10080. doi: 10.1021/ja203661j. [DOI] [PubMed] [Google Scholar]
- 48.Essam Z.M., Ozmen G.E., Setiawan D., Hamid R.R., El-Aal R.M.A., Aneja R., Hamelberg D., Henary M. Donor Acceptor Fluorophores: Synthesis, Optical Properties, TD-DFT and Cytotoxicity Studies. Org. Biomol. Chem. 2021;19:1835–1846. doi: 10.1039/D0OB02313B. [DOI] [PMC free article] [PubMed] [Google Scholar]
- 49.Choi H.S., Gibbs S.L., Lee J.H., Kim S.H., Ashitate Y., Liu F., Hyun H., Park G., Xie Y., Bae S., et al. Targeted Zwitterionic Near-Infrared Fluorophores for Improved Optical Imaging. Nat. Biotechnol. 2013;31:148–153. doi: 10.1038/nbt.2468. [DOI] [PMC free article] [PubMed] [Google Scholar]
- 50.Cao J., Chi J., Xia J., Zhang Y., Han S., Sun Y. Iodinated Cyanine Dyes for Fast Near-Infrared-Guided Deep Tissue Synergistic Phototherapy. ACS Appl. Mater. Interfaces. 2019;11:25720–25729. doi: 10.1021/acsami.9b07694. [DOI] [PubMed] [Google Scholar]
- 51.Lovett W.R., Al Hamd A., Casa S., Henary M. Synthesis of PH-Sensitive Benzothiazole Cyanine Dye Derivatives Containing a Pyridine Moiety at the Meso Position. Dyes Pigments. 2021;190:109268. doi: 10.1016/j.dyepig.2021.109268. [DOI] [Google Scholar]
- 52.Chen Z., Mu X., Han Z., Yang S., Zhang C., Guo Z., Bai Y., He W. An Optical/Photoacoustic Dual-Modality Probe: Ratiometric in/Ex Vivo Imaging for Stimulated H2S Upregulation in Mice. J. Am. Chem. Soc. 2019;141:17973–17977. doi: 10.1021/jacs.9b09181. [DOI] [PubMed] [Google Scholar]
- 53.Li W., Shen Y., Gong X., Zhang X.-B., Yuan L. Highly Selective Fluorescent Probe Design for Visualizing Hepatic Hydrogen Sulfide in the Pathological Progression of Nonalcoholic Fatty Liver. Anal. Chem. 2021;93:16673–16682. doi: 10.1021/acs.analchem.1c04246. [DOI] [PubMed] [Google Scholar]
- 54.Wang J., Xie H., Li H., Wang R., Zhang B., Ren T., Hua J., Chen N. NIR Fluorescent Probe for In Situ Bioimaging of Endogenous H2S in Rice Roots under Al3+ and Flooding Stresses. J. Agric. Food Chem. 2021;69:14330–14339. doi: 10.1021/acs.jafc.1c05247. [DOI] [PubMed] [Google Scholar]
- 55.Wang C., Ding Y., Bi X., Luo J., Wang G., Lin Y. Carbon Quantum Dots-Ag Nanoparticle Complex as a Highly Sensitive “Turn-on” Fluorescent Probe for Hydrogen Sulfide: A DFT/TD-DFT Study of Electronic Transitions and Mechanism of Sensing. Sens. Actuators B Chem. 2018;264:404–409. doi: 10.1016/j.snb.2018.02.186. [DOI] [Google Scholar]
- 56.Yu C., Li X., Zeng F., Zheng F., Wu S. Carbon-Dot-Based Ratiometric Fluorescent Sensor for Detecting Hydrogen Sulfide in Aqueous Media and inside Live Cells. Chem. Commun. 2013;49:403–405. doi: 10.1039/C2CC37329G. [DOI] [PubMed] [Google Scholar]
- 57.Fortibui M.M., Yoon D.W., Lim J.-Y., Lee S., Choi M., Heo J.S., Kim J., Kim J. A Cancer Cell-Specific Benzoxadiazole-Based Fluorescent Probe for Hydrogen Sulfide Detection in Mitochondria. Dalton Trans. 2021;50:2545–2554. doi: 10.1039/D0DT03653F. [DOI] [PubMed] [Google Scholar]
- 58.Liu W., Bu D., Zhang H., Zhang M., Ren H., Li Z., Yu M. A Mitochondrial and Lysosomal Targeted Ratiometric Probe for Detecting Intracellular H2S. Anal. Methods. 2022;14:101–105. doi: 10.1039/D1AY01783G. [DOI] [PubMed] [Google Scholar]
- 59.Singh N., Sharma S., Singh R., Rajput S., Chattopadhyay N., Tewari D., Joshi K.B., Verma S. A Naphthalimide-Based Peptide Conjugate for Concurrent Imaging and Apoptosis Induction in Cancer Cells by Utilizing Endogenous Hydrogen Sulfide. Chem. Sci. 2021;12:16085–16091. doi: 10.1039/D1SC04030H. [DOI] [PMC free article] [PubMed] [Google Scholar]
- 60.Dong B., Song X., Wang C., Kong X., Tang Y., Lin W. Dual Site-Controlled and Lysosome-Targeted Intramolecular Charge Transfer-Photoinduced Electron Transfer-Fluorescence Resonance Energy Transfer Fluorescent Probe for Monitoring PH Changes in Living Cells. Anal. Chem. 2016;88:4085–4091. doi: 10.1021/acs.analchem.6b00422. [DOI] [PubMed] [Google Scholar]
- 61.Li Y., Gu B., Su W., Duan X., Xu H., Huang Z., Li H., Yao S. A Simple and Efficient Fluorescent Probe for the Rapid Detection of H2S in Living Cells and on Agar Gels. Anal. Methods. 2017;9:3290–3295. doi: 10.1039/C7AY00499K. [DOI] [Google Scholar]
- 62.Liu Y., Meng F., He L., Liu K., Lin W. A Dual-Site Two-Photon Fluorescent Probe for Visualizing Lysosomes and Tracking Lysosomal Hydrogen Sulfide with Two Different Sets of Fluorescence Signals in the Living Cells and Mouse Liver Tissues. Chem. Commun. 2016;52:7016–7019. doi: 10.1039/C6CC02368A. [DOI] [PubMed] [Google Scholar]
- 63.Chen F., Han D., Liu H., Wang S., Li K.-B., Zhang S., Shi W. A Tri-Site Fluorescent Probe for Simultaneous Sensing of Hydrogen Sulfide and Glutathione and Its Bioimaging Applications. Analyst. 2018;143:440–448. doi: 10.1039/C7AN01588G. [DOI] [PubMed] [Google Scholar]
- 64.Ren M., Deng B., Kong X., Zhou K., Liu K., Xu G., Lin W. A TICT-Based Fluorescent Probe for Rapid and Specific Detection of Hydrogen Sulfide and Its Bio-Imaging Applications. Chem. Commun. 2016;52:6415–6418. doi: 10.1039/C6CC00966B. [DOI] [PubMed] [Google Scholar]
- 65.Li S.-J., Li Y.-F., Liu H.-W., Zhou D.-Y., Jiang W.-L., Ou-Yang J., Li C.-Y. A Dual-Response Fluorescent Probe for the Detection of Viscosity and H2S and Its Application in Studying Their Crosstalk Influence in Mitochondria. Anal. Chem. 2018;90:9418–9425. doi: 10.1021/acs.analchem.8b02068. [DOI] [PubMed] [Google Scholar]
- 66.Zhang Y., Zhang B., Li Z., Wang L., Ren X., Ye Y. Endoplasmic Reticulum Targeted Fluorescent Probe for the Detection of Hydrogen Sulfide Based on a Twist-Blockage Strategy. Org. Biomol. Chem. 2019;17:8778–8783. doi: 10.1039/C9OB01750J. [DOI] [PubMed] [Google Scholar]
- 67.Feng X., Zhang T., Liu J.-T., Miao J.-Y., Zhao B.-X. A New Ratiometric Fluorescent Probe for Rapid, Sensitive and Selective Detection of Endogenous Hydrogen Sulfide in Mitochondria. Chem. Commun. 2016;52:3131–3134. doi: 10.1039/C5CC09267A. [DOI] [PubMed] [Google Scholar]
- 68.Yang Y., He L., Xu K., Lin W. A Ratiometric Fluorescent Chemosensor for the Convenient Monitoring of Hydrogen Sulfide Concentration by the Dual Fluorescence Fluctuation Mode of Two Distinct Emission Bands in Living Cells and Zebrafish. New J. Chem. 2019;43:10926–10931. doi: 10.1039/C9NJ02369K. [DOI] [Google Scholar]
- 69.Zhang Y., Chen Y., Yang B., Xue X., He W., Guo Z. FRET Based Fluorescent Ratiometric Probes for Rapid Detection of Endogenous Hydrogen Sulphide in Living Cells. Analyst. 2020;145:4233–4238. doi: 10.1039/D0AN00531B. [DOI] [PubMed] [Google Scholar]
- 70.Ye H., Sun L., Pang Z., Ji X., Tu X., Huang H., Tang X., Xi X., Yi L. Cell-Trappable BODIPY-NBD Dyad for Imaging of Basal and Stress-Induced H2S in Live Biosystems Anal. Chem. 2022;94:1733–1741. doi: 10.1021/acs.analchem.1c04324. [DOI] [PubMed] [Google Scholar]
- 71.Wu R., Chen Z., Huo H., Chen L., Su L., Zhang X., Wu Y., Yao Z., Xiao S., Du W., et al. Ratiometric Detection of H2S in Liver Injury by Activated Two-Wavelength Photoacoustic Imaging. Anal. Chem. 2022;94:10797–10804. doi: 10.1021/acs.analchem.2c01571. [DOI] [PubMed] [Google Scholar]
- 72.Zhu H., Liu C., Yuan R., Wang R., Zhang H., Li Z., Jia P., Zhu B., Sheng W. A Simple Highly Specific Fluorescent Probe for Simultaneous Discrimination of Cysteine/Homocysteine and Glutathione/Hydrogen Sulfide in Living Cells and Zebrafish Using Two Separated Fluorescence Channels under Single Wavelength Excitation. Analyst. 2019;144:4258–4265. doi: 10.1039/C9AN00818G. [DOI] [PubMed] [Google Scholar]
- 73.Lan J.-S., Zeng R.-F., Liu Y., Xiang Y.-W., Jiang X., Liu L., Xie S.-S., Ding Y., Zhang T. A Near-Infrared Nile Red Fluorescent Probe for the Discrimination of Biothiols by Dual-Channel Response and Its Bioimaging Applications in Living Cells and Animals. Analyst. 2019;144:3676–3684. doi: 10.1039/C9AN00280D. [DOI] [PubMed] [Google Scholar]
- 74.Jing X., Yu F., Lin W. A PET-Based Lysosome-Targeted Turn-on Fluorescent Probe for the Detection of H2S and Its Bioimaging Application in Living Cells and Zebrafish. New J. Chem. 2019;43:16796–16800. doi: 10.1039/C9NJ03862K. [DOI] [Google Scholar]
- 75.Fang Q., Xiong H., Yang L., Wang B., Song X. An Instantaneous Fluorescent Probe for Detecting Hydrogen Sulfide in Biological Systems. New J. Chem. 2019;43:13594–13599. doi: 10.1039/C9NJ02849H. [DOI] [Google Scholar]
- 76.Velusamy N., Binoy A., Bobba K.N., Nedungadi D., Mishra N., Bhuniya S. A Bioorthogonal Fluorescent Probe for Mitochondrial Hydrogen Sulfide: New Strategy for Cancer Cell Labeling. Chem. Commun. 2017;53:8802–8805. doi: 10.1039/C7CC05339H. [DOI] [PubMed] [Google Scholar]
- 77.Wang X., Zuo Y., Zhang Y., Yang T., Lin W. An ICT-Based Fluorescent Probe with Bridging Si–O–Si Bonds for Visualizing Hydrogen Sulfide in Lipid Droplets and Its Application. Anal. Methods. 2020;12:1064–1069. doi: 10.1039/C9AY02657F. [DOI] [Google Scholar]
- 78.Dou Y., Gu X., Ying S., Zhu S., Yu S., Shen W., Zhu Q. A Novel Lysosome-Targeted Fluorogenic Probe Based on 5-Triazole-Quinoline for the Rapid Detection of Hydrogen Sulfide in Living Cells. Org. Biomol. Chem. 2018;16:712–716. doi: 10.1039/C7OB02881D. [DOI] [PubMed] [Google Scholar]
- 79.Ren M., Li Z., Deng B., Wang L., Lin W. Single Fluorescent Probe Separately and Continuously Visualize H2S and HClO in Lysosomes with Different Fluorescence Signals. Anal. Chem. 2019;91:2932–2938. doi: 10.1021/acs.analchem.8b05116. [DOI] [PubMed] [Google Scholar]
- 80.Wu Z., Liang D., Tang X. Visualizing Hydrogen Sulfide in Mitochondria and Lysosome of Living Cells and in Tumors of Living Mice with Positively Charged Fluorescent Chemosensors. Anal. Chem. 2016;88:9213–9218. doi: 10.1021/acs.analchem.6b02459. [DOI] [PubMed] [Google Scholar]
- 81.Zhang Y., Tang Z., Ren Z., Qu S., Liu M., Liu L., Jiang Z. Hydrogen Sulfide, the Next Potent Preventive and Therapeutic Agent in Aging and Age-Associated Diseases. Mol. And Cell. Biol. 2013 doi: 10.1128/MCB.01215-12. Published Ahead of Print . [DOI] [PMC free article] [PubMed] [Google Scholar]
- 82.Szabo C. Hydrogen sulphide and its therapeutic potential. Nat. Rev. Drug Discov. 2007;6:917–935. doi: 10.1038/nrd2425. [DOI] [PubMed] [Google Scholar]
- 83.Whiteman M., Le Trionnaire S., Chopra M., Fox B., Whatmore J. Emerging role of hydrogen sulfide in health and disease: Critical appraisal of biomarkers and pharmacological tools. Clin. Sci. 2011;121:459–488. doi: 10.1042/CS20110267. [DOI] [PubMed] [Google Scholar]
- 84.Zhang S., Yang G., Guan W., Li B., Feng X., Fan H. Autophagy Plays a Protective Role in Sodium Hydrosulfide-Induced Acute Lung Injury by Attenuating Oxidative Stress and Inflammation in Rats. Chem. Res. Toxicol. 2021;34:857–864. doi: 10.1021/acs.chemrestox.0c00493. [DOI] [PubMed] [Google Scholar]


