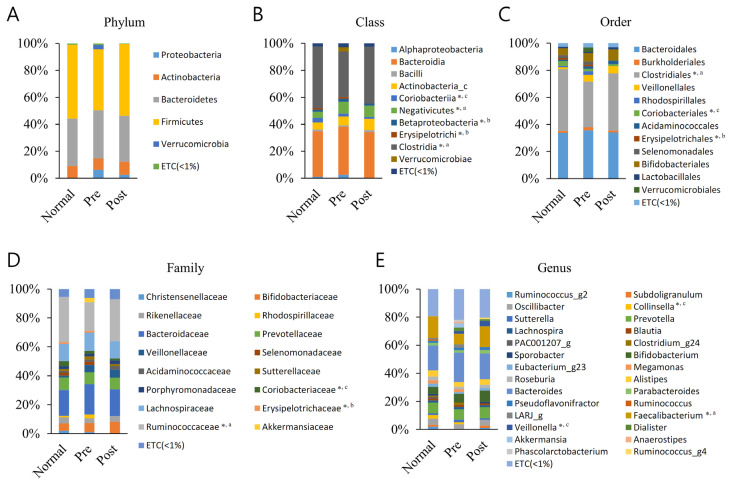
Figure 1.
Averaged taxonomic composition of the normal group (Normal), IDA patient group (Pre), and recovery group from IDA following iron supplementation (Post). Taxonomic relative abundance was categorized at the (A) phylum, (B) class, (C) order, (D) family, and (E) genus levels, and relative abundances of less than 1% are expressed as ETC. The Wilcoxon rank-sum test was used to analyze the groups’ significance (* p < 0.05). The a, b, and c superscripts denote the groups subjected to significance determination (a, Normal–Pre; b, Pre–Post; c, Normal–Post).

