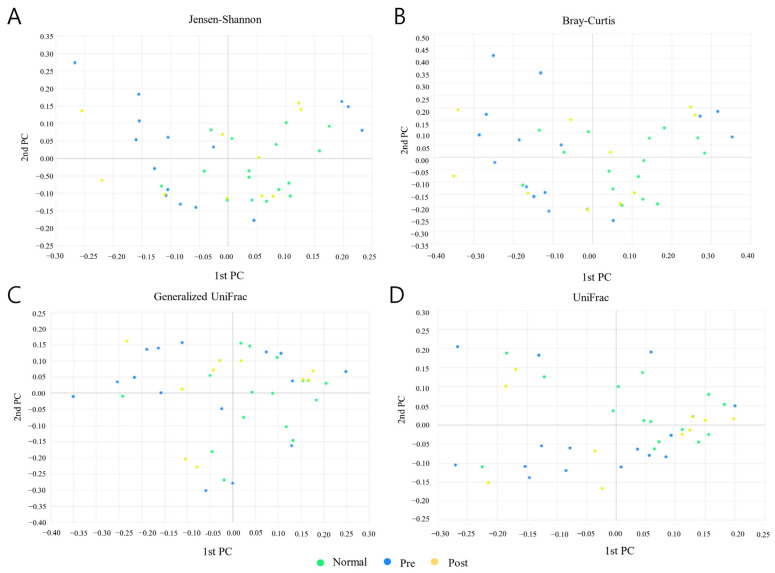
Figure 3.
Results of PCoA (principal coordinate analysis) analysis between normal subjects (Normal), IDA patients (Pre), and subjects who recovered from IDA following iron supplementation (Post). (A) Jensen–Shannon, (B) Bray–Curtis, (C) Generalized UniFrac, and (D) UniFrac methods were applied to the analysis. Light green, blue, and yellow circles represent the Normal, Pre, and Post groups, respectively.

