Error in Figure/Table
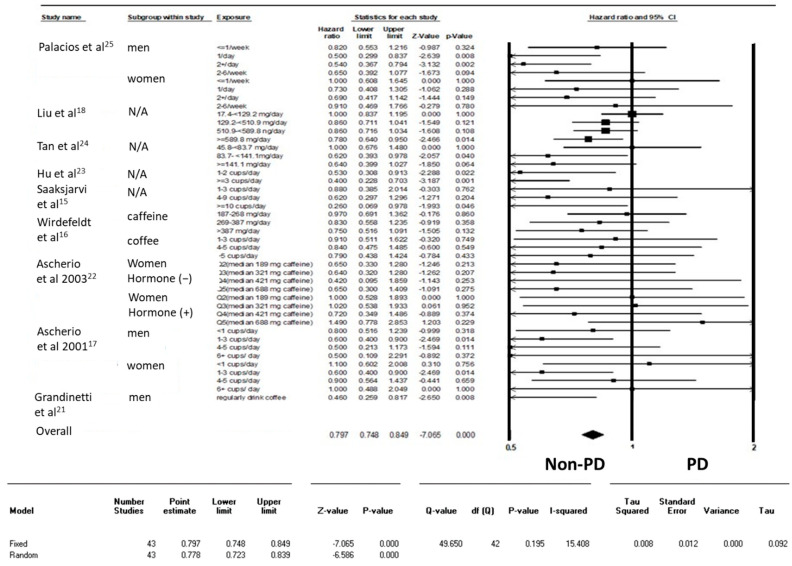
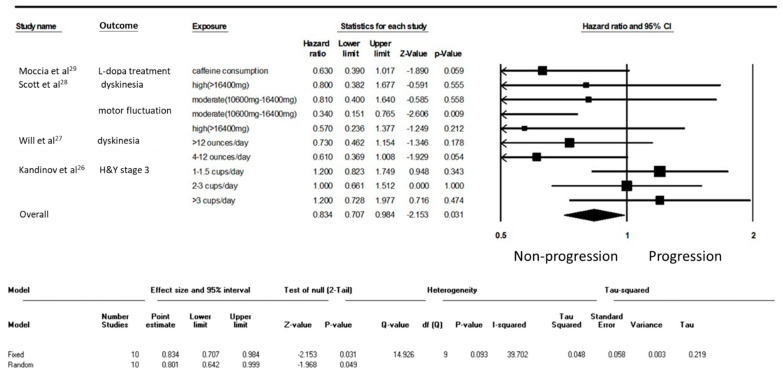
In the original publication [1], there were some mistakes in Table 1 and Table 2 and Figure 2 and Figure 3 as published. The citation number in those aforementioned Tables and Figures was incorrect. The corrected Table 1 and Table 2 and Figure 2 and Figure 3 appear below.
Table 1.
List of the included cohort study.
| Study Name | Country | Original Cohort (Established-Last Outcome Assessment) | n | Assessment Caffeine Consumption | Amount of Caffeine Consumption | The Diagnosis of PD |
|---|---|---|---|---|---|---|
| Ascherio et al. [17] | USA | Health Professionals’ Follow-Up Study and Nurses’ Health Study (1976 and 1986/1994) | 135,916 | Semiquantitative food-frequency questionnaire (SFFQ) | Caffeine was 137 mg per cup of coffee, 47 mg per cup of tea, 46 mg per can or bottle of cola beverage, and 7 mg per serving of chocolate candy. |
Self-report and medical records |
| Ascherio et al. [22] | USA | Nurses’ Health Study (1976/1998) |
121,700 women | Semiquantitative food-frequency questionnaire (SFFQ) | Caffeine was 137 mg per cup of coffee, 47 mg per cup of tea, 46 mg per can or bottle of cola beverage, and 7 mg per serving of chocolate candy. |
Medical records |
| Grandinetti et al. [21] | USA | Honolulu Heart Program-Japanese and Okinawan ancestry (1965/1991) | 8006 men | Questionnaires | NA | Medical records |
| Hu et al. [23] | FIN | Four independent cross-sectional population surveys were carried out in five geographic areas of Finland in 1982, 1987, 1992, and 1997 (1982/2002) |
29,335 | Self-administered questionnaire | Cups of coffee | National Social Insurance Institution’s Register |
| Liu et al. [18] | USA | NIH-AARP Diet and Health Study (1995/2010) | 566,401 | Diet History Questionnaire |
Nutrient calculation: 1994–1996 US Department of Agriculture’s Continuing Survey of Food Intakes by Individuals. |
Interview and copy of medical records |
| Palacios et al. [25] | USA | CPS II–Nutrition cohort (1992/2007) | 184,190 | Food Frequency Questionnaire | 137 and 47 mg per cup of coffee and tea, respectively, 46 mg per can or bottle of cola; and 7 mg per serving of chocolate. |
Interview and copy of medical records |
| Sääksjärvi et al. [15] | FIN | Finnish Mobile Clinic Health Examination Survey (1973/1994) |
7246 | Self-administered, health questionnaire |
Cups of coffee | National Social Insurance Institution’s Register |
| Tan et al. [24] | SG | Singapore Chinese Health Study (1993/2005) | 63,257 | A validated, semiquantitative food frequency section questionnaire | Singapore Food Composition Table, a food-nutrient database that lists the levels of 96 Nutritive/nonnutritive components (including caffeine) per 100 g of cooked food and beverages | Interview and linkage database to medical record |
| Wirdefeldt et al. [16] | SE | Swedish Twin Registry (1961 and 1973/without clear mentioning) | 52,149 | Questionnaires | Did not provide the formula | Inpatient Discharge Register and Cause of Death Register |
Table 2.
List of the included studies on the progression of Parkinson’s disease (PD).
| Study Name | Country | Number of PD | Stage of PD | Assessment Caffeine Consumption | Amount of Caffeine Consumption | Mean Follow-Up Period of Time | Outcome as the Progression of PD |
|---|---|---|---|---|---|---|---|
| Kandinov et al. [26] | IL | 278 | Onset of PD motor symptoms | Interview | The number of cups of coffee per day | 10.3 years | Time from onset to Hoehn and Yahr stage 3 |
| Moccia et al. [29] | IL | 79 | de novo, drug naïve | Caffeine Consumption Questionnaire |
i.e., Espresso 1oz = 50 mg caffeine | 4 years | Starting L-dopa treatment |
| Scott et al. [28] | GB | 183 | Newly diagnosed | Verbal interview about the average level of exposure before baseline | Cups of tea: 47 mg caffeine Cup of coffee: 62 mg caffeine |
59 months | 1.Motor fluctuation 2.Dyskinesia |
| Wills et al. [27] | US | 228 | Early PD | questionnaire assessing both current (“in the past week”) and prior (“on average over the past 5 years”) caffeine intake |
Coffee (85 mg caffeine/5 oz) Tea (36 mg caffeine/5 oz) Soda (45 mg caffeine/12 oz) |
5.5 years | Dyskinesia |
Figure 2.
Forest plot illustrating the hazard ratio (HR) of Parkinson’s disease (PD) among healthy individuals from cohort studies.
Figure 3.
Forest plot illustrating the hazard ratio (HR) of progression of Parkinson’s disease (PD) among individuals with early-stage PD.
The authors apologize for any inconvenience caused and state that the scientific conclusions are unaffected. This correction was approved by the Academic Editor. The original publication has also been updated.
Footnotes
Disclaimer/Publisher’s Note: The statements, opinions and data contained in all publications are solely those of the individual author(s) and contributor(s) and not of MDPI and/or the editor(s). MDPI and/or the editor(s) disclaim responsibility for any injury to people or property resulting from any ideas, methods, instructions or products referred to in the content.
Reference
- 1.Hong C.T., Chan L., Bai C.-H. The Effect of Caffeine on the Risk and Progression of Parkinson’s Disease: A Meta-Analysis. Nutrients. 2020;12:1860. doi: 10.3390/nu12061860. [DOI] [PMC free article] [PubMed] [Google Scholar]


