

Abstract
Objectives:
The purpose of this study was to derive a biomechanical stress metric based on the multi-factorial assessment of coronary plaque morphology, likely related to the propensity of plaque rupture in patients.
Background:
Plaque rupture, the most frequent cause of coronary thrombosis, occurs at locations of elevated tensile stress in necrotic core fibroatheromas (NCFAs). Finite element modeling (FEM), typically used to calculate tensile stress, is computationally intensive and impractical as a clinical tool for locating rupture-prone plaques. Here, we derive a multifactorial stress equation (MSE) that accurately computes peak stress in NCFAs by combining the influence of several morphological parameters.
Methods:
IVUS and OFDI were conducted in 30 patients and plaque morphological parameters were defined in 61 NCFAs. Multivariate regression analysis was applied to derive the MSE and compute a peak stress metric (PSM) based on the analysis of plaque morphological parameters. The accuracy of the MSE was determined by comparing PSM with FEM-derived peak stress values. The ability of the PSM in locating plaque rupture sites was tested in three additional patients.
Results:
The following parameters were found to be independently associated with peak stress: fibrous cap thickness (p<0.0001), necrotic core angle (p=0.024), necrotic core thickness (p<0.0001), lumen area (p<0.0001), necrotic core including calcium areas (p=0.017), and plaque area (p=0.003). The PSM showed excellent correlation (R=0.85, p<0.0001) with FEM-derived peak stress, confirming the accuracy of the MSE. In only 56% (n=34) of plaques, the fibrous cap thickness was a determining parameter identifying the cross-section with the highest PSM; whereas in coronary segments with plaque ruptures, the MSE precisely located the rupture site.
Conclusions:
Given the potential of MSE to rapidly calculate PSS in coronary lesions, we anticipate that this study will open the unique opportunity to further investigate the biomechanical hallmarks of plaque instability and acute coronary events in patients.
Keywords: Atherosclerosis, biomechanics, computational modeling, plaque rupture, stress, finite element
Condensed abstract
This study defines a new multifactorial stress equation that combines the cumulative influence of plaque morphological parameters to likely serve as a predictive index for plaque rupture. Multivariate regression analysis was performed to determine the interdependencies between individual plaque parameters and derive multifactorial stress equation (MSE) to calculate the PSM. Our results demonstrate that the MSE accurately quantifies peak stress within seconds directly from morphometric measurements of plaque dimensions, and may potentially facilitate coronary biomechanical profiling to locate rupture-prone plaques during PCI.
INTRODUCTION
Ruptured TCFAs, frequently implicated at the site of culprit coronary thrombi are hallmarked by the presence of a thin, inflamed fibrous cap overlying a large necrotic lipid core (1,2). Motivated by the need to prospectively identify rupture-prone plaques in patients, a number of intravascular modalities including OFDI, virtual-histology-IVUS, and near infrared spectroscopy have been investigated to detect TCFAs (3,4). A critical challenge is that TCFAs with similar morphologic features do not all possess an equal likelihood of rupture. In 70% of patients with AMI, multiple non-disrupted TCFAs are found remote from the culprit site and in non-culprit arteries (5,6). Moreover, 20% of plaque ruptures are observed in NC lesions with thicker fibrous caps (>100μm), intra-plaque hemorrhage, or calcifications (5–7). These findings call into question the effectiveness of an imaging paradigm that relies entirely on detecting TCFA features and highlight the need to augment morphologic findings with critical biomechanical metrics to accurately evaluate the risk of plaque rupture.
Finite element modeling (FEM) is a widely accepted computational tool for biomechanical profiling of coronary plaques. In FEM, plaque contours are determined using idealized models (8,9), histology cross-sections (10,11), or imaging tools such as VH, IVUS, or computed tomography (12–15). The contours are discretized into meshes, and tensile stress is mathematically derived in response to physiological pressure and information on the material properties of the constituent tissues (8,12). Several FEM studies have underscored the importance of local maximum (peak) tensile stress in the fibrous cap and indicated that peak stress is profoundly related to the propensity of plaque rupture and ensuing risk of acute coronary events (12–15). Various morphological factors including fibrous cap thickness (8,11), NC size (11,12,15), plaque burden (13,14), stenosis severity (8), and presence of calcifications (13,14) have been shown to influence peak stress. Recent clinical studies suggest that the measurement of peak stress may improve the prediction of future MACE, highlighting the clinical need for prospectively quantifying biomechanical stress in coronary plaques (13,16). However, despite the demonstrated relevance and clinical need for measuring plaque tensile stress, the computational complexity and long processing times render the FEM approach impractical as a routine clinical tool for biomechanical stress profiling of coronary plaques.
In this study, we introduce a novel approach using a straightforward multifactorial stress equation (MSE), that may circumvent the need for FEM by estimating peak stress in NCFAs directly from six independent morphometric measurements of plaque geometry. To improve the precision of quantifying peak stress, the MSE utilizes a dual-modality OFDI-IVUS approach to obtain plaque morphology. Through studies conducted in 33 patients, we demonstrate that the new MSE can accurately estimate peak stress to potentially locate rupture-prone plaques in patients.
METHODS
Study population
This study details a retrospective analysis of an investigational study that included 33 patients with ACS (n=13) and stable angina pectoris (n=20) imaged using IVUS per standard-of-care followed by OFDI imaging between August 2008 and July 2015 at the Thoraxcenter, Erasmus Medical Center (EMC), Rotterdam, NL (Table S1). The ethics committee at EMC approved the protocol. Each patient gave written informed consent before enrollment. All procedures were performed in accordance with local and federal regulations and the declaration of Helsinki.
OFDI and IVUS imaging
OFDI and IVUS imaging were performed following diagnostic coronary angiography in 33 patients (10 before PCI, 8 after PCI and 15 both before and after PCI). Using 2.6 Fr catheters (Terumo Fast View), OFDI (console built at MGH, 1300nm center wavelength, 9.4 μm axial resolution) was performed at 20 mm/s pullback speed with an imaging rate of 100 frames/s during injection of non-ionic contrast solution at 1–3 cc/s (17). Grey scale IVUS (3.2 Fr, 30 MHz, Boston Scientific, 100 μm axial resolution) was performed with 0.5 mm/s pullback speed at 10 frames/s.
OFDI-IVUS image co-registration
OFDI and IVUS image co-registration were performed using previously established criteria for plaque identification (18) with ImageJ (NIH, Bethesda, Maryland). Image cross-sections with stent struts, side branches spanning, and visible thrombi were excluded from the analysis, because these features obstructed the accurate determination of luminal geometry. IVUS datasets were co-registered with OFDI pullbacks with the aid of landmarks, such as side branches, presence of calcifications, lumen shape, plaque shape, and the relative distance from such landmarks and structures. From OFDI images, we identified all NCFAs defined as plaques with a high-intensity fibrous cap overlying a NC with low-intensity, diffused signal, with a lipid arc >90°. A total of 61 unruptured NCFA plaques were identified in 39 coronaries of 30 patients. Co-registered OFDI-IVUS image-pairs at the location of the thinnest fibrous cap in all 61 NCFAs were selected for analysis using FEM (detailed below). In addition, to investigate the influence of plaque morphological parameters, OFDI-IVUS image pairs were further selected for analysis at 1mm increments over the entire length for each NCFA. Thus, a total of 195 co-registered OFDI-IVUS image pairs were analyzed. In 3 patients, 3 ruptured NCFAs were observed at the sites of culprit coronary thrombosis; these patient datasets were used to test the utility of the MSE for localizing plaque ruptures as detailed later. Superposition of the selected and co-registered OFDI-IVUS image pairs offered composite images from which morphometric measurements of coronary components were extracted as below.
Definition and measurement of plaque parameters
In all 33 patients, NCFA morphological parameters were quantified following manual segmentation of the lumen, fibrous cap and calcific nodule contours from OFDI images, and the NC and EEL contours from composite OFDI-IVUS images (Figure 1) using QCU-CMS viewing software (Leiden University Medical Center, NL). All parameters were calculated as an average of measurements performed in triplicate. From OFDI images, fibrous cap thickness (FCthick=minimum radial thickness of the fibrous cap), NC arc angle (NCarc=maximum circumferential arc of the lipid-rich core), calcium thickness (Calthick=mean thickness of calcium), and calcium-lumen distance (Caldepth=distance from lumen surface to calcium) were measured (Figure 1C). From the composite OFDI-IVUS images, plaque thickness (Plqthick=distance between lumen and EEL), NC thickness (NCthick = the thickness of NC at the location of thinnest cap region), lumen (CSAlumen), necrotic core (NCarea), and calcium areas (Calarea) were measured (Figure 1E). Totarea was defined as the area of the coronary cross-section encompassed by the EEL, Plqarea was measured by excluding CSAlumen from the Totarea (Plqarea=Totarea−CSAlumen), and %area stenosis (%AS) was derived from OFDI by (1-CSAlumen/(RefLuarea))*100%.
Figure 1: Intracoronary OFDI and IVUS assessment of plaque geometry in patients.

Pullbacks of (A) OFDI, (B) IVUS through a 2 cm coronary artery. The corresponding 2D cross-sectional images of a typical coronary plaque with lipid-pool are shown at the location of the blue line, (C) OFDI identifies thin fibrous cap (red arrow head) over lipid-pool (yellow arc), D) IVUS detects the external elastic membrane (green line), and (E) Superimposition of plaque boundaries obtained from overlaid OFDI-IVUS image.
Finite element modeling (FEM)
In order to derive the MSE, we first investigated the relationships between individual plaque parameters and peak stress values in 61 unruptured NCFA cross-sections selected at the location of the thinnest fibrous cap. FEM was used to calculate reference peak stress values because it is the most widely-used and validated approach for biomechanical analysis (8–15) (see Supplementary materials for details).
Material and model properties:
Plaque geometry was reconstructed from the segmented contours (above) using a simple MATLAB script (Figure 2) and exported to ABAQUS software (ver 6.14, Dassault systems) to perform FEM. An anisotropic, linear-elastic, quasi-incompressible material model was used to conduct FEM similar to other published reports (8,12). The material properties of the plaque constituents were obtained from the literature (8,16,19) (Table S2).
Figure 2: Finite element modeling to measure coronary tensile stress distribution.
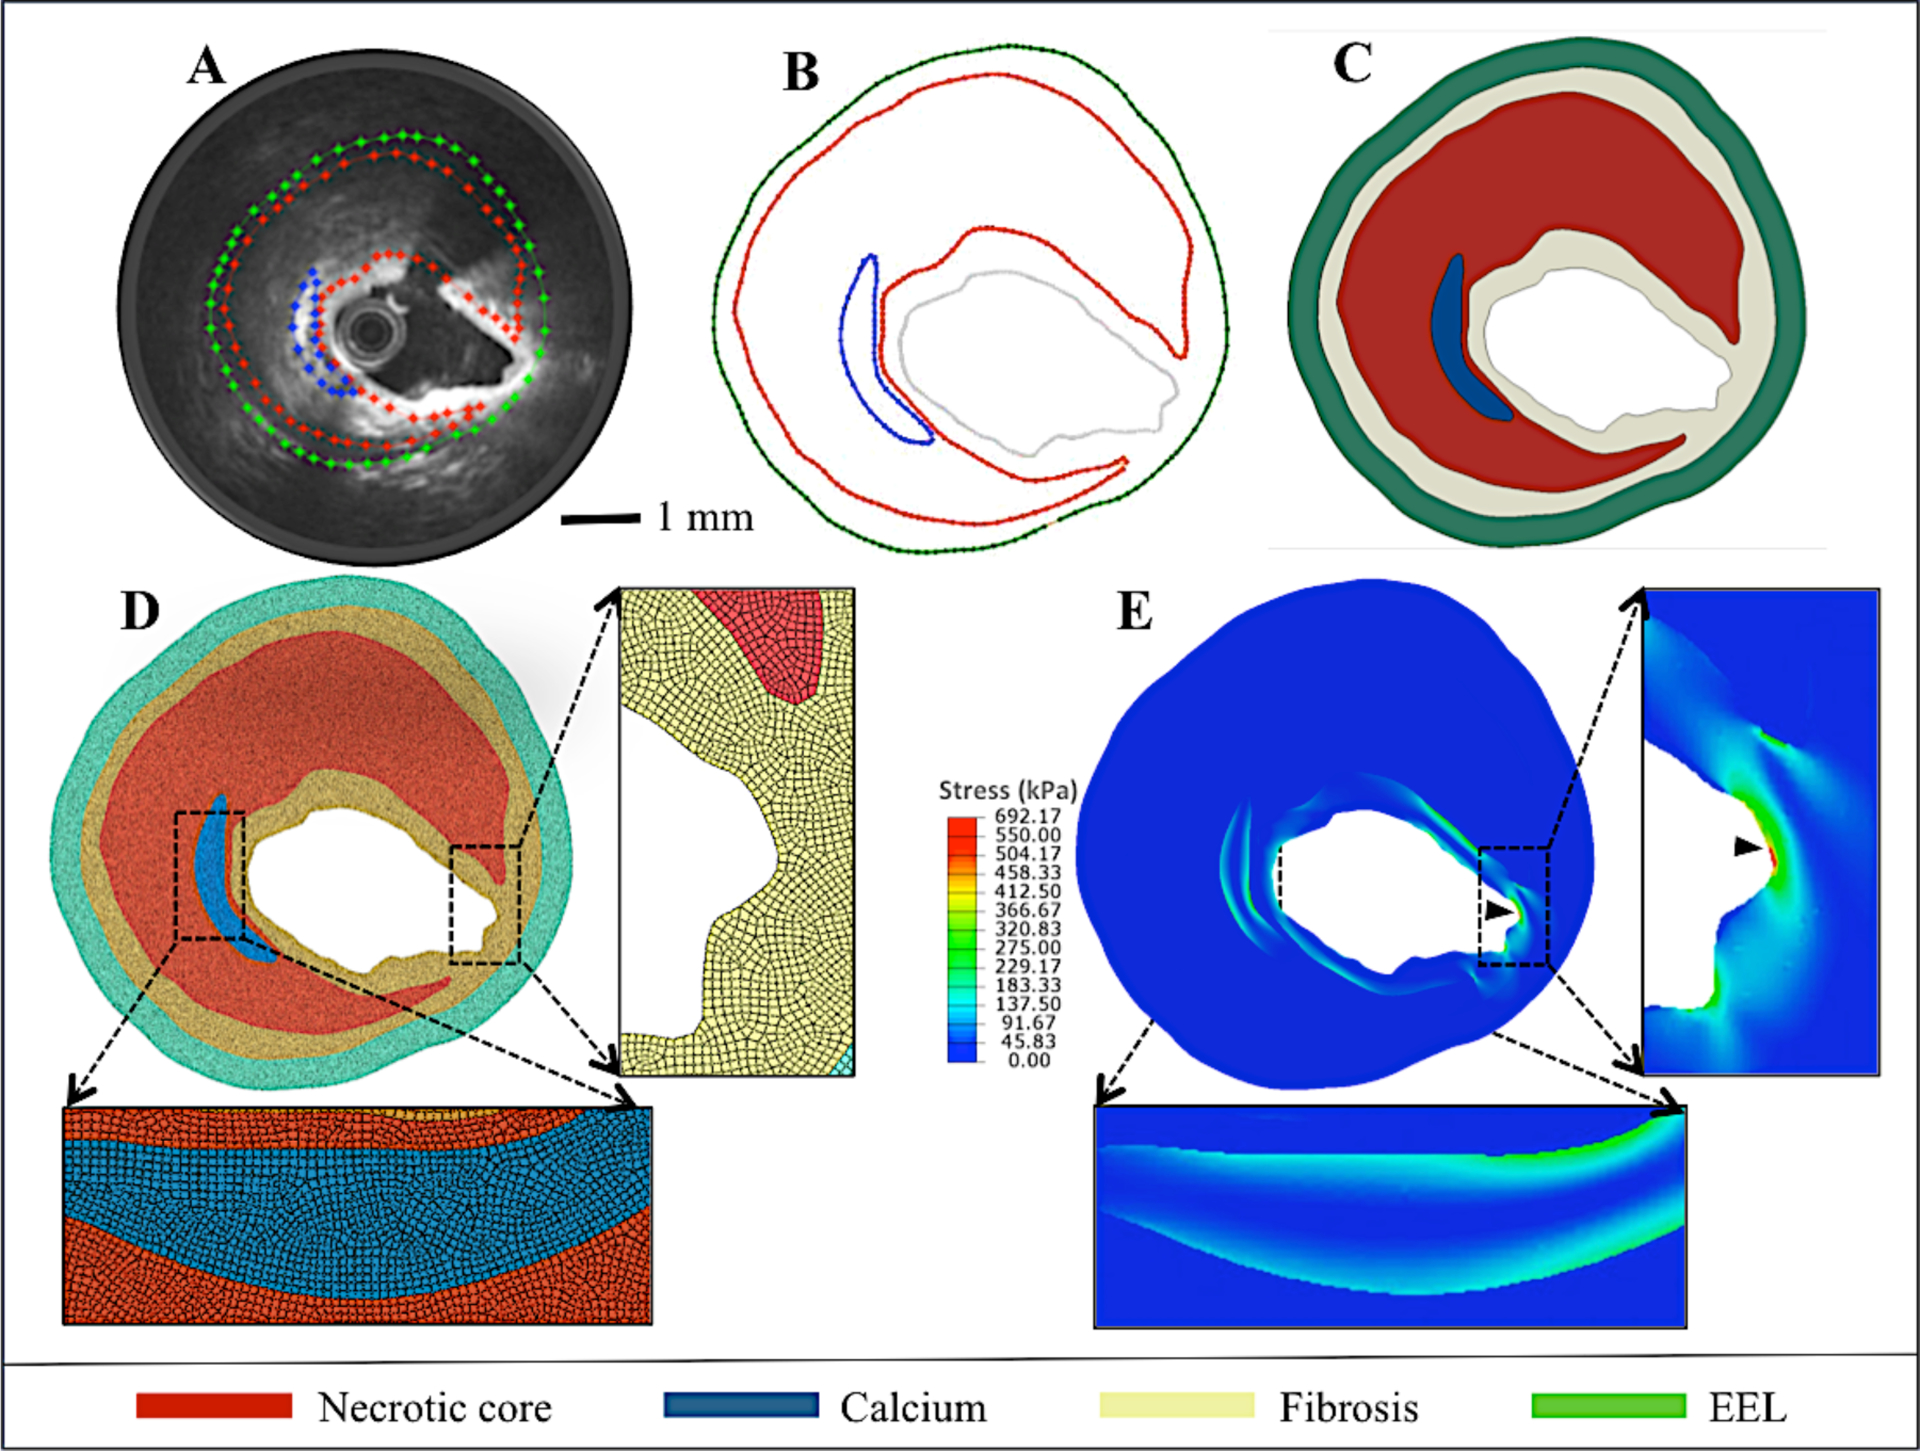
(A) OFDI-IVUS overlay of a NCFA cross-section showing plaque contours. (B) Extracted contours from (A), (C) Plaque geometry reconstructed from the contours, (D) Finite element quadrangular mesh with inlay showing magnified image of fine mesh. (E) Tensile stress distribution calculated using FEM analysis. (Arrow head shows peak stress location).
Mesh generation and modal solution:
The segmented plaque geometries were meshed with two-dimensional, six-node triangular and eight-node quadrilateral isoparametric elements. Appropriate boundary conditions (fixing two adjacent points at the outer wall of the model) and wall thickness of 300 μm was used to suppress the rigid body mothion an dradial overstretching of the artery, respectively. Static intraluminal pressure of 13.33 kPa was applied as the loading condition to mimic physiological pressure. The distribution of tensile stress was computed within each element, and the average stress of neighboring elements was calculated to obtain the tensile stress at each node. The tensile stress distribution was similarly calculated for all nodes within the coronary cross-section and the location of the maximum tensile stress (peak stress) was noted (Figure 2D).
Statistical analysis
Univariate linear regression analysis was used to analyze the extent of correlation between each of the 13 plaque parameters and the FEM-derived peak stress. Then, a stepwise multivariate regression (MVR) model (SPSS 24.0.0, IBM Computing) was utilized to determine the interdependencies between plaque variables and to identify the most influential parameters. In some cases, multiple NCFAs were identified in the same patient; therefore, the generalized estimating equation was used to account for intra-patient dependencies. In all cases, p<0.05 was considered statistically significant. The principal plaque parameters that significantly influenced the peak stress were used to derive the MSE. The accuracy of the MSE was evaluated by comparing the MSE-calculated PSM with the FEM-measured peak stress values using leave-one-out cross-validation (LOOCV) method.
RESULTS
Peak stress in NCFA lesions
The FEM-derived peak stress in 61 NCFA cross-sections ranged from 108.8–1048.0 kPa and was located at the shoulder of the NC (n=32), summit of the NC (n=11), boundary between calcium and lipid or at the edge of calcific nodule (n=10), and along the longest diameter (major axis) of the plaque (n=8) of NCFAs. Figure 3 illustrates 5 multifarious NCFAs with FCthick ranging from 96–424 μm, NCthick from 602–993 μm, arc angles of 98–302°, and with or without calcium inclusions. The OFDI images, corresponding OFDI-IVUS composite images with segmented contours, reconstructed plaque geometries, with the tensile stress distribution are displayed. Similar to other studies (Brown et al), we observed that the location of peak stress was limited to within the superficial 500um surface of the plaque. The observed stress distributions suggest that plaque morphological parameters distinctly influenced the magnitude and location of the peak stress. Similar to prior FEM studies (8,11,12,19), we observed that peak stress varied inversely with FCthick; high peak stress values were measured in NCFAs with thinner fibrous caps (Figure 3D3–D5). Furthermore, thicker NCs with large NCarc elicited high peak stress. We also observed that the presence, location and thickness of calcium modulated peak stress. Furthermore, the interactions between multiple morphometric plaque parameters greatly influenced the magnitude and location of peak stress. For instance, due to the presence of a thin calcium near the lumen, an elevated peak stress of 321 kPa (Figure 3D2) was measured in the NCFA with the smallest arc angle (98°) and a peak stress of 703 kPa (Figure 3D5) was measured in the NCFA with a relatively thicker fibrous cap (116 μm). A high peak stress of 579 kPa was observed at the summit of the plaque with a thick NC and large arc angle as seen in Figure 3D4.
Figure 3: Multifarious coronary NCFA geometries in patients.
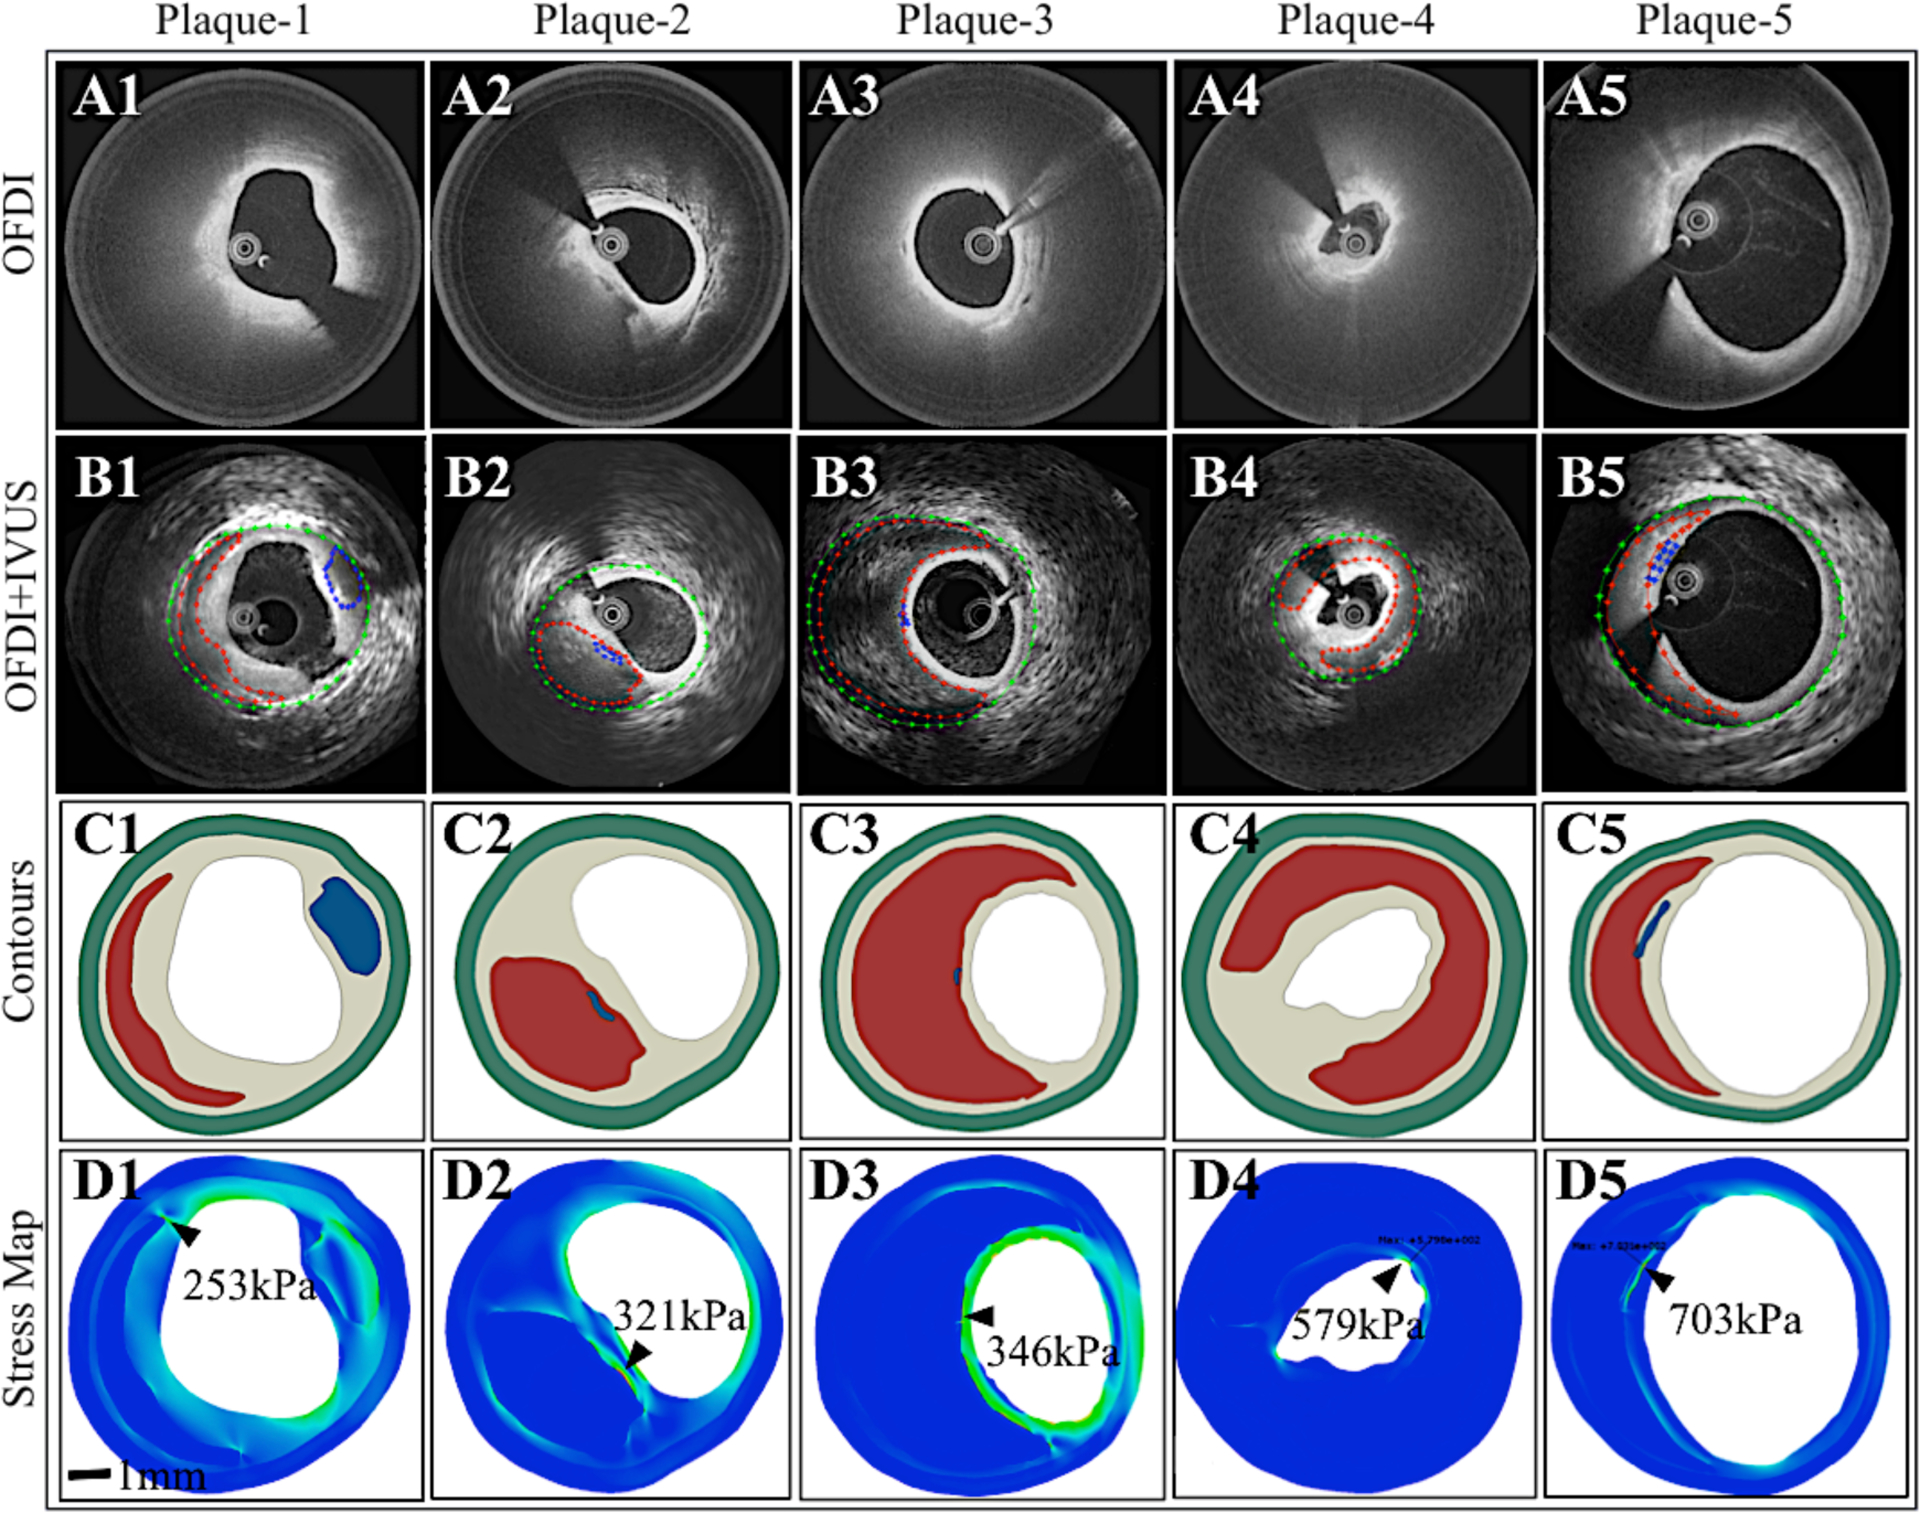
(A1–5) OFDI, (B1–5) Combined OFDI-IVUS with plaque contours, (C1–5) Plaque geometry reconstructed from the contours, and (D1–5) Maps of tensile stress distribution calculated via FEM. A large range of peak stress values (shown by black arrow heads) is observed in the five NCFAs influenced by plaque geometry.
Correlation between plaque parameters and FEM-derived peak stress
The correlation between FEM-derived peak stress and the following 13 plaque parameters was investigated: FCthick, NCthick, NCarc, CSAlumen, NCCalarea, Plqarea, Calthick, Caldepth, Plqthick, NCarea, Calarea, Totarea, and %AS. The mean±SD for each plaque parameter is shown in Table 1. First, by univariate linear regression analysis, we identified FCthick, NCarc, NCthick, Plqthick, CSAlumen, NCCalarea, Plqarea, and Totarea as the 8 parameters that significantly correlated with FEM-derived peak stress (Figure 4). While 7 plaque parameters showed a linear trend, a nonlinear relationship was observed between FEM-derived peak stress and FCthick, and the best fit was obtained using power law (8,11,12).
Table 1.
The correlation between FEM-derived peak stress and the imaging plaque parameters: The mean, standard deviation, R and p-values
| Plaque parameter | Mean±SD | R | p-value |
|---|---|---|---|
| * Fibrous cap thickness (FCthick) | 0.22±0.13 mm | 0.73 | 0.0001 |
| *NC thickness (NCthick) | 0.74±0.33 mm | 0.71 | 0.0001 |
| * NC arc angle (NCarc) | 158°±81° | 0.53 | 0.0001 |
| * Lumen cross-sectional area (CSAlumen) | 6.89±3.62 mm2 | 0.35 | 0.007 |
| * NC plus calcium area (NCCalarea) | 3.58±2.89 mm2 | 0.62 | 0.0001 |
| * Plaque area (Plqarea) | 8.99±3.79 mm2 | 0.60 | 0.0001 |
| Calcium thickness (Calthick) | 0.29±0.19 mm | 0.03 | 0.89 |
| Calcium depth (Caldepth) | 0.31±0.17 mm | 0.32 | 0.11 |
| Plaque thickness (Plqthick) | 1.45±0.43 mm | 0.39 | 0.003 |
| NC area (NCarea) | 3.41±2.87 mm2 | 0.58 | 0.0001 |
| Calcium area (Calarea) | 0.60±0.55 mm2 | 0.32 | 0.09 |
| Total area (Totarea) | 15.9±5.41 mm2 | 0.54 | 0.0001 |
| %Area stenosis (%AS) | 34.9±22.8% | 0.10 | 0.46 |
Asterisk indicates the most influential independent plaque parameters.
Figure 4: Influence of various plaque parameters on peak stress.
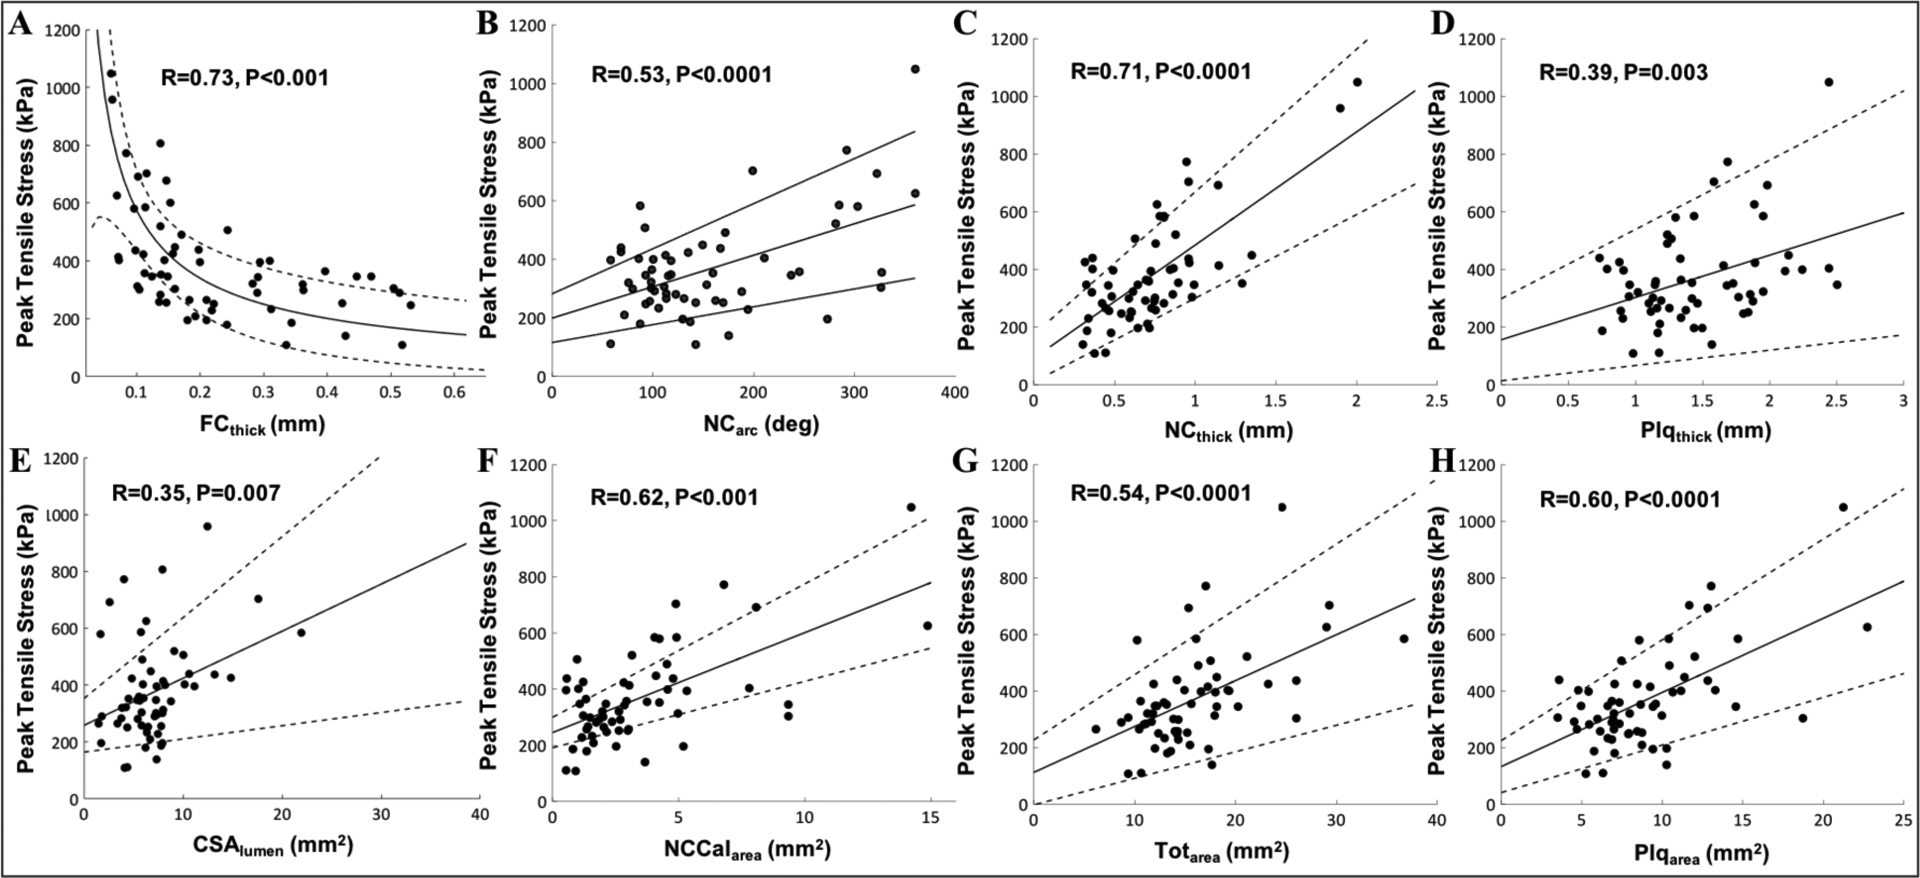
A strong positive correlation is observed between peak stress and (A) fibrous cap thickness (r=0.73, p<0.0001), (B) NC arc angle (r=0.53, p<0.0001), (C) NC thickness (r=0.71, p<0.0001), (D) Plaque thickness (r=0.39, p<0.003), (E) Lumen cross-sectional area (r=0.35, p = 0.007), (F) NC including calcium area (r=0.62, p<0.0001), (G) Total area (r=0.54, p<0.0001), and (H) Plaque area (r=0.60, p<0.0001).
Most influential parameters and the multifactorial stress equation (MSE)
We used stepwise MVR analysis to identify the most influential plaque parameters and exclude redundant variables (Table 2). We observed that both plaque thickness and total area were excluded by the multivariate stepwise regression analysis from the predictor list. This was because, plaque thickness was found to be collinear with the plaque area. On the other hand, total area was found to be redundant as it is the sum of lumen and plaque areas, and was excluded from the final MSE model. Thus, only the following 6 parameters (out of the initial 13) independently influenced peak stress and were used to develop the MSE: FCthick (p<0.0001), NCarc (p=0.024), NCthick (p<0.0001), CSAlumen (p<0.0001), NCCalarea (p=0.017), and Plqarea (p=0.003). Consequently, using the regression coefficients (Bi) (Table 2), the MSE was developed by combining the cumulative interactions of 6 plaque parameters to compute the PSM as:
| (Eqn. 1) |
Table 2.
Multivariate Regression Analysis to identify the most influential plaque parameters
| Plaque Parameter | Unstandardized Coefficient | Stan Coef. | 95% CI | Sig. | Collinearity Statistics | |||
|---|---|---|---|---|---|---|---|---|
| Std. Error | Upper Bound | p-value | VIF | |||||
| (Constant) | 50.99 | 99.4 | .991 | |||||
| FCthick (mm) | 41.33 | −.210 | −65.0 | .000 | 1.948 | |||
| NCarc (°) | 0.269 | .275 | 1.13 | .024 | 2.666 | |||
| NCthick (mm) | 39.27 | .381 | 300 | .000 | 1.660 | |||
| CSAlumen (mm2) | 3.160 | .496 | 29.7 | .000 | 1.918 | |||
| NCCalarea (mm2) | 14.13 | .504 | 61.3 | .017 | 9.834 | |||
| Plqarea (mm2) | 9.950 | −.600 | −10.2 | .003 | 9.406 | |||
B - Regression coefficients, Std.Error - Standard error, Stan Coef. - Standardized coefficients, CI – Confidence intervals, P-value - Statistical significance
MSE versus FEM-derived peak stress
To evaluate the accuracy of the MSE in estimating peak stress directly from plaque parameters, the MSE-calculated PSM (using Eqn. 1) was compared against FEM-derived peak stress using the LOOCV method. Excellent correlation (R=0.85, p<0.0001) was observed (Figure 5A) between PSM and FEM-derived peak stress in 61 NCFA cross-sections, confirming the accuracy of the MSE. Figure 5B shows the results of the Bland-Altman analysis with a negligible bias of 0.27kPa in the MSE estimation of peak stress. These results demonstrate that the absolute values of PSM calculated by MSE are similar to those computed by FEM, suggesting that the MSE strategy may be used interchangeably with the FEM approach.
Figure 5: Comparison of peak stress metric measured by the MSE versus FEM.
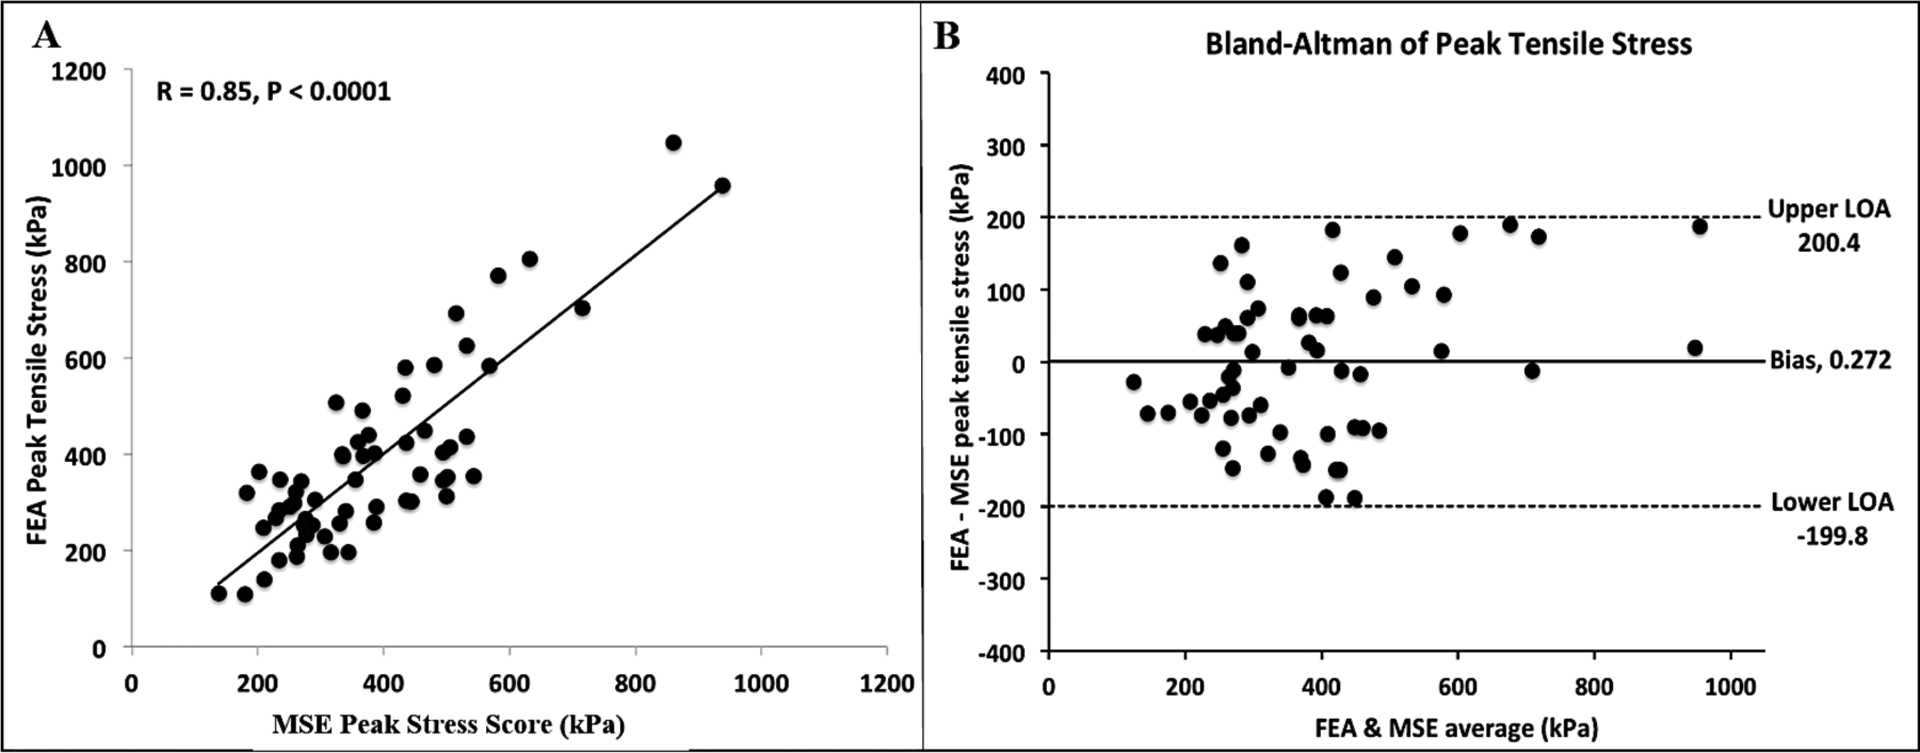
(A) MSE-measured PSM compared with FEM-derived values using leave-one-out-cross-validation (LOOCV) method shows high correlation between both methods (R = 0.85, p<0.0001), and (B) Bland-Altman plot indicates high concordance in measurements between MSE and FEM.
Influence of plaque parametes on MSE-derived peak stress
In 61 unruptured NCFAs from 30 patients, 195 image pairs selected at 1mm increments along the length of the NCFA were analyzed using the MSE (Eqn. 1) to identify cross-sections with the highest PSM value. We observed that cross-sections with the highest PSM along the NCFA length coincided with the locations of the thinnest fibrous caps in 56% (n=34) of plaques; whereas in 44% (n=27) of plaques, the highest PSM occurred at cross-sections distinct from that of the thinnest fibrous cap. In other words, in only 56% of cases, fibrous cap thickness was one of the determining factors in identifying the highest PSM location. Furthermore, fibrous cap thickness was the sole determining factor in only 7% of cases with the highest PSM, and a combination of parameters including the fibrous cap thickness influenced the highest PSM in 49% of cases (Figure S2). In the remainder 44% of plaques in which FCthick was not a determining factor, the highest PSM was found at cross-sectional frames with the largest NCthick (7%, n=4), CSAlumen (5%, n=3), NCarc (3%, n=2), Plqarea (3%, n=2), NCCalarea (2%, n=1), and a combination of othe plaque parameters (24%, n=15) that did not include the FCthick parameter.
Locating ruptured NCFAs in patients
Finally, we assessed the ability of the MSE to locate plaque ruptures in 3 patients with ruptured NCFAs observed at the sites of culprit thrombi. Figures 6A1–A3 show the PSM values measured at 2mm intervals from 3 coronary segments by retrieving the plaque parameters from each cross-section and simply substituting the values into the MSE. Figure 6B1–B3 displays 2D cross-sectional OFDI images at 5 discrete locations along each coronary pullback; the coronary cross-section with the maximum PSM is highlighted in red. Subsequently, we observe that the location of the maximum PSM with black asterisks is in close proximity with the plaque rupture sites in all three patients (Figure 6C1–C3). These results suggest that the MSE-calculated PSM may accurately locate potential plaque rupture site in patients.
Figure 6: Locating the culprit plaque rupture using the MSE tool.
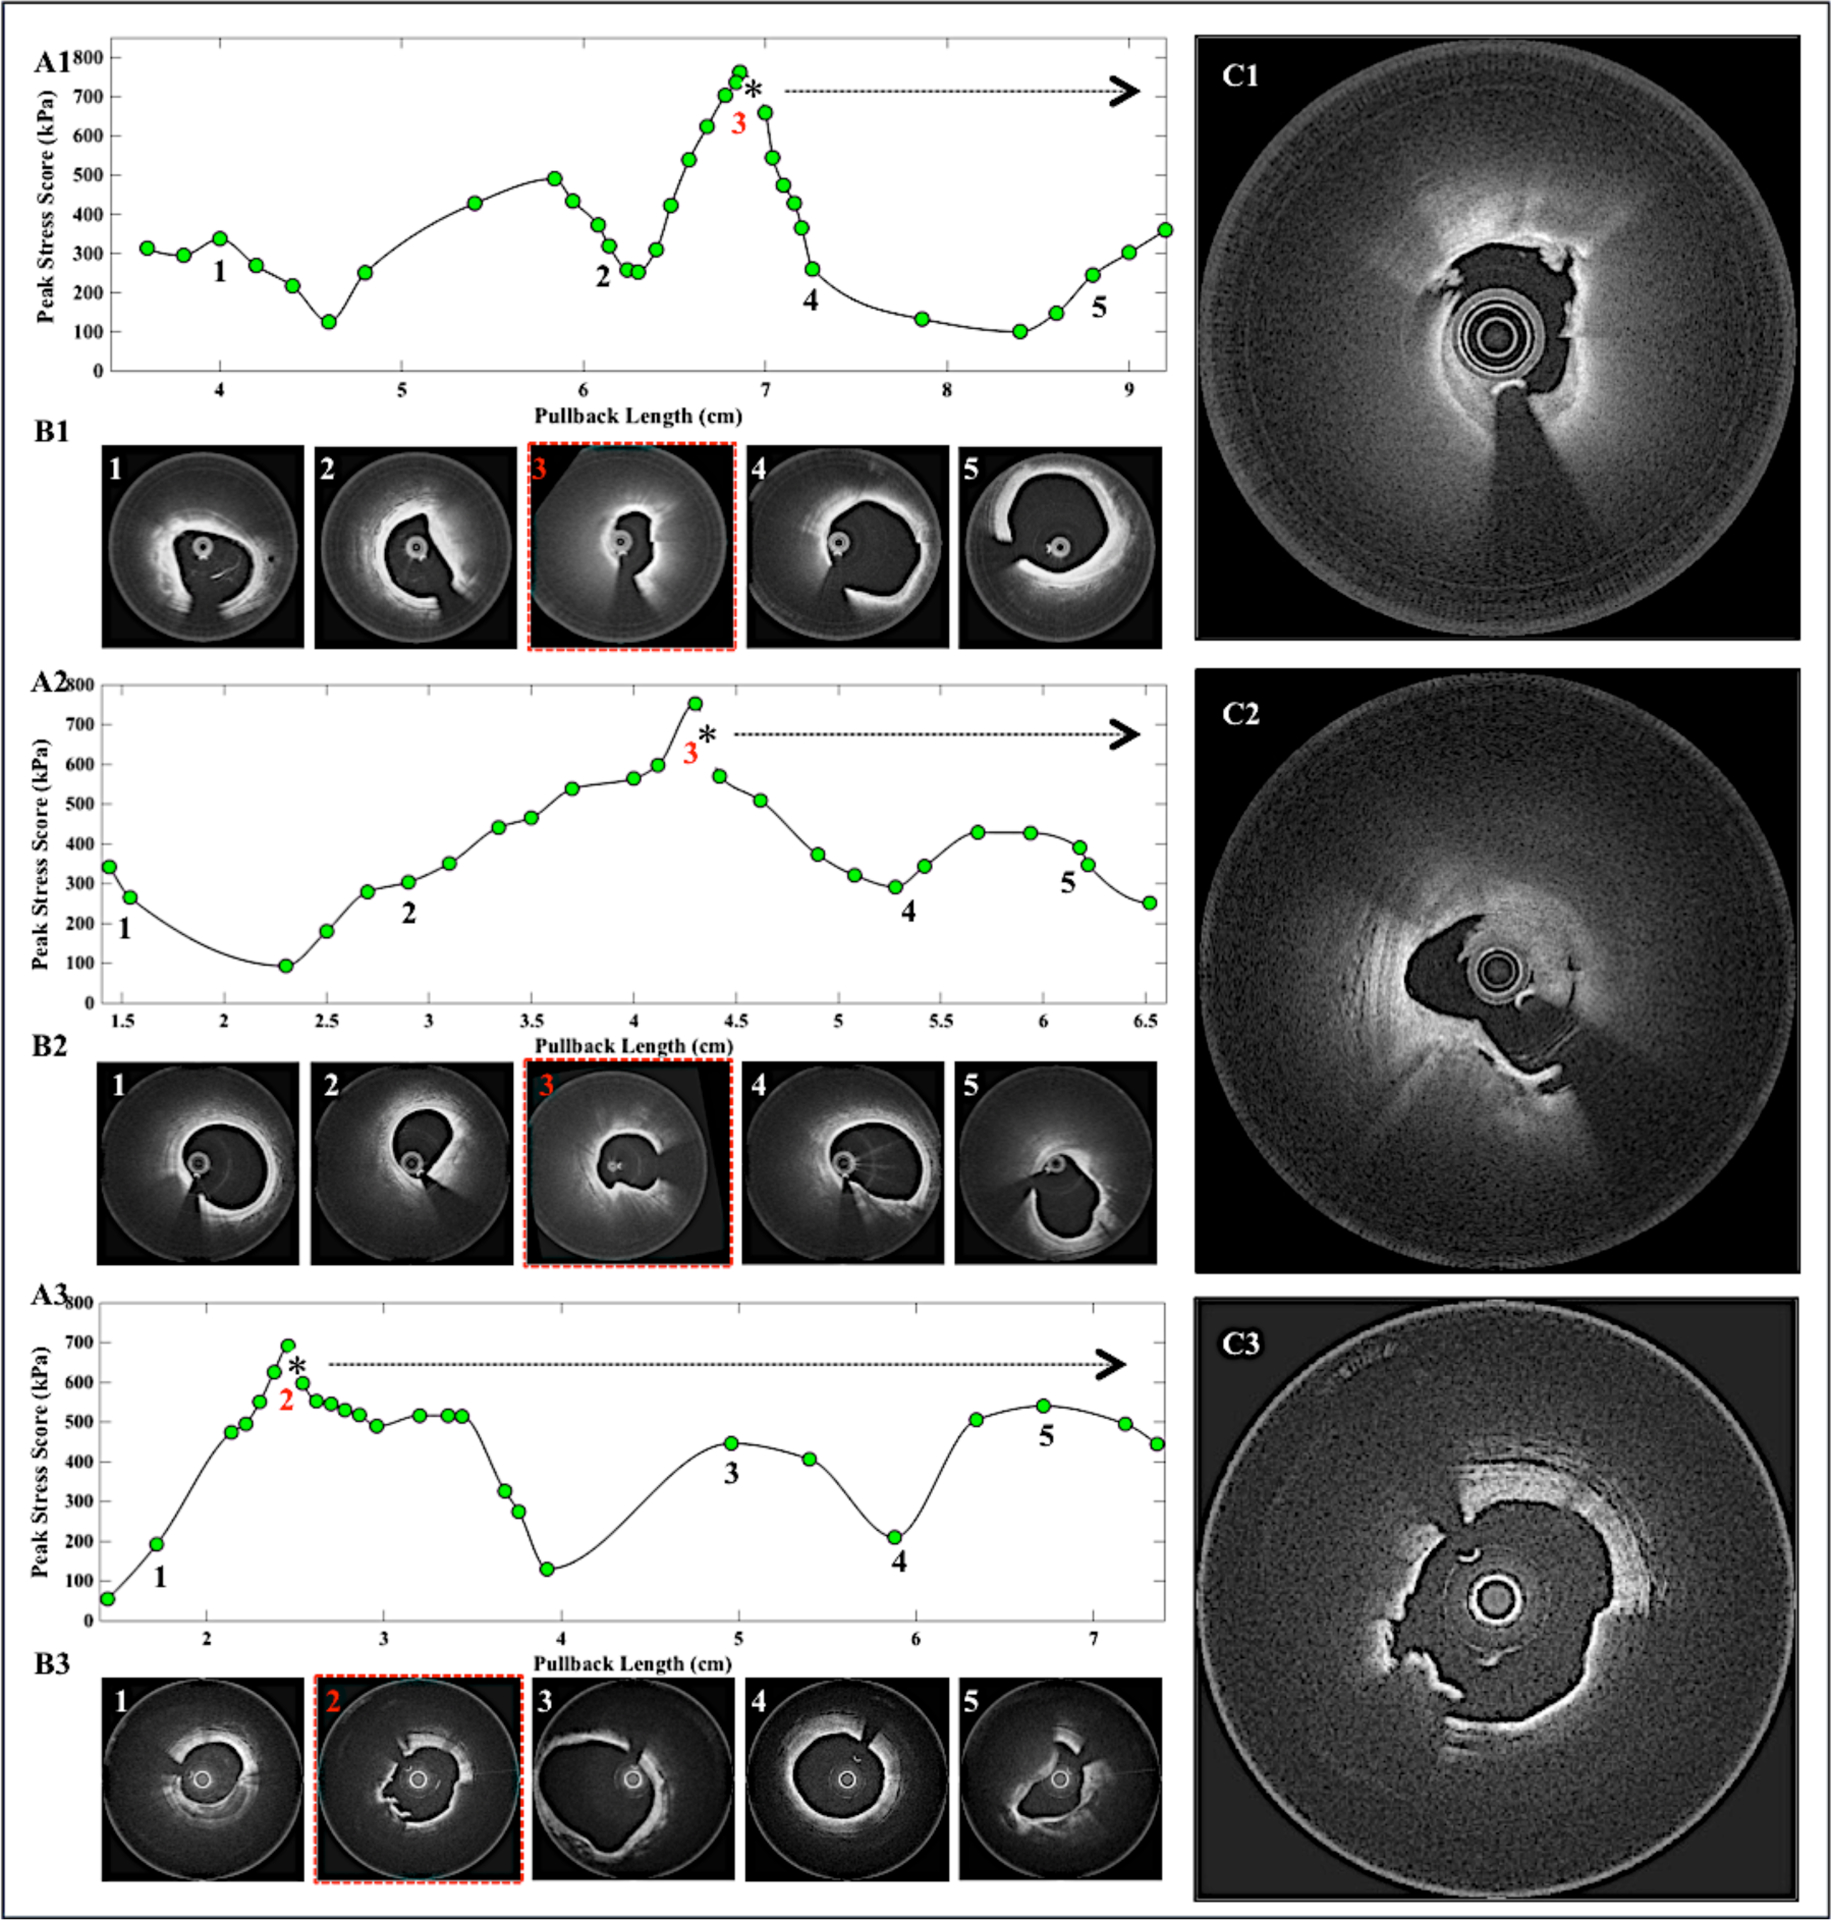
(A1-A3) Peak stress metric measured by MSE is plotted as a function of OFDI pullback distance for three patients with plaque ruptures at the site of culprit thrombi. (B1-B3) The OFDI cross-sections show the corresponding 5 locations of PSM. Images highlighted in red points to the cross-section with the maximum peak stress location. (C1-C3) The culprit rupture sites with thrombi, which corresponds to the locations of the asterisks in A1-A3. The culprit rupture site was located adjacent to the location of the maximum PSM.
DISCUSSION
The tensile stress distribution in NCFAs, particularly peak stress in the fibrous cap, is a crucial predictor of plaque rupture and MACE in patients (12–15). The traditional FEM modeling approach used to compute peak stress is mathematically-complex, requires specialist operators, and takes hours to report results. To our knowledge, this is the first study to demonstrate that PSM can be readily calculated directly from morphometric measurements derived from plaque geometry. Our results show that MSE-measured PSM values are essentially identical to those obtained by FEM, suggesting that MSE may circumvent the need for mathematically-complex and time-intensive FEM approaches to measure plaque stress. Consequently, in a pilot test in 3 patients, we showed that the locations of elevated PSM coincided with sites of ruptured plaques.
A key finding of our study is that peak stress in the fibrous cap can be directly estimated via a closed-form equation (Eqn. 1). Similar to other studies (8,11,12), we demonstrated a non-linear relationship (Figure 4A) between peak stress and FCthick. Although the critical FCthick of <65 μm has been extensively reported in literature as a major determinant of plaque vulnerability (1,18), our study demonstrated that under certain conditions, NCFA’s with thicker FCthick similarly exhibited elevated peak stress. We further observed that in plaques with thicker caps (>200 μm), the peak stress is only minimally influenced by FCthick, where NCthick was the major determinant of PSM. Whereas, when FCthick is reduced below 200 μm, peak stress is exponentially elevated (Figure 4A). Similar to our results, other studies also showed that peak stress is increased with increasing luminal area, lumen eccentricity, NC thickness, NC area/arc, and arterial remodeling index (12,15). In addition, we observed that peak stress is more strongly associated with variables such as FCthick, NCarc, and NCarea rather than %AS, supporting the fact that plaques with mild to moderate stenosis may also be prone to rupture.
Interestingly, in our study only 56% of the plaques elicited the highest PSM at the frame with the thinnest cap location, and that FCthick was a sole determining factor in only 7% of plaques. In fact, prior histopathological and clinical OFDI studies have suggested that ruptured NCFAs are often observed in locations with thicker fibrous caps, calcific nodules and increased plaque burden (5–7). Our results similarly showed that FCthick did not influence the highest PSM in 44% of NCFAs and that other parameters including NCthick, NCarc, Plqarea, NCCalarea and CSAlumen were the determining factors in these cases. The results likely provide a quantitative biomechanical corroboration for the above clinical observations and provide a unique opportunity for further investigations.
Consistent with previous studies implicating the influence of calcium (14,20), our study demonstrated that peak stress was influenced by the presence, location and area of calcification in the coronary cross-section. When evaluated as an independent variable Calarea indicated moderate correlation with peak stress (R=0.35, p<0.01). However, the overlap of calcification with the NC, specifically the sum of NCarea and Calarea, significantly influenced the peak stress (R=0.62, p<0.0001). These results suggest that in addition to the presence of calcification, the vicinity of calcium deposits with NC is likely an important mediator of plaque rupture. We noticed that peak stress was considerably elevated when a thin calcific nodule (Calthick<200 μm) was located in the vicinity of the lumen (CalLudist<200 μm).
Other biomechanical analysis studies using FEM indicate a large variability in peak stress values (100 – 900 kPa) measured in ruptured and intact coronary plaques in patients with ACS (21–23). In this study, we observed peak stress values ranging from ~100 kPa to 1000 kPa even in non-disrupted plaques. These differences may be attributed to a larger percentage of ACS patients (40%) included in our study who had larger NC plaques with increased overall plaque burden. Thus, it is likely that plaques with complex geometries, irregular luminal boundaries, and heterogeneous sub-intimal structures resulted in greater stress concentrations in our study than previously reported ranges. Furthermore, majority of plaques in our study contained calcific nodules, which could amplify the measured peak stress by up to 5-fold (20). The MSE approach described here will likely open critical opportunities for clinical investigations to determine the range of peak stress values in ACS vs SA patients.
In a separate pilot study conducted in 10 cadaveric hearts, we confirmed that composite OFDI and IVUS imaging improved the accuracy of quantifying plaque morphological parameters compared to the sole use of IVUS or OFDI (see Supplementary materials, Figures S1). This is because OFDI is superior to IVUS in detecting sub-surface thin caps, microcalcifications, and minute irregularities with exquisite spatial resolution of ~10μm. However, due to high forwardly-directed scattering of light in lipid, the OFDI signal is rapidly attenuated in the NC obscuring the determination of the NC outer boundary. On the other hand, IVUS provides a large imaging depth albeit at reduced spatial resolution for measuring plaque outer boundaries. Consequently, we further showed that composite OFDI-IVUS determination of plaque geometry significantly improved the accuracy of estimating PSM compared to the sole OFDI or IVUS (Figure S2 and Table S3). These additional studies detailed in the Supplementary materials substantially confirm the utility of composite OFDI-IVUS imaging in determining plaque parameters for biomechanical analyses.
In the current study, separate OFDI pull-backs were performed following IVUS via the same guide wire using an imaging protocol that has been well established (24,25). Given the rapid imaging speeds of OFDI, a typical 40mm coronary segment can be safely imaged in 2s at a catheter pull-back speed of 20mm/s with only 6mL of additional contrast.
In our study, FEM was used purely for the purpose of obtaining reference peak stress values and to derive the MSE (Eqn.1). We further compared MSE-calculated PSM with the FEM-derived peak stress in 61 unruptured NCFAs. The excellent correlation with high concordance and low measurement bias between the two approaches (Figure 5), shows that MSE can be used interchangeably to replace FEM. Thus, in practice, in a subset of 3 patients with ruptured NCFAs (Figure 6), via straightforward MSE measurements, we observed that peak stress was significantly elevated in the vicinity of the rupture site. While further validation through prospective clinical testing is warranted, this initial result is yet significant because it indicates that just six morphometric measurements of plaque geometry may accurately localize rupture-prone sites.
Study Limitations:
In the patient cohort investigated in this study, ruptured plaques were observed in only 3 patients; therefore, the MSE was applied to identify rupture sites in only these patients. Furthermore, due to the presence of culprit thrombi in the field-of-view that obscured our ability to view sub-surface plaque morphology, we were unable to calculate the PSM at the precise image frame of the rupture site. Therefore, it is likely that the PSM value measured at the rupture site may have exceeded the observed PSM value at the adjacent site. Future prospective, longitudinal clinical studies will be necessary to conclusively determine the range of PSM values associated with plaque ruptures. In this study, the most time-consuming post-processing step involved OFDI-IVUS image co-registration through identification of image landmarks (Methods above) which added additional processing time and complexity. Recently, bi-modality imaging systems have been FDA-approved and likely will be soon available for patient-use to enable tandem OFDI-IVUS imaging via a single integrated catheter, which will further reduce procedure time, patients risks and post-processing complexities (26,27) (www.conavi.com). Following image co-registration in our study, plaque segmentation and parameter calculation parameter was done in just 2min, with an additional 5s for the MSE calculation of PSM for composite image-pair. The use of 2D FEM in this study did not take into account the longitudinal shape of tortuosity of the coronary wall and out-of-plane deformations that might influence stress distributions. This was because, coronary catheterization in patients was performed in conjunction with single-plane angiography, thereby precluding the evaluation of 3D coronary vessel shape. In the future, the use of biplane angiography or CT angiography (CTA) may allow us to include these additional parameters into a further refined MSE model that includes longitudinal coronary geometry and tortuosity metrics. It is important to note however that major drawbacks of biplane angiography and CTA include the substantial increase in procedure time, constrast volume, radiation dose and cost (14); therefore, these approaches may mot be suitable for routine PCI procedures. Future studies in patients may likely allow us to investigate the comparative effectiveness of including 3D geometry metrics in predicting plaque rupture in patients and may help in identifying patient sub-groups that may benefit from the inclusion of biplane angiography or CTA.
Conclusions
We present a novel and straightforward approach to estimate peak stress in coronary plaques. With a simple analytical equation that defines the cumulative influence of 2D plaque geometry, we demonstrated that the PSM could be accurately estimated, which may potentially serve as a pivotal biomechanical indicator of plaque rupture risk in patients. Consequently, this new approach obviates the need for tedious and mathematically-intensive FEM. In the future, we anticipate that the MSE tool could be used in conjunction with routine OFDI and IVUS evaluation, which will likely open the powerful opportunity to calculate a critical mechanical metric associated with plaque rupture and acute coronary events in patients.
Supplementary Material
ACKNOWLEDGEMENTS
We thank Dr. Hang Lee from Harvard Catalyst program for providing statistical consultation on data analysis and Xuan Pei for her assistance with the ABAQUS software. The retrospective analysis of OFDI and IVUS images in this study was supported in part by NHLBI RO1 HL119065 (to S.K.N).
This work was supported by the National Institute of Health contract NIH RO1HL119065 (to S.K.N.) and in part by Terumo Corporation.
Abbreviations
- AMI
acute myocardial infarction
- ACS
acute coronary syndrome
- Calarea
calcium area
- Caldepth
position of calcium relative to the lumen
- Calthick
calcium thickness
- CSAlumen
lumen cross-sectional area
- CT
computed tomography
- FCthick
fibrous cap thickness
- FEM
finite element modeling
- IVUS
intravascular ultrasound
- LOOCV
leave one out cross validation
- MVR
multi variate regression
- MACE
major adverse cardiovascular events
- MSE
multifactorial stress equation
- NC
necrotic core
- NCarc
necrotic core arc angle
- NCarea
necrotic core area
- NCCalarea
necrotic core including calcium area
- NCFA
necrotic core fibroatheroma
- NCthick
necrotic core thickness
- OFDI
optical frequency domain imaging
- PCI
percutaneous coronary intervention
- Plqarea
plaque area
- Plqthick
plaque thickness
- PSM
peak stress metric
- TCFA
thin cap fibroatherma
- Totarea
total area
- %AS
%area stenosis
- VH
virtual histology
REFERENCES
- 1.Virmani R, Kolodgie FD, Burke AP, Farb A, Schwartz SM. Lessons from sudden coronary death: a comprehensive morphological classification scheme for atherosclerotic lesions. Arteriosclerosis, thrombosis, and vascular biology 2000;20:1262–1275. [DOI] [PubMed] [Google Scholar]
- 2.Finn AV, Nakano M, Narula J, Kolodgie FD, Virmani R. Concept of vulnerable/unstable plaque. Arteriosclerosis, thrombosis, and vascular biology 2010;30:1282–1292. [DOI] [PubMed] [Google Scholar]
- 3.Kubo T, Imanishi T, Takarada S et al. Assessment of culprit lesion morphology in acute myocardial infarction: ability of optical coherence tomography compared with intravascular ultrasound and coronary angioscopy. Journal of the American College of Cardiology 2007;50:933–939. [DOI] [PubMed] [Google Scholar]
- 4.Brugaletta S, Garcia-Garcia HM, Serruys PW et al. NIRS and IVUS for characterization of atherosclerosis in patients undergoing coronary angiography. JACC: Cardiovascular Imaging 2011;4:647–655. [DOI] [PubMed] [Google Scholar]
- 5.Cheruvu PK, Finn AV, Gardner C et al. Frequency and distribution of thin-cap fibroatheroma and ruptured plaques in human coronary arteries: a pathologic study. Journal of the American College of Cardiology 2007;50:940–949. [DOI] [PubMed] [Google Scholar]
- 6.Serruys PW, Garcia-Garcia HM, Regar E. From postmortem characterization to the in vivo detection of thin-capped fibroatheromas: the missing link toward percutaneous treatment: what if Diogenes would have found what he was looking for? : Journal of the American College of Cardiology, 2007. [DOI] [PubMed] [Google Scholar]
- 7.Toutouzas K, Karanasos A, Tsiamis E et al. New insights by optical coherence tomography into the differences and similarities of culprit ruptured plaque morphology in non–ST-elevation myocardial infarction and ST-elevation myocardial infarction. American heart journal 2011;161:1192–1199. [DOI] [PubMed] [Google Scholar]
- 8.Loree HM, Kamm RD, Stringfellow RG, Lee RT. Effects of fibrous cap thickness on peak circumferential stress in model atherosclerotic vessels. Circulation research 1992;71:850–858. [DOI] [PubMed] [Google Scholar]
- 9.Sangiorgi G, Taylor AJ, Farb A et al. Histopathology of postpercutaneous transluminal coronary angioplasty remodeling in human coronary arteries. American heart journal 1999;138:681–687. [DOI] [PubMed] [Google Scholar]
- 10.Thondapu V, Bourantas CV, Foin N, Jang I-K, Serruys PW, Barlis P. Biomechanical stress in coronary atherosclerosis: emerging insights from computational modelling. European heart journal 2016:ehv689. [DOI] [PubMed] [Google Scholar]
- 11.Speelman L, Akyildiz A, Den Adel B et al. Initial stress in biomechanical models of atherosclerotic plaques. Journal of biomechanics 2011;44:2376–2382. [DOI] [PubMed] [Google Scholar]
- 12.Ohayon J, Finet G, Gharib AM et al. Necrotic core thickness and positive arterial remodeling index: emergent biomechanical factors for evaluating the risk of plaque rupture. American journal of physiology-heart and circulatory physiology 2008;64:H717. [DOI] [PMC free article] [PubMed] [Google Scholar]
- 13.Brown AJ, Teng Z, Calvert PA et al. Plaque Structural Stress Estimations Improve Prediction of Future Major Adverse Cardiovascular Events After Intracoronary ImagingCLINICAL PERSPECTIVE. Circulation: Cardiovascular Imaging 2016;9:e004172. [DOI] [PubMed] [Google Scholar]
- 14.Teng Z, Brown AJ, Calvert PA et al. Coronary Plaque Structural Stress Is Associated With Plaque Composition and Subtype and Higher in Acute Coronary SyndromeCLINICAL PERSPECTIVE. Circulation: Cardiovascular Imaging 2014;7:461–470. [DOI] [PubMed] [Google Scholar]
- 15.Costopoulos C, Huang Y, Brown AJ et al. Plaque Rupture in Coronary Atherosclerosis Is Associated With Increased Plaque Structural Stress. JACC: Cardiovascular Imaging 2017;10:1472–1483. [DOI] [PMC free article] [PubMed] [Google Scholar]
- 16.Ohayon J, Finet G, Treyve F, Rioufol G, Dubreuil O. A three-dimensional finite element analysis of stress distribution in a coronary atherosclerotic plaque: In-vivo prediction of plaque rupture location. Biomechanics applied to computer assisted surgery 2005;37:225–241. [Google Scholar]
- 17.Villiger M, Otsuka K, Karanasos A et al. Repeatability assessment of intravascular polarimetry in patients. IEEE Transactions on Medical Imaging 2018. [DOI] [PMC free article] [PubMed] [Google Scholar]
- 18.Narula J, Nakano M, Virmani R et al. Histopathologic characteristics of atherosclerotic coronary disease and implications of the findings for the invasive and noninvasive detection of vulnerable plaques. Journal of the American College of Cardiology 2013;61:1041–1051. [DOI] [PMC free article] [PubMed] [Google Scholar]
- 19.Finet G, Ohayon J, Rioufol G. Biomechanical interaction between cap thickness, lipid core composition and blood pressure in vulnerable coronary plaque: impact on stability or instability. Coronary artery disease 2004;15:13–20. [DOI] [PubMed] [Google Scholar]
- 20.Kelly-Arnold A, Maldonado N, Laudier D, Aikawa E, Cardoso L, Weinbaum S. Revised microcalcification hypothesis for fibrous cap rupture in human coronary arteries. Proceedings of the National Academy of Sciences 2013;110:10741–10746. [DOI] [PMC free article] [PubMed] [Google Scholar]
- 21.Holzapfel GA, Mulvihill JJ, Cunnane EM, Walsh MT. Computational approaches for analyzing the mechanics of atherosclerotic plaques: a review. Journal of biomechanics 2014;47:859–869. [DOI] [PubMed] [Google Scholar]
- 22.Kok AM, Speelman L, Virmani R, Steen AF, Gijsen FJ, Wentzel JJ. Peak cap stress calculations in coronary atherosclerotic plaques with an incomplete necrotic core geometry. Biomedical engineering online 2016;15:48. [DOI] [PMC free article] [PubMed] [Google Scholar]
- 23.Cheng GC, Loree HM, Kamm RD, Fishbein MC, Lee RT. Distribution of circumferential stress in ruptured and stable atherosclerotic lesions. A structural analysis with histopathological correlation. Circulation 1993;87:1179–1187. [DOI] [PubMed] [Google Scholar]
- 24.Goyal M, Kim SW, Mishra S et al. Morphological characteristics of optical coherence tomography defined plaque fissure in patients with acute coronary syndrome. Heart and vessels 2018:1–8. [DOI] [PubMed] [Google Scholar]
- 25.Higuma T, Soeda T, Abe N et al. A combined optical coherence tomography and intravascular ultrasound study on plaque rupture, plaque erosion, and calcified nodule in patients with ST-segment elevation myocardial infarction: incidence, morphologic characteristics, and outcomes after percutaneous coronary intervention. JACC: Cardiovascular Interventions 2015;8:1166–1176. [DOI] [PubMed] [Google Scholar]
- 26.Yang H-C, Yin J, Hu C et al. A dual-modality probe utilizing intravascular ultrasound and optical coherence tomography for intravascular imaging applications. IEEE transactions on ultrasonics, ferroelectrics, and frequency control 2010;57. [DOI] [PMC free article] [PubMed] [Google Scholar]
- 27.Yin J, Li J, Chen Z et al. Novel combined miniature optical coherence tomography ultrasound probe for in vivo intravascular imaging. Journal of biomedical optics 2011;16:060505. [DOI] [PMC free article] [PubMed] [Google Scholar]
Associated Data
This section collects any data citations, data availability statements, or supplementary materials included in this article.