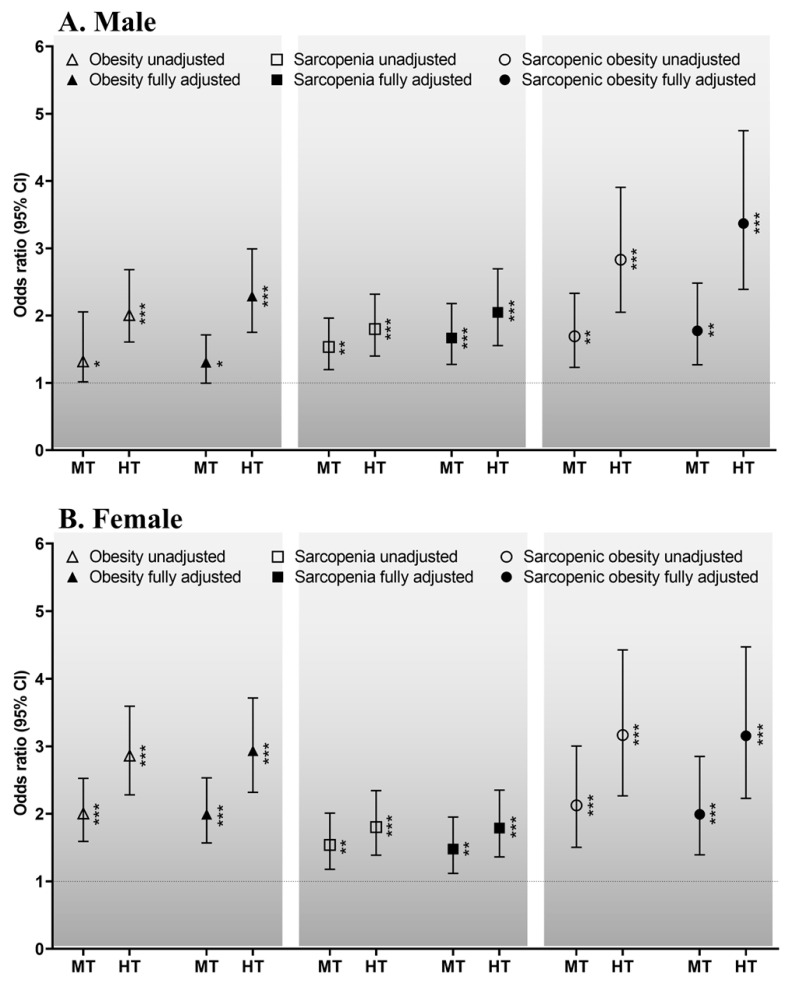
Figure 2.
Sex-specific ORs for the relationship of the TyG index with obesity, sarcopenia, and sarcopenic obesity for males (A) and females (B). Dotted line: reference; solid line: 95% confidence interval (CI); white or black triangles, rectangles, and circles: ORs. * p < 0.05, ** p < 0.01, *** p < 0.001 for the ORs for obesity, sarcopenia and sarcopenic obesity, compared with the lowest tertile. The potential confounders: age, educational level, household income, medication, smoking, alcohol consumption, moderate-to-vigorous physical activity, nutrition, and medical history. Abbreviations: HT, highest tertile; MT, middle tertile; OR, odds ratio; TyG index, triglyceride–glucose index.

