

Abstract
Single‐photon emission computed tomography (SPECT) during seizures and magnetoencephalography (MEG) during the interictal state are noninvasive modalities employed in the localization of the epileptogenic zone in patients with drug‐resistant focal epilepsy (DRFE). The present study aims to investigate whether there exists a preferentially high MEG functional connectivity (FC) among those regions of the brain that exhibit hyperperfusion or hypoperfusion during seizures. We studied MEG and SPECT data in 30 consecutive DRFE patients who had resective epilepsy surgery. We parcellated each ictal perfusion map into 200 regions of interest (ROIs) and generated ROI time series using source modeling of MEG data. FC between ROIs was quantified using coherence and phase‐locking value. We defined a generalized linear model to relate the connectivity of each ROI, ictal perfusion z score, and distance between ROIs. We compared the coefficients relating perfusion z score to FC of each ROI and estimated the connectivity within and between resected and unresected ROIs. We found that perfusion z scores were strongly correlated with the FC of hyper‐, and separately, hypoperfused ROIs across patients. High interictal connectivity was observed between hyperperfused brain regions inside and outside the resected area. High connectivity was also observed between regions of ictal hypoperfusion. Importantly, the ictally hypoperfused regions had a low interictal connectivity to regions that became hyperperfused during seizures. We conclude that brain regions exhibiting hyperperfusion during seizures highlight a preferentially connected interictal network, whereas regions of ictal hypoperfusion highlight a separate, discrete and interconnected, interictal network.
Keywords: epilepsy, functional connectivity, MEG, SPECT, cerebral blood perfusion
This is the first study to combine ictal single‐photon emission computed tomography (SPECT) and magnetoencephalography (MEG) connectivity to quantitatively investigate the resting‐state epileptic network. We found that widespread and nonadjacent areas of brain hyperperfusion, as well as hypoperfusion, during seizures are not at all arbitrary. We conclude that the combination of SPECT and MEG can provide a measurable, noninvasive, definition of patient‐specific epileptic networks.

Abbreviations
- BOLD
blood oxygenation level dependent
- DRFE
drug‐resistant focal epilepsy
- EZ
epileptogenic zone
- FC
functional connectivity
- MEG
magnetoencephalography
- PET
Positron emission tomography
- PLV
phase‐locking value
- ROI
region of interest
- SEEG
stereo‐electroencephalography
- SPECT
single‐photon emission computed tomography
- SISCOM
subtraction ictal SPECT co‐registered to MRI
1. INTRODUCTION
Growing evidence characterizes epilepsy as a disorder of brain networks involving regions extending well beyond the epileptogenic zone (EZ) (Kramer & Cash, 2012). The epileptic network constitutes structurally and functionally connected brain regions that explain the complex seizure dynamics and are essential for ictogenesis and maintenance of the epileptic condition (Spencer, 2002). Understanding the properties of the epileptic network directly contributes to more accurate localization of the EZ and advances the management of patients with drug‐resistant focal epilepsy (DRFE) including placement of intracranial electrodes and individualization of closed‐loop neuromodulation approaches for seizure control.
Advances in noninvasive imaging technologies such as magnetic resonance imaging (MRI), positron emission tomography (PET), subtraction ictal SPECT co‐registered to MRI (SISCOM), coupled with the measurement of electrophysiological activities via scalp electroencephalography (EEG), magnetoencephalography (MEG), and invasive EEG (e.g., stereo‐EEG/SEEG recordings with stereotactically placed depth electrodes) in the same patients, provide us with unique clinical opportunities to understand normal and abnormal activities of neuronal ensembles and their interactions between and during seizures. Moreover, the integration of information from various imaging and nonimaging modalities is fundamental to the generation of clinical hypotheses in the modern management of patients with DRFE (Knowlton et al., 2008). Multimodal integration allows access to complementary information and improves the understanding of the clinical presentation of an individual's neurological disorder.
Ictal SPECT utilizes isotope injection during seizures to noninvasively approximate the EZ in patients with DRFE undergoing presurgical evaluation (Kaminska et al., 2003; Newton et al., 1995). The complex hyperperfusion patterns unique to ictal SPECT reflect seizure onset and propagation pathways (Cleeren et al., 2016; Van Paesschen, 2004). We have previously shown that SPECT‐directed SEEG planning allows for a more complete electrographic sampling of salient areas, which in turn correlate with specific SEEG electrophysiological signals (power “fingerprints”) in the course of SEEG‐recorded seizures (Englot & Lagrange, 2022; Krishnan et al., 2021).
MEG relies on interictal recordings of spontaneously occurring epileptiform activities to noninvasively approximate the EZ in these patients (Murakami et al., 2016). MEG offers a direct measurement of whole‐brain neuronal activity while preserving high spatial and temporal resolution. Traditionally, MEG‐based EZ localization relies on source modeling of interictal epileptiform abnormalities. The role of functional connectivity (FC) analysis of MEG data for localization of the EZ has been gaining prominence recently (Krishnan et al., 2015). Integration of information from SPECT and MEG aids in the noninvasive presurgical evaluation of patients with DRFE (El Tahry et al., 2018; Schneider et al., 2013).
Intracranial studies have coarse spatial sampling limited by clinical considerations and ill‐posed hypotheses. Sampling using intracranial electrodes is more likely to include areas of SPECT hyperperfusion (that corresponds to the presumed seizure onset and propagation pathways) rather than areas of ictal hypoperfusion (that do not provide clear localizing information). MEG provides a global view of electrophysiological brain dynamics. Using MEG‐based source modeling analysis, we can investigate whole‐brain cortical activity in the interictal state. Such analysis cannot be realistically achieved with the limited sampling of brain areas that are investigated with implanted electrode recordings.
In this study, we layout a framework for integrating information acquired from ictal SPECT and interictal MEG and thereby characterize the resting‐state FC within the ictally hyperperfused and hypoperfused brain regions in a consecutive series of patients who underwent presurgical evaluation at our center. We hypothesize that there is a preferential FC during rest within regions that show significant hyperperfusion or hypoperfusion during seizures. To test this hypothesis, we informed our resting MEG FC analysis by the results of SPECT perfusion patterns during seizures. This allows for an estimation of FC that is driven by measurable nodes of patient‐specific epileptic networks, substantiated by our previous studies, which examined the relationships of ictal SPECT perfusion patterns to both evoked and spontaneous SEEG recordings (Krishnan et al., 2021; Tousseyn et al., 2017).
2. MATERIALS AND METHODS
2.1. Inclusion and exclusion criteria
The retrospective study was approved by the Cleveland Clinic Institutional Review Board. We included a consecutive series of patients with DRFE who: (1) underwent an interictal MEG and an ictal SPECT as part of their noninvasive presurgical evaluation, (2) had a subsequent SEEG evaluation between January 2015 and December 2016, and finally (3) underwent surgical resection, and (4) had a good quality postoperative MRI. Patients were excluded from the analysis: (1) if SPECT injection had been obtained during the postictal rather than the ictal phase and (2) if brain surgery had been performed between the SPECT/MEG and SEEG evaluations.
2.1.1. SPECT acquisition and processing
Techniques used for the acquisition and processing of SPECT in this study have been described elsewhere (Tousseyn et al., 2017) and are also provided in supplementary materials S1.
2.1.2. MEG data acquisition and modeling
MEG data for this study were derived from 1‐h clinical recording obtained with a 306‐channel whole‐head MEG system (Elekta, Sweden) with a sampling rate of 1000 Hz, and application of a bandpass acquisition filter with cut‐off frequencies of 0.1 and 333 Hz. MEG data were postprocessed using temporally extended signal space separation (tSSS) algorithm (Taulu & Hari, 2009), which compensates for the magnetic interference caused by external and nearby sources and minor head movements in the MEG array (Kakisaka et al., 2012).
2.1.3. MEG and MRI preprocessing
Figure 1 describes the analysis pipeline used for the integration of SPECT and MEG data. For FC analysis, we bandpass filtered the tSSS‐processed MEG data using a Kaiser filter with passband edges at 1 and 70 Hz and downsampled the data to 200 Hz for computational efficiency using the freely available Matlab toolbox Brainstorm (Tadel et al., 2011). We identified 5 min of artifact‐free data. No constraints regarding the state of the brain, and the presence, or absence of interictal epileptiform discharges were laid during data selection. We downloaded the preoperative MRI DICOM (Digital Imaging and Communications in Medicine) images and performed cortical reconstruction using Freesurfer (Dale et al., 1999). The reconstructed surfaces, MRI, and MEG data were imported to Brainstorm. The MEG sensors and cortical surfaces were co‐registered using the digitized head points (approximately 100 points) collected during MEG acquisition. We constructed the forward model using the overlapping sphere model (Huang et al., 1999) and used dynamical statistical parametric mapping (dSPM) (Dale et al., 2000) estimates to create the inverse model.
FIGURE 1.
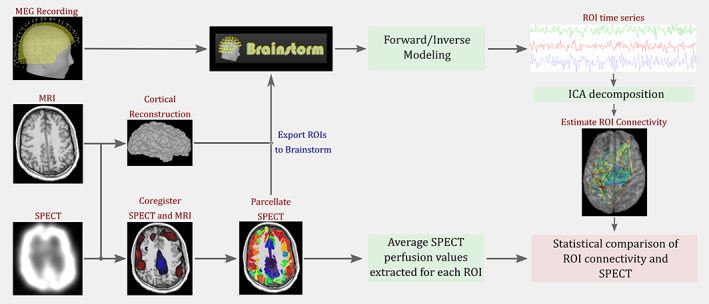
Pipeline used for comparing ictal single‐photon emission computed tomography (SPECT) and magnetoencephalography (MEG) functional connectivity. We first perform cortical reconstruction of the patient's magnetic resonance imaging (MRI) using Freesurfer. We then co‐register the ictal SPECT data to the MRI and parcellate the resulting SPECT data. Next, we import the temporally extended signal space separation (tSSS)‐processed MEG time series, the reconstructed cortical surfaces, and the regions of interest (ROIs) generated from SPECT data to Brainstorm. We perform source modeling analysis of the MEG data and generate a time series per ROI. We then use ICA decomposition to remove any residual EKG artifacts that were not rejected during tSSS processing. Next, we perform connectivity analysis of the resulting time series using coherence and phase locking value. Finally, we perform statistical analysis of the ROI connectivity and SPECT perfusion values.
2.1.4. Estimation of connectivity measures
We constructed a total of 200 regions of interest (ROIs) for MEG FC analysis by parcellating the SISCOM perfusion pattern using k‐means clustering (Figure 2a,b, See Supplementary material S1). The parcellated map was imported into Brainstorm as a volume atlas and converted to “scouts.” Each scout served as ROI for our analysis. The average ROI area across patients was found to be 11 cm2 (). We estimated the average SISCOM perfusion z score for every ROI. We used inverse modeling to estimate the source time series. We then averaged all the sources within an ROI to generate a single time series per ROI. We expected some of the sources within an ROI to have opposite orientations. To offset this, we flipped the sign of sources with opposite orientations before averaging. Finally, we performed independent component analysis (ICA) based decomposition of the ROI time series to remove any residual EKG artifacts that were not removed during tSSS processing (Hyvärinen & Oja, 2000). For every 5‐s segment of the ROI time series (derived from the 5‐min period of MEG data in each patient), we estimated coherence (COH) (Bokil et al., 2010; Thomson, 1982) and phase‐locking value (PLV) (Lachaux et al., 1999) between brain regions for the delta (0–4 Hz), theta (4–8 Hz), alpha (8–12 Hz), beta (12–30 Hz), and gamma (30–70 Hz) frequency bands (see Supplementary material S2). Connectivity measures were averaged across the 60 segments and used in the subsequent analysis.
FIGURE 2.
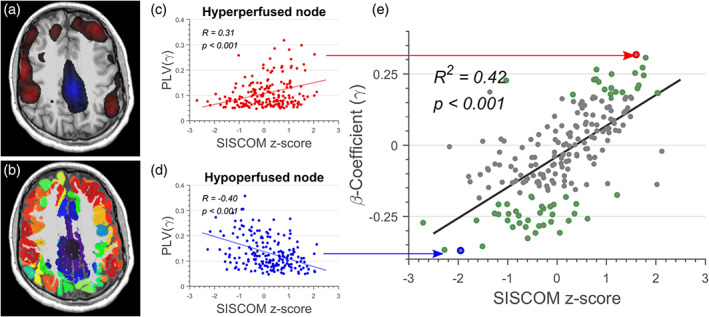
(a) Ictal single‐photon emission computed tomography (SPECT) pattern of hyperperfusion (red blobs) and hypoperfusion (blue blobs) for Patient P05. (b) Parcellation of the cortical surface using subtraction ictal SPECT co‐registered to MRI (SISCOM) z value. (c, d) Relationship between SISCOM perfusion z value and phase‐locking value for: (c) a hyperperfused node and (d) a hypoperfused node. (e) Relationship between SISCOM z value and ‐coefficient for Patient P05. Each grey shaded circle represents 1 out of 200 regions of interest (ROIs). ROIs with statistically significant ‐coefficients are denoted using green borders.
2.1.5. Definition of SPECT hyperperfusion and hypoperfusion
Newey et al. defined the optimal SISCOM z‐threshold for identifying the EZ as 1.5, which corresponds to a p value of .07 (Newey et al., 2013). In line with this finding, we defined hyperperfused and hypoperfused brain regions as the ROIs with the top and bottom 7% SISCOM z scores, respectively. ROIs that were not identified as hyperperfused or hypoperfused were categorized as regions of baseline perfusion (i.e., ROIs that had no significant change in perfusion during the seizure).
2.1.6. Correlating SPECT perfusion and resting‐state connectivity
Based on our previous work (Tousseyn et al., 2017), we hypothesized that hyperperfused ROIs will be strongly connected to other hyperperfused ROIs, whereas hypoperfused ROIs will be strongly connected to other hypoperfused ROIs. To identify ROIs with high correlation with SISCOM z score, the distribution of the connectivity profile of an ROI was compared to SISCOM z score. To be unbiased in our approach, this relationship was evaluated for all ROIs in the same patient. The following regression model was constructed to evaluate the relationship between perfusion map and connectivity (Figure 2c,d). For every ROI , we estimate the beta coefficients () such that
| (1) |
where is the connectivity estimated using coherence or PLV between nodes and for frequency band f. is the SISCOM z score of node and is the Euclidean distance between the nodes and . The distance variable was included in the regression model to remove any distance‐modulated variance from the estimates (Honey et al., 2009). Thus, the estimates for ROI relate the FC of ROI to the SISCOM perfusion z score. We then generate estimates for every ROI and for the five frequency bands in each individual patient. Since this results in a large number of statistical comparisons, we used the methods described in Benjamini and Hochberg to adjust the p values associated with the estimates (Benjamini & Hochberg, 1995).
A positive and statistically significant estimate for ROI indicates that FC estimates of ROI and SISCOM perfusion z score have similar covariance. We used cross‐correlation analysis to evaluate the relationship between estimates, and the SISCOM perfusion z score () of ROI to test whether regions with higher perfusion z score have higher estimates while those with lower perfusion z score have lower estimates in every single patient (Figure 2e). Finally, the distribution of statistically significant estimates were compared for ROIs identified as hyper‐, hypo‐, and baseline perfused to check whether hyperperfused ROIs have a higher fraction of positive estimates and hypoperfused ROIs have a higher fraction of negative estimates.
2.1.7. Connectivity between the area of surgical resection and perfusion pattern
The postoperative MRI was co‐registered to the patient's preoperative MRI and the region of surgical resection was hand‐drawn. We identified the ROIs that were part of the surgical resection, which helped us divide the brain regions into four zones: hyperperfused ROIs inside () and outside () the area of surgical resection, ROIs with baseline perfusion outside (), and hypoperfused ROIs outside () the area of surgical resection. A schematic visualization of the zones is shown in Figure 3. We were then able to investigate the connectivity linking perfusion with the area of surgical resection. Specifically, we estimated and statistically compared the average intrinsic (within‐group) connectivity: , , , , and the average extrinsic (between‐group) connectivity: , , , , , and . For intrinsic connectivity analysis, we only analyzed patients who had at least two ROIs within each group.
FIGURE 3.
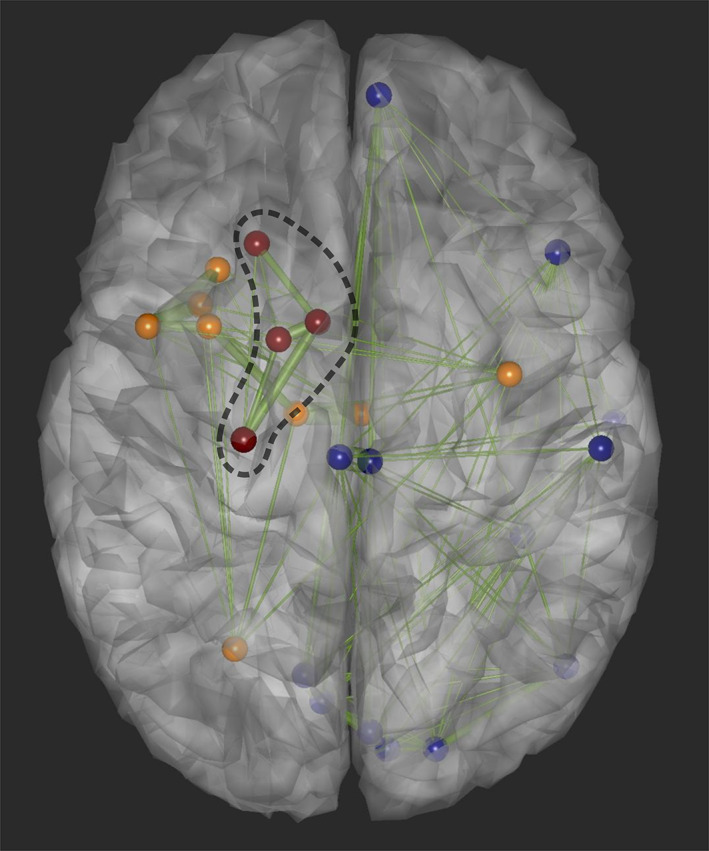
Schematic visualization of the hyperperfused regions of interest (ROIs) that were resected (in red), hyperperfused ROIs that were not resected (in orange), and hypoperfused ROIs (in blue). The dashed black curve denotes the surgical resection margin.
2.1.8. Subgroup analysis
We performed subgroup analysis to compare the correlation between SISCOM z scores and ‐coefficients in the following conditions: (1) seizure‐free versus nonseizure‐free outcome, (2) early versus late ictal SPECT injection, (3) secondarily generalized (focal to bilateral tonic–clonic) seizure versus nongeneralized SPECT seizure, and (4) unifocal versus multifocal epilepsy. We also compared the average connectivity within hyperperfused and hypoperfused ROIs between patients who were in a state of wakefulness and sleep during the MEG study.
2.1.9. Statistical considerations
We used the Students' t test to assess the statistical significance of population‐level correlation coefficients and the Shapiro–Wilke test to examine the normality of the distribution. We compared the differences in intrinsic and extrinsic connectivity within and between the four groups: , , , with paired Mann–Whitney U‐test. Further, we employed analysis of variance (ANOVA) to assess the influence of timing of ictal SPECT injection, seizure duration, and resective surgery outcome on intrinsic and extrinsic connectivity. We defined early ictal SPECT injections as SPECT studies with injection time that was shorter or equal to the median injection time across the 30 patients included in the study. Similarly, we defined short‐duration seizures as ictal SPECT seizures, which had a duration that was shorter than or equal to the median seizure duration across all patients. We used the methods described by Benjamini and Hochlberg to adjust for multiple comparisons and control the type I error rate (Benjamini & Hochberg, 1995).
3. RESULTS
3.1. Study population
Out of all patients who had ictal SPECT, SEEG, and MEG for localization of the EZ between January 2015 and December 2016, 30 patients met the specific inclusion criteria (see Table 1). No patient had prior resective epilepsy surgery. The median age of the study population was 27.5 years (range: 8–58 years), and the male: female ratio was 18:12. The median age at seizure onset was 15 years (range: 0–46 years) and the median duration of epilepsy was 10.5 years (range: 2–36 years). The median SPECT injection time was 18 s (range: 1–220 s) with a median seizure duration of 83.5 s (range: 16–390 s). Fifteen patients were seizure‐free after resective surgery. The median postoperative follow‐up period was 23 months (range: 6–40 months). Thirteen patients had more than one area of SEEG onset. These patients demonstrated nonadjacent areas of SEEG onset and were therefore deemed as “multifocal.”
TABLE 1.
Patient demographics
| SISCOM details (s) | ||||||||
|---|---|---|---|---|---|---|---|---|
| Patient ID | Age | Age at epilepsy onset | Injection time | Flush time | Seizure duration | MRI | ILAE outcome (follow‐up time, months) | Pathology |
| P01 | 19 | 10 | 12 | 17 | 73 | Increased FLAIR signal in bilateral hippocampal formation (L > R) | I (35) | FCD |
| P02 | 29 | 23 | 18 | 21 | 97 | Nonlesional | I (25) | FCD |
| P03 | 27 | 17 | 4 | 11 | 280 | Nonlesional | V (21) | FCD/nodular heterotopia |
| P04 | 26 | 6 | 11 | 16 | 66 | Nonlesional | V (23) | FCD |
| P05 | 15 | 8 | 16 | 25 | 139 | Mildly asymmetrical increase in FLAIR signal within right hippocampus, parahippocampal gyrus and amygdala | I (20) | FCD |
| P06 | 32 | 18 | 20 | 23 | 103 | Nonlesional | I (40) | FCD |
| P07 | 8 | 6 | 20 | 22 | 141 | Left temporal hyperintensity | I (9) | FCD |
| P08 | 42 | 17 | 12 | 16 | 68 | Nonlesional | IV (18) | FCD |
| P09 | 25 | 21 | 23 | 28 | 113 | Extensive periventricular nodule heterotopias | III (9) | FCD |
| P10 | 27 | 2 | 45 | 49 | 74 | Subtle increased signal in R. occipital/posterior temporal regions involving cortex and subcortical regions | I (12) | FCD |
| P11 | 28 | 20 | 15 | 19 | 75 | Nonlesional | I (11) | Gliosis |
| P12 | 34 | 30 | 4 | 9 | 70 | Nonlesional | III (13) | Gliosis |
| P13 | 32 | 25 | 21 | 23 | 390 | Mild left hippocampal atrophy | I (12) | Gliosis |
| P14 | 56 | 20 | 10 | 13 | 34 | Non‐lesional | I (12) | Not available |
| P15 | 29 | 7 | 18 | 22 | 79 | Right. Intraventricular mass (caudate) | V (13) | Gliosis |
| P16 | 35 | 13 | 22 | 24 | 59 | Nonlesional | I (32) | Gliosis |
| P17 | 18 | 16 | 22 | 26 | 84 | Slight decrease in size of left hippocampus | I (6) | FCD |
| P18 | 58 | 46 | 23 | 24 | 134 | Nonlesional | IV (25) | FCD |
| P19 | 30 | 22 | 11 | 15 | 95 | Heterotopic gray matter along margins of lateral ventricles | IV (25) | Gliosis |
| P20 | 35 | 0 | 19 | 23 | 90 | Symmetrical volume loss in parieto‐occipital lobes/superior and middle frontal gyri | IV (29) | Gliosis |
| P21 | 25 | 6 | 220 | 224 | 256 | Nonlesional | IV (34) | Gliosis |
| P22 | 19 | 8 | 8 | 12 | 16 | Decreased size in bilateral hippocampi, blurring of mesial aspects of R. superior frontal gyrus | I (13) | FCD |
| P23 | 25 | 5 | 5 | 10 | 118 | Nonlesional | V (34) | FCD |
| P24 | 40 | 35 | 51 | 55 | 149 | Nonlesional | I (33) | Gliosis |
| P25 | 26 | 20 | 17 | 21 | 75 | Nonlesional | I (36) | FCD |
| P26 | 43 | 35 | 17 | 20 | 20 | Mild and symmetric volume loss in bilateral hippocampal | IV (17) | Gliosis |
| P27 | 26 | 1 | 7 | 17 | 70 | Nonlesional | IV (23) | FCD |
| P28 | 21 | 14 | 26 | 31 | 83 | Nonlesional | IV (24) | Not available |
| P29 | 31 | 0 | 23 | 27 | 105 | Subtle increased signal in the right amygdala/hippocampal | I (25) | Gliosis |
| P30 | 26 | 10 | 20 | 22 | 19 | Nonlesional | IV (40) | FCD |
Abbreviations: FCD, focal cortical dysplasia; MRI, magnetic resonance imaging; SISCOM, subtraction ictal SPECT co‐registered to MRI.
3.1.1. Comparison between unthresholded SISCOM z score and resting‐state connectivity
Figure 2 shows representative results in a single patient. Figure 2c,d shows the gamma band FC estimated using PLV, as a function of SISCOM z score for a hyperperfused and hypoperfused node, respectively. We observed a statistically significant (p < .001) and positive correlation () between SISCOM z scores in each node and the corresponding ‐coefficients (Figure 2e).
Distribution of correlation coefficient between SISCOM z scores and ‐coefficient across patients estimated using PLV and coherence is shown in Figure 4a,b, respectively. We observed a statistically significant (p < .001) and positive correlation between SISCOM z scores and ‐coefficients across frequency bands. A higher correlation was observed when using PLV as a connectivity measure, as compared to coherence analysis.
FIGURE 4.
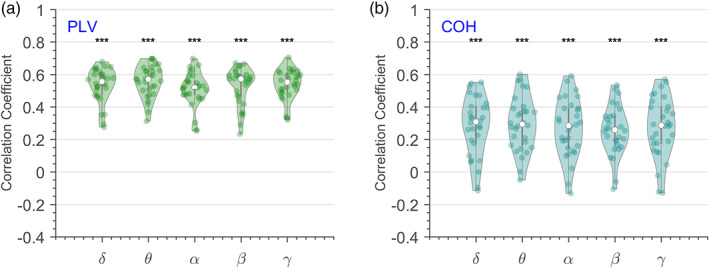
Distribution of the cross‐correlation coefficient between ‐coefficients and subtraction ictal SPECT co‐registered to MRI (SISCOM) z values across patients and frequency bands when estimating connectivity using (a) phase‐locking value, and (b) coherence. Asterisks denote statistically significant (p < .001) and positive correlation between distribution and SISCOM z score across patients.
We also evaluated the statistical significance of the correlation between SISCOM z scores and ‐coefficients for individual patients. All patients had a statistically significant (p < .001) and positive correlation when PLV was used as the connectivity measure. For coherence‐based FC analysis, a statistically significant (p < .05) and positive correlation was observed across frequency bands for 77%–80% of the patients. No correlation between ‐coefficient and SISCOM z scores was appreciated in the remaining 20%–23% of patients.
3.1.2. Comparison between thresholded SISCOM z scores and resting‐state connectivity
Figure 5 shows the distribution of ‐coefficients estimated using PLV in the three ROI groups: hypo‐, baseline‐ and hyper‐perfused. Among the hypoperfused ROIs, a statistically significant (p < .003) higher fraction of ROIs have negative—compared to positive—significant ‐coefficients (Figure 5a). The hyperperfused ROIs tend to have a statistically significant (p < .001) higher fraction of positive—compared to negative—significant ‐coefficients (Figure 5c). For baseline‐perfused regions, there was no statistically significant difference (p > .17) between the fraction of ROIs with positive versus negative significant ‐coefficients (Figure 5b). Results were similar when using coherence as connectivity estimator (Figure S2).
FIGURE 5.
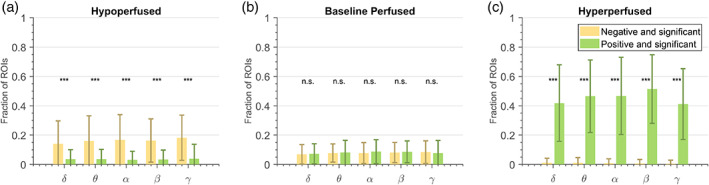
Distribution of ‐coefficients for the (a) hypoperfused regions of interest (ROIs), (b) baseline perfused ROIs—that is, ROIs that showed no significant change in perfusion during the seizure, and (c) hyperperfused ROIs. Single (p < .05), double (p < .01) or triple (p < .001) asterisks denote a statistically significant difference between the fractions of ROIs that have negative versus positive ‐coefficients. Phase‐locking value (PLV) was used as the connectivity estimator.
3.1.3. Subgroup analysis
We did not find any statistically significant difference among our four subgroups when examining the correlation between SISCOM z scores and ‐coefficients across all frequency bands: (1) seizure‐free versus nonseizure‐free outcome (p > .32), (2) early versus late ictal SPECT injection (p > .10), (3) secondarily generalized versus nongeneralized SPECT seizure (p > .66), (4) uni‐focal versus multifocal epilepsy (p > .88). The differences were not significant irrespective of the method used to estimate FC.
3.1.4. Difference in connectivity between patients in state of wakefulness and sleep
We identified 6 patients to be in a state of wakefulness, 20 patients in sleep, and 4 patients to be partly awake and then asleep in 5 min of MEG data used for connectivity analysis. We observed a statistically significant (p < .023) and higher FC in the alpha frequency band within regions of hypoperfusion in those patients who were in a state of wakefulness, when compared to patients who were asleep. These findings were statistically significant only when PLV was used as connectivity estimator.
3.1.5. Connectivity between perfusion inside and outside area of surgical resection
Intrinsic connectivity
Using PLV‐based connectivity estimates, the highest intrinsic connectivity across all patients (p < .0012; Figure 6) was observed for regions that showed hyperperfusion inside () and outside () the resection cavity, when compared to nonresected baseline‐perfused (), and hypoperfused () regions. Even though resected areas of hyperperfusion had higher connectivity when compared to nonresected areas of hyperperfusion, these differences were not statistically significant (p > .13). Finally, we observed a higher and statistically significant connectivity (p < .009) within hypoperfused and nonresected ( regions, as compared to baseline‐perfused and nonresected ( ROIs. These results were largely consistent across frequency bands, measures used to estimate connectivity, and distance between ROIs (Figure S3).
FIGURE 6.
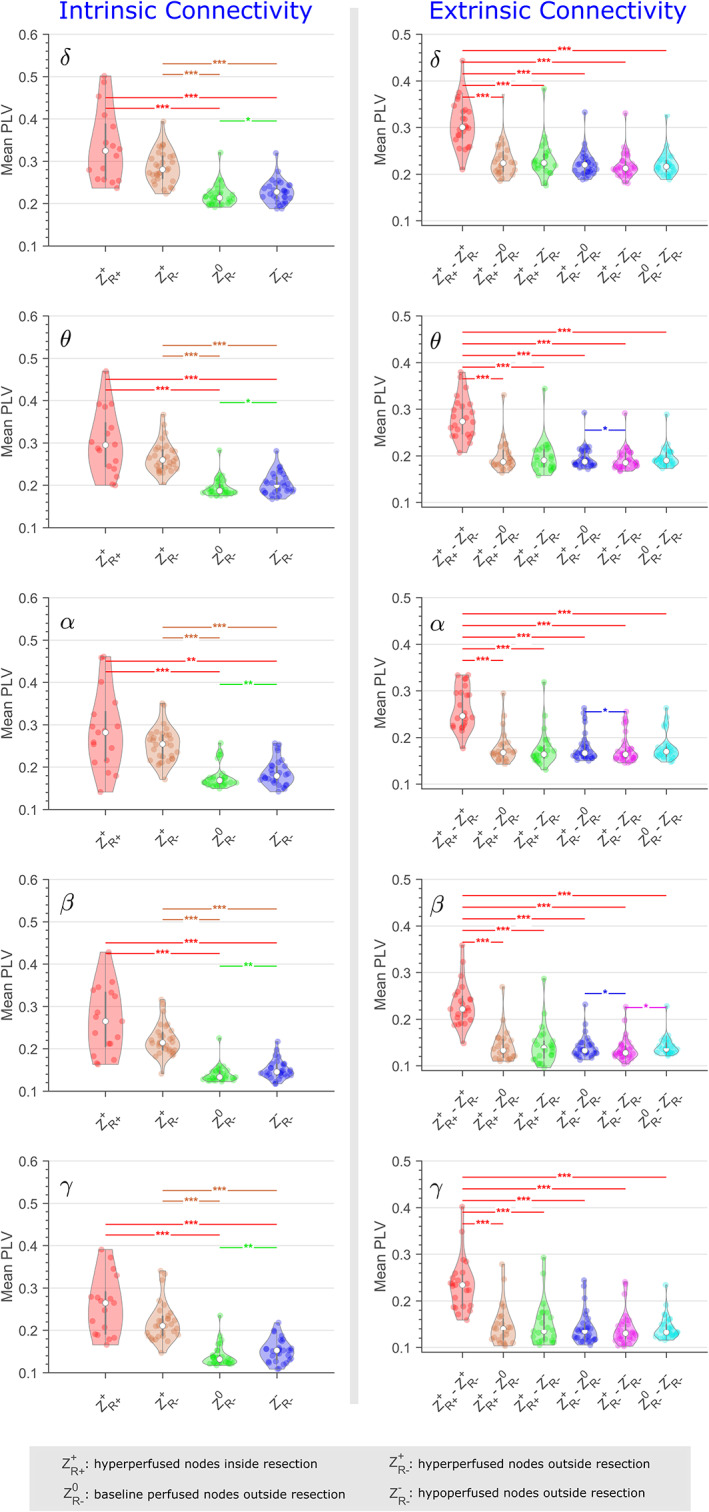
Distribution of phase‐locking value (PLV)‐based intrinsic and extrinsic connectivity for the five frequency bands across all patients. Statistically significant differences between connectivity estimates are denoted with single (p < .05), double (p < .01), and triple (p < .001) asterisks.
When using coherence as a connectivity estimator, we observed a higher and statistically significant intrinsic connectivity within ROIs inside the resection (), when compared to those outside the area of resection () (Figure 7).
FIGURE 7.
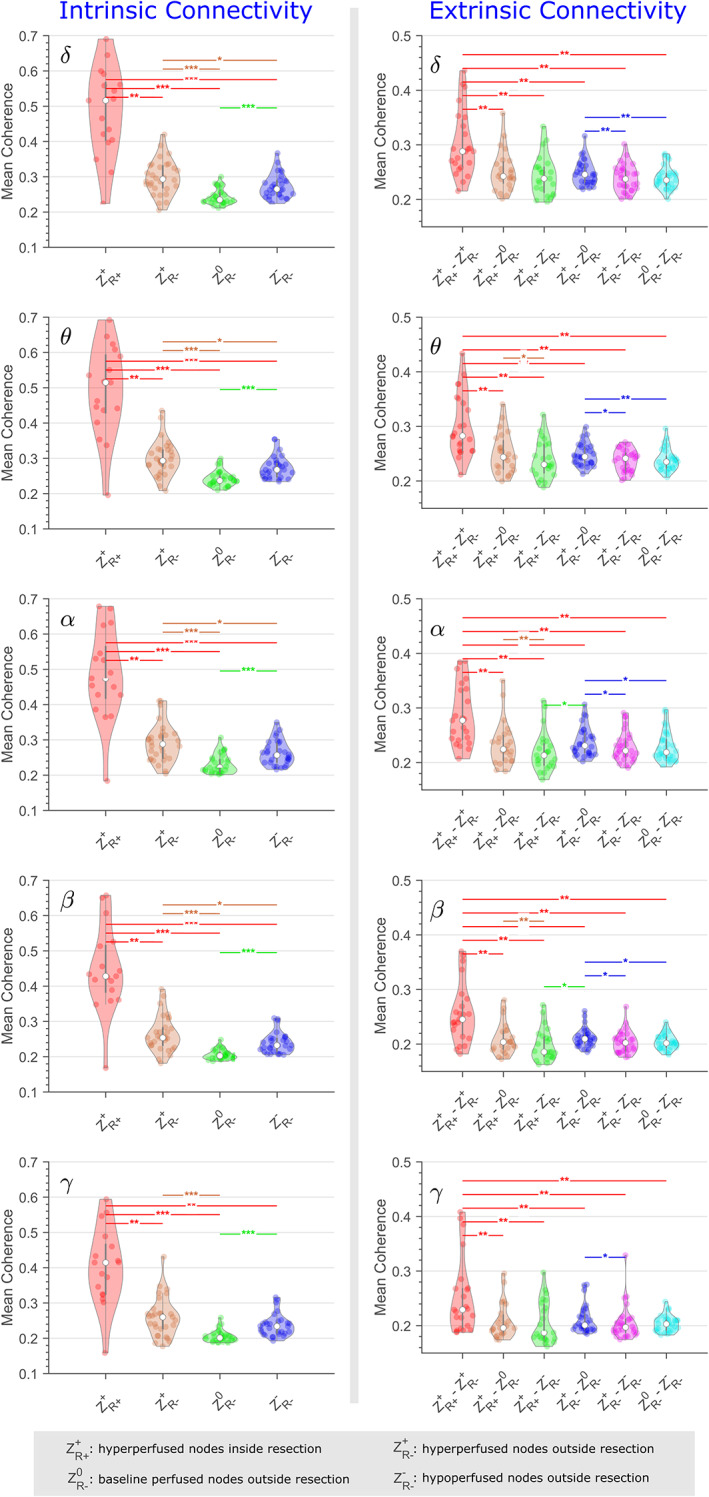
Distribution of coherence‐based intrinsic and extrinsic connectivity for the five frequency bands across all patients. Statistically significant differences between connectivity estimates are denoted with single (p < .05), double (p < .01), and triple (p < .001) asterisks.
Extrinsic connectivity
A statistically significant and higher connectivity between hyperperfusion inside and outside the area of resection (), as compared to other extrinsic groups (p < .001; Figure 6, 7), was apparent irrespective of frequency bands and measures used to estimate connectivity.
Effect of surgical outcome, ictal SPECT injection time, and seizure duration
Neither the intrinsic nor the extrinsic connectivity was statistically different between seizure‐free and nonseizure‐free patients, early versus late ictal SPECT injection, and short versus long seizure duration. When using coherence as intrinsic FC estimator, we found that the difference between ROIs inside () versus outside (), the resection cavity was statistically significant only in the seizure‐free patients (p < .006). The difference was not significant in the nonseizure‐free group (p > .26). While we observed higher connectivity within regions included within the resection () regions compared to those outside (), the differences were not significant, when using PLV as connectivity estimator. For the seizure‐free group, 11 patients had at least two or more nodes that were hyperperfused and resected. For the nonseizure‐free group, six patients had at least two or more nodes that were hyperperfused and resected.
4. DISCUSSION
MEG and SPECT are complementary but invaluable tools for the noninvasive localization of the EZ. Interpretation of the complex perfusion patterns observed in ictal SPECT studies is often challenging (Dupont et al., 2006). The areas of hyperperfusion reflect the ictal onset and propagation pathways and thus represent measurable nodes of an interconnected seizure‐related network (Krishnan et al., 2021; Van Paesschen, 2004). The present study aims to promote the clinical understanding and interpretation of these complex perfusion patterns by incorporating resting‐state FC analysis.
4.1. Main findings
4.1.1. Subtraction ictal SPECT
We found the existence of a very strong correlation between SISCOM perfusion z scores and FC estimates within hyperperfused and hypoperfused ROIs. These findings suggest that hyperperfused brain regions are preferentially connected to other areas of hyperperfusion, and by the same token ictally hypoperfused brain regions are preferentially connected to other areas of hypoperfusion. Thus, human seizures invoke neuronal pathways that are active even during rest. One explanation would be that epileptogenic networks are embedded in preformed physiological and/or individualized brain networks (Halász, 2010). Whole‐brain perfusion changes during seizures are bound to be complex but also contain rich information regarding preferential and patient‐specific brain connectivity. In clinical practice, ictal SPECT analysis is sometimes watered down to a mere (and often insufficient) tool for seizure localization. Our study should prompt us to view and interpret seizure related (increases and decreases) in SPECT perfusion patterns with a brain network perspective in our mind.
4.1.2. Electrophysiological connectivity in hyperperfusion and hypoperfusion
Hyperperfusion
We found a positive and statistically significant ‐coefficients across all patients in regions that show hyperperfusion during seizures. The observed high correlation between ‐coefficient and SISCOM z scores indicates that regions of ictal hyperperfusion have a positive ‐coefficient, whereas regions of ictal hypoperfusion have a negative ‐coefficient. The observed correlations were robust across methodologies used to estimate FC and frequencies of interest. Further, we report the presence of high intrinsic and extrinsic connectivity within and between hyperperfused brain regions inside and outside the area of surgical resection.
Congruent patterns of ictal hyperperfusion and semiological seizure progression have been described in temporal lobe epilepsy (Shin et al., 2002). The presence of electrophysiological and metabolic changes in areas of hyperperfusion at a distance from the EZ has been described using ictal scalp EEG (Kim et al., 2007), intracranial EEG (Spanaki et al., 1999), and PET studies (Bouilleret et al., 2002). Very few studies have investigated the resting‐state FC within the nodes of seizure onset and seizure propagation. Our previous work has demonstrated first that electrical stimulation of the SEEG‐defined seizure onset zone elicits a higher evoked response in the brain regions that showed hyperperfusion during preoperative ictal SPECT (Tousseyn et al., 2017), and second that SPECT perfusion patterns have strong electrophysiological underpinnings on intracranial EEG recordings (Krishnan et al., 2021). Blumenfeld et al. previously demonstrated that regions of reduced blood flow (hypoperfusion) during seizures exhibited increased power in the low‐frequency bands on scalp EEG (Blumenfeld, McNally, et al., 2004; Krishnan et al., 2021).
We observed that high FC endures in the interictal state between brain regions that show hyperperfusion during seizures. Correspondence between interictal and ictal brain networks has been demonstrated by comparing the regions of SPECT hyperperfusion with interictal spike‐related EEG‐fMRI activation maps (Tousseyn et al., 2015). Studies have reported increased FC between regions implicated by interictal spikes—as compared to those unaffected by spikes (Bettus et al., 2011)—and the existence of preferential coupling within the EZ and between the EZ and propagation zone (Lagarde et al., 2018). Iasemidis et al. demonstrated that phase transition from the resting interictal state to the pathological ictal state occurs when critical brain regions are abnormally synchronized with each other (Iasemidis et al., 2003). These pathological synchronizations can occur minutes to hours before the seizure, while seizures occur to dynamically reset the pathological synchronization (Krishnan et al., 2011). Together, these results imply that ictally hyperperfused brain regions correspond to a strongly connected neuronal network during rest. Hence, the widespread and complex hyperperfusion patterns, which are often observed in ictal SPECT studies, are not random and represent functionally connected brain regions that are recruited in the course of the seizure.
Hypoperfusion
Compared to hyperperfusion, regions of hypoperfusion included a higher fraction of ROIs with statistically significant negative ‐coefficients across patients and frequency bands. The negative ‐coefficients imply that a strong interictal connection exists between regions of ictal hypoperfusion. Moreover, regions that demonstrate ictal hypoperfusion have low interictal FC to regions that become hyperperfused during seizures. These findings are further supported by our intrinsic connectivity analysis, where we found that regions of ictal hypoperfusion have higher connectivity compared to baseline‐perfused regions (areas that show no significant change in perfusion during seizures).
Studies have postulated that the ictal hypoperfusion of the frontoparietal association cortices observed in temporal lobe epilepsy (Van Paesschen et al., 2003) reflects a form of surround inhibition that seeks to limit the spread of seizures (Van Paesschen, 2004) or perhaps a functional deactivation of the frontoparietal cortices resulting from propagation of epileptiform activities to the upper brainstem reticular formation and the medial thalamus (Blumenfeld, McNally, et al., 2004). Moreover, intracranial EEG studies reveal ictal slowing in the frontal and parietal regions during temporal lobe seizures (Blumenfeld, Rivera, et al., 2004). Arthuis et al. noted a correlation of loss of consciousness during temporal lobe seizures with long‐distance synchronization of electrophysiological signals in regions that are critical in the processing of awareness (including frontoparietal associative cortices and thalamus) (Arthuis et al., 2009). The existence of functional and structural connectivity between frontal and parietal cortices during rest is further supported by intracranial‐EEG (Kucyi et al., 2018), fMRI (Lee et al., 2009), and DTI studies (Marshall et al., 2015). Regions of ictal hypoperfusion correspond to patterns of reduced blood oxygenation level‐dependent (BOLD) signal observed in interictal spike‐related EEG‐fMRI studies in the same patients (Tousseyn et al., 2015). Such EEG‐fMRI patterns of BOLD deactivation have been described within parts of the “default mode network” (comprising the posterior cingulate cortex, precuneus, medial frontal, and lateral parietal cortex) with both focal and generalized epileptic activities (Fahoum et al., 2013). Finally, electrical stimulation during SEEG recordings of the ictally hypoperfused brain regions (i.e., areas that showed ictal hypoperfusion in the preoperative SPECT study) elicited higher evoked responses in other hypoperfused (rather than hyperperfused) brain regions (Tousseyn et al., 2017). These results illustrate that brain regions, exhibiting hypoperfusion during seizures, belong to another distinct, interconnected neuronal network, which is separate from the hyperperfused seizure network. The discharging seizure focus recruits areas of seizure onset and spread (highlighted by ictal hyperperfusion). It also appears to modulate separate but interconnected brain regions, which become hypoperfused during the seizure without being directly connected to the patient's hyperperfused seizure network.
4.1.3. Magnetoencephalography and epileptic network
Few studies have investigated epileptic networks using MEG. Malinowska et al. report similar spatiotemporal patterns when examining interictal spike discharges recorded using MEG and SEEG (Malinowska et al., 2014). Others have studied the spatio‐temporal distribution of epileptiform discharges and high‐frequency oscillations to investigate the role of deep cortical and subcortical structures in seizure initiation and modulation utilizing multimodal analysis of EEG‐fMRI or ictal MEG (Nissen et al., 2016; Rose et al., 2013; Vaudano et al., 2012).
Our study differs in that it directly investigates FC in the regions of ictal onset and propagation highlighted by ictal hyperperfusion. By combining information derived from dynamic seizure‐related changes in perfusion with MEG FC, we can objectively investigate connectivity patterns that belong to patient‐specific seizure networks. In addition, to advancing presurgical decision‐making including the planning of intracranial electrode implantation and subsequent surgical intervention, we hope that this approach can contribute to our efforts to modulate pathological epileptic networks and develop patient‐specific therapeutic interventions.
4.1.4. Intrinsic and extrinsic connectivity within the epileptic network
Our study shows that ictally hyperperfused ROIs residing both inside and outside the resected cortex have higher intrinsic FC when compared to baseline perfused areas (where perfusion does not change during the seizure), and ictally hypoperfused ROIs that reside outside the resected cortex. Across patients, we observed a gradient in intrinsic connectivity, with the highest connectivity values residing within the resected areas of hyperperfusion, followed in descending order by areas of ictal hyperperfusion, hypoperfusion, and lastly baseline perfusion that had not been included in the surgical resection. Further, we observed higher extrinsic connectivity between regions of hyperperfusion that resided within the resective cavity, as compared to those outside the area of resection. The average intrinsic and extrinsic connectivity were independent of the prognosis following surgery, the timing of ictal SPECT injection, and the duration of the seizure. Results from this study corroborate our previous findings and highlight the fact that the ictally hyperperfused brain regions correspond to a strongly connected brain network during rest irrespective of surgical outcomes (Tousseyn et al., 2017). Similarly, SEEG studies examining intrinsic FC in the interictal state have shown higher FC within the EZ, within the seizure propagation zone, and between the epileptogenic and propagation zones (Lagarde et al., 2018).
For coherence‐based FC analysis, we observed a statistically significant, higher, intrinsic connectivity within hyperperfused brain regions residing inside the resective cavity, as compared to the ones outside the area of resection. These differences were significant only for patients who were seizure‐free following resective epilepsy surgery. Hence, coherence‐based connectivity analysis could be used to noninvasively identify and target critical nodes of hyperperfusion. A less favorable seizure outcome would be more likely when critical parts of the hyperperfusion network have been omitted from the final surgical resection. MEG and EEG studies of interictal FC have demonstrated elevated synchrony within the EZ (Englot et al., 2015; Krishnan et al., 2015; Lagarde et al., 2018; Vlachos et al., 2016) and have linked positive surgical outcomes with resection of regions that exhibit high local synchrony (Antony et al., 2013). Coherence analysis of ictal SEEG discharges has demonstrated synchronized intracranial EEG patterns with the areas of seizure onset and seizure propagation (Bartolomei et al., 1999). Epileptogenic processes mediate neuronal network reconfiguration resulting in abnormal connectivity within the EZ (Blumenfeld et al., 2007; Percha et al., 2005). Our study illustrates that FC within the EZ is indeed elevated even during resting‐state conditions.
Lastly, we observed a higher but not statistically significant connectivity value in areas of ictal hyperperfusion that resided within the resective cavity (as compared to areas of hyperperfusion that were not included in the resection), when employing PLV as the FC estimator. PLV is a nonlinear measure of connectivity, sensitive to phase consistencies between signals, whereas coherence is sensitive to phase and amplitude consistencies of signals. The divergent sensitivities of the two measures to different aspects of the signal could explain the differences in our results.
Our prior investigations comparing SPECT perfusion patterns with intracranial EEG activity during semiologically identical seizures in the same patient have shown that power spectral changes in alpha to high‐frequency bands were higher in areas that showed hyperperfusion, as compared to areas that exhibited baseline (unchanged perfusion) or hypoperfusion during the ictal SPECT seizure (Krishnan et al., 2021). The lack of significant frequency‐specific connectivity relations in the current study could be attributable to differences in methodology (power spectral analysis vs. FC), and discrepancies in brain states (ictal vs. resting state).
4.2. Clinical implication
Invasive surgical planning using stereo‐EEG relies on a priori identification of the critical brain regions that constitute the epileptic network using seizure semiology, electroclinical correlations, and a plethora of noninvasive diagnostic modalities. This noninvasive, a priori, definition of the critical epileptogenic network is not a trivial problem. The proposed, combined analysis of SPECT perfusion patterns during seizures along with resting‐state (interictal) MEG FC provides us with an objective criterion for the a priori identification of critical regions that are influenced by a patient‐specific epileptogenic process.
Importantly, this novel noninvasive approach can also aid in the a posteriori interpretation of complex, sparse or inconclusive, SEEG recordings. Prospective validation in a large dataset is a mandatory next step. Nonetheless, our results would predict a favorable seizure outcome when the planned surgical resection incorporates nodes of ictal hyperperfusion with significantly higher intrinsic MEG connectivity, as opposed to other areas of hyperperfusion.
Our study indicates that connectivity within the ictally hyperperfused network is increased not only during seizures but also during the interictal state. These same interictal networks could facilitate the neuromodulatory effects of chronic neurostimulation—such as direct cortical or deep brain stimulation—where electrical impulses are delivered interictally (Yu et al., 2018) to moderate network dynamics and thus suppress the occurrence of epileptic seizures (Shon et al., 2005; Van Laere et al., 2002). The results of this study have important clinical implications insofar as they introduce a measurable noninvasive framework that could be exploited to select, tailor, or adjust therapeutic interventions based on patient‐specific epileptic networks.
4.3. Methodological constraints and limitations
4.3.1. Subtraction ictal SPECT
SPECT hyperperfusion patterns provide a snapshot of the regions associated with ictal onset and propagation. The fast dynamics associated with an ictal event complicate the interpretation of the static SPECT perfusion patterns. Specific statistical thresholds determined by clinical considerations are used to aid the interpretation of SPECT studies. Our definition of hyper‐ and hypo‐perfused brain regions was motivated by the findings of Newey et al., who showed that a SISCOM z scores of 1.5 have the highest sensitivity and specificity in localizing the EZ (Newey et al., 2013). However, the defined threshold may be suboptimal in delineating the epileptic network. With this limitation in mind, we performed a two‐fold analysis by considering the entire spectrum of SISCOM z scores, while also looking at thresholded SISCOM z‐maps. The results were similar irrespective of the analysis, that is, two discrete but strongly connected networks can be identified in the interictal state, when informed by the patterns of significant hyperperfusion, and separately significant hypoperfusion, during seizures. The localization value of SPECT studies is considered to be higher with an early ictal injection of the radiotracer (Lee et al., 2011), and with injection during focal seizures that do not evolve to secondary generalization (Varghese et al., 2009). It is important to note that the observed correlations between SPECT and FC were quite robust and were not significantly impacted by early vs. late timing of ictal SPECT injection, secondary generalization versus nongeneralized SPECT seizure, presence of one (uni‐focal) versus more than one (multi‐focal) SEEG onset regions, and seizure‐free versus nonseizure‐free outcome. This could be explained by the fact that our study intended to investigate connectivity at a larger scale and was not focused solely on localizing the EZ.
4.3.2. Functional connectivity analysis
Source level FC analysis using MEG relies on inverse modeling of sensor time series. This approach is ill‐posed and can lead to nonunique solutions. Different mathematical approaches exist for the inverse modeling of MEG sensor data. In our study, we selected dSPM for inverse modeling, since it is considered to be more sensitive to deeper sources (Dale et al., 2000).
While MEG is not impeded by the thickness and integrity of the skull and dura, the sensitivity of MEG to detect brain activity drops off as the square of the distance from the sensor. Hence, MEG has difficulty recording activity from deeper brain regions, especially from subcortical structures—although recent studies have suggested that MEG could potentially detect brain activity arising from such deep sources (Pizzo et al., 2019).
The state of the brain such as sleep, wakefulness, and so on affects FC estimates (Tagliazucchi & Laufs, 2014; Turner et al., 2020; Usami et al., 2015). The retrospective nature of our study limits our ability to control the patient's brain state. The MEG study was performed to record interictal epileptiform discharges. The yield of interictal discharges increases when the subject is in a state of sleep. Hence, a majority of the patients in this study were asleep during the MEG recording session. We found increased connectivity in the alpha frequency band within the hypoperfused regions in patients who were in a state of wakefulness, as compared to patients who were asleep during the MEG. The reduced connectivity in the alpha frequency band during sleep likely results from the attenuation of alpha waves during sleep. Our study was ill‐powered to assess the difference in resting‐state connectivity between different sleep stages. Hence, the results of this study should be interpreted in light of these limitations taking into account the constraints inherent to retrospective studies.
Functional connectivity can be defined as a descriptive measure of spatiotemporal correlations that exist between spatially distinct regions of the brain (Friston et al., 1993). PLV and coherence are two commonly employed nondirectional measures used to quantify phase synchrony between neuronal signals. We observed that the PLV‐based connectivity estimator was more robust in elucidating SPECT‐connectivity correlations across patients—when compared to coherence analysis. Deviation of spectral coherence measures from ideal estimates can occur in a high noise environment, and when oscillators exhibit intermittent synchronization (Lowet et al., 2016). We should note that neuronal oscillations can produce intermittent synchronizations and can affect cortical synchrony estimation using coherence. PLV has better noise properties and is less influenced by the nonstationarity of neuronal signals, whereas coherence‐based analysis is more sensitive to amplitude relationships between signals.
5. CONCLUSION
Our multimodal study combining ictal SPECT with resting‐state MEG connectivity analysis demonstrates that the widespread patterns of areas of hyperperfusion, as well as hypoperfusion, during seizures are not at all arbitrary. Rather they highlight nonrandom brain regions that remain interconnected during the interictal state. The combination of SPECT and MEG can provide a measurable, noninvasive, definition of patient‐specific epileptic networks. In addition to advancing surgical decisions including strategy for implantation of invasive electrodes or neurostimulators, we hope that this approach will contribute to our efforts to understand and modulate pathological epileptic networks and establish individualized, patient‐specific diagnostic and therapeutic interventions.
AUTHOR CONTRIBUTIONS
Balu Krishnan: Conceptualization, Methodology, Software, and analysis, Writing ‐ Original Draft preparation; Simon Tousseyn: Conceptualization, Methodology, Writing ‐ Original Draft preparation; Z. Irene Wang: Writing – Review and Editing; Hiroatsu Murakami: Data Curation and analysis; Guiyun Wu: Data Curation; Richard Burgess: Data Curation; Leonidas Iasemidis: Writing – Review and Editing; Imad Najm: Writing – Review and Editing; Andreas V. Alexopoulos: Conceptualization, Writing – Review and Editing, Supervision.
FUNDING INFORMATION
The study was partly funded by the American Epilepsy Society Post‐Doctoral Research Training Fellowship (Award# 367395).
CONFLICT OF INTEREST
None of the authors has any conflict of interest to disclose. We confirm that we have read the Journal's position on issues involved in ethical publication and affirm that this report is consistent with those guidelines.
Supporting information
Data S1: Supporting Information
ACKNOWLEDGEMENTS
The authors would like to thank the nuclear medicine staff who were instrumental in the administration and interpretation of the SISCOM studies, the MEG technicians and nursing staff who assisted with MEG data acquisition, and Ping Liu for her support in multimodal image integration.
Krishnan, B. , Tousseyn, S. , Wang, Z. I. , Murakami, H. , Wu, G. , Burgess, R. , Iasemidis, L. , Najm, I. , & Alexopoulos, A. V. (2023). Novel noninvasive identification of patient‐specific epileptic networks in focal epilepsies: Linking single‐photon emission computed tomography perfusion during seizures with resting‐state magnetoencephalography dynamics. Human Brain Mapping, 44(4), 1695–1710. 10.1002/hbm.26168
Funding information American Epilepsy Society, Grant/Award Number: 367395
DATA AVAILABILITY STATEMENT
Raw MEG and SPECT data are not publicly available due to patient privacy restrictions. However, de‐identified data can be made available upon reasonable request and completion of a formal data‐sharing agreement.
REFERENCES
- Antony, A. R. , Alexopoulos, A. V. , González‐Martínez, J. A. , Mosher, J. C. , Jehi, L. , Burgess, R. C. , So, N. K. , & Galán, R. F. (2013). Functional connectivity estimated from intracranial EEG predicts surgical outcome in intractable temporal lobe epilepsy. PLoS One, 8, e77916. 10.1371/journal.pone.0077916 [DOI] [PMC free article] [PubMed] [Google Scholar]
- Arthuis, M. , Valton, L. , Régis, J. , Chauvel, P. , Wendling, F. , Naccache, L. , Bernard, C. , & Bartolomei, F. (2009). Impaired consciousness during temporal lobe seizures is related to increased long‐distance cortical–subcortical synchronization. Brain, 132, 2091–2101. 10.1093/brain/awp086 [DOI] [PubMed] [Google Scholar]
- Bartolomei, F. , Wendling, F. , Vignal, J.‐P. , Kochen, S. , Bellanger, J.‐J. , Badier, J.‐M. , Le Bouquin‐Jeannes, R. , & Chauvel, P. (1999). Seizures of temporal lobe epilepsy: Identification of subtypes by coherence analysis using stereo‐electro‐encephalography. Clinical Neurophysiology, 110, 1741–1754. 10.1016/S1388-2457(99)00107-8 [DOI] [PubMed] [Google Scholar]
- Benjamini, Y. , & Hochberg, Y. (1995). Controlling the false discovery rate: A practical and powerful approach to multiple testing. Journal of the Royal Statistical Society, Series B, 57, 289–300. 10.2307/2346101 [DOI] [Google Scholar]
- Bettus, G. , Ranjeva, J.‐P. , Wendling, F. , Bénar, C. G. , Confort‐Gouny, S. , Régis, J. , Chauvel, P. , Cozzone, P. J. , Lemieux, L. , Bartolomei, F. , & Guye, M. (2011). Interictal functional connectivity of human epileptic networks assessed by intracerebral EEG and BOLD signal fluctuations. PLoS One, 6, e20071. 10.1371/journal.pone.0020071 [DOI] [PMC free article] [PubMed] [Google Scholar]
- Blumenfeld, H. , McNally, K. A. , Vanderhill, S. D. , Paige, A. L. , Chung, R. , Davis, K. , Norden, A. D. , Stokking, R. , Studholme, C. , Novotny, E. J. , Zubal, I. G. , & Spencer, S. S. (2004). Positive and negative network correlations in temporal lobe epilepsy. Cerebral Cortex, 14, 892–902. 10.1093/cercor/bhh048 [DOI] [PubMed] [Google Scholar]
- Blumenfeld, H. , Rivera, M. , McNally, K. A. , Davis, K. , Spencer, D. D. , & Spencer, S. S. (2004). Ictal neocortical slowing in temporal lobe epilepsy. Neurology, 63, 1015–1021. 10.1212/01.WNL.0000141086.91077.CD [DOI] [PubMed] [Google Scholar]
- Blumenfeld, H. , Rivera, M. , Vasquez, J. G. , Shah, A. , Ismail, D. , Enev, M. , & Zaveri, H. P. (2007). Neocortical and thalamic spread of amygdala kindled seizures. Epilepsia, 48, 254–262. 10.1111/j.1528-1167.2006.00934.x [DOI] [PubMed] [Google Scholar]
- Bokil, H. , Andrews, P. , Kulkarni, J. E. , Mehta, S. , & Mitra, P. P. (2010). Chronux: A platform for analyzing neural signals. Journal of Neuroscience Methods, 192, 146–151. 10.1016/J.JNEUMETH.2010.06.020 [DOI] [PMC free article] [PubMed] [Google Scholar]
- Bouilleret, V. , Valenti, M. P. , Hirsch, E. , Semah, F. , & Namer, I. J. (2002). Correlation between PET and SISCOM in temporal lobe epilepsy. Journal of Nuclear Medicine, 43, 991–998. [PubMed] [Google Scholar]
- Cleeren, E. , Premereur, E. , Casteels, C. , Goffin, K. , Janssen, P. , & Van Paesschen, W. (2016). The effective connectivity of the seizure onset zone and ictal perfusion changes in amygdala kindled rhesus monkeys. NeuroImage: Clinical, 12, 252–261. 10.1016/j.nicl.2016.05.020 [DOI] [PMC free article] [PubMed] [Google Scholar]
- Dale, A. M. , Fischl, B. , & Sereno, M. I. (1999). Cortical surface‐based analysis: I. Segmentation and surface reconstruction. NeuroImage, 9, 179–194. 10.1006/nimg.1998.0395 [DOI] [PubMed] [Google Scholar]
- Dale, A. M. , Liu, A. K. , Fischl, B. R. , Buckner, R. L. , Belliveau, J. W. , Lewine, J. D. , & Halgren, E. (2000). Dynamic statistical parametric mapping: Combining fMRI and MEG for high‐resolution imaging of cortical activity. Neuron, 26, 55–67. [DOI] [PubMed] [Google Scholar]
- Dupont, P. , Van Paesschen, W. , Palmini, A. , Ambayi, R. , Van Loon, J. , Goffin, J. , Weckhuysen, S. , Sunaert, S. , Thomas, B. , Demaerel, P. , Sciot, R. , Becker, A. J. , Vanbilloen, H. , Mortelmans, L. , & Van Laere, K. (2006). Ictal perfusion patterns associated with single MRI‐visible focal dysplastic lesions: Implications for the noninvasive delineation of the epileptogenic zone. Epilepsia, 47, 1550–1557. 10.1111/j.1528-1167.2006.00628.x [DOI] [PubMed] [Google Scholar]
- El Tahry, R. , Wang, Z. I. , Thandar, A. , Podkorytova, I. , Krishnan, B. , Tousseyn, S. , Guiyun, W. , Burgess, R. C. , & Alexopoulos, A. V. (2018). Magnetoencephalography and ictal SPECT in patients with failed epilepsy surgery. Clinical Neurophysiology, 129, 1651–1657. 10.1016/J.CLINPH.2018.05.010 [DOI] [PubMed] [Google Scholar]
- Englot, D. J. , Hinkley, L. B. , Kort, N. S. , Imber, B. S. , Mizuiri, D. , Honma, S. M. , Findlay, A. M. , Garrett, C. , Cheung, P. L. , Mantle, M. , Tarapore, P. E. , Knowlton, R. C. , Chang, E. F. , Kirsch, H. E. , & Nagarajan, S. S. (2015). Global and regional functional connectivity maps of neural oscillations in focal epilepsy. Brain, 138, 2249–2262. 10.1093/brain/awv130 [DOI] [PMC free article] [PubMed] [Google Scholar]
- Englot, D. J. , & Lagrange, A. H. (2022). Of blobs and buzzes: Does SISCOM imaging actually help SEEG planning? Epilepsy Currents, 22(1), 22–24. 10.1177/15357597211025408 [DOI] [PMC free article] [PubMed] [Google Scholar]
- Fahoum, F. , Zelmann, R. , Tyvaert, L. , Dubeau, F. , & Gotman, J. (2013). Epileptic discharges affect the default mode network – fMRI and intracerebral EEG evidence. PLoS One, 8, e68038. 10.1371/journal.pone.0068038 [DOI] [PMC free article] [PubMed] [Google Scholar]
- Friston, K. J. , Frith, C. D. , Liddle, P. F. , & Frackowiak, R. S. J. (1993). Functional connectivity: The principal‐component analysis of large (PET) data sets. Journal of Cerebral Blood Flow & Metabolism, 13, 5–14. 10.1038/jcbfm.1993.4 [DOI] [PubMed] [Google Scholar]
- Halász, P. (2010). The concept of epileptic networks. Part 1. Ideggyógyászati Szemle, 63, 293–303. [PubMed] [Google Scholar]
- Honey, C. J. , Sporns, O. , Cammoun, L. , Gigandet, X. , Thiran, J. P. , Meuli, R. , & Hagmann, P. (2009). Predicting human resting‐state functional connectivity from structural connectivity. Proceedings of the National Academy of Sciences, 106, 2035–2040. 10.1073/pnas.0811168106 [DOI] [PMC free article] [PubMed] [Google Scholar]
- Huang, M. X. , Mosher, J. C. , & Leahy, R. M. (1999). A sensor‐weighted overlapping‐sphere head model and exhaustive head model comparison for MEG. Physics in Medicine and Biology, 44, 423–440. [DOI] [PubMed] [Google Scholar]
- Hyvärinen, A. , & Oja, E. (2000). Independent component analysis: Algorithms and applications. Neural Networks, 13, 411–430. 10.1016/S0893-6080(00)00026-5 [DOI] [PubMed] [Google Scholar]
- Iasemidis, L. D. , Pardalos, P. M. , Shiau, D. S. , Chaovalitwongse, W. , Narayanan, K. , Kumar, S. , Carney, P. R. , & Sackellares, J. C. (2003). Prediction of human epileptic seizures based on optimization and phase changes of brain electrical activity. Optimization Methods and Software, 18, 81–104. [Google Scholar]
- Kakisaka, Y. , Wang, Z. I. , Mosher, J. C. , Dubarry, A.‐S. , Alexopoulos, A. V. , Enatsu, R. , Kotagal, P. , & Burgess, R. C. (2012). Clinical evidence for the utility of movement compensation algorithm in magnetoencephalography: Successful localization during focal seizure. Epilepsy Research, 101, 191–196. [DOI] [PMC free article] [PubMed] [Google Scholar]
- Kaminska, A. , Chiron, C. , Ville, D. , Dellatolas, G. , Hollo, A. , Cieuta, C. , Jalin, C. , Delalande, O. , Fohlen, M. , Vera, P. , Soufflet, C. , & Dulac, O. (2003). Ictal SPECT in children with epilepsy: Comparison with intracranial EEG and relation to postsurgical outcome. Brain, 126, 248–260. 10.1093/brain/awg013 [DOI] [PubMed] [Google Scholar]
- Kim, J. H. , Im, K. C. , Kim, J. S. , Lee, S.‐A. , Lee, J. K. , Khang, S. K. , & Kang, J. K. (2007). Ictal hyperperfusion patterns in relation to ictal scalp EEG patterns in patients with unilateral hippocampal sclerosis: A SPECT study. Epilepsia, 48, 270–277. 10.1111/j.1528-1167.2006.00847.x [DOI] [PubMed] [Google Scholar]
- Knowlton, R. C. , Elgavish, R. A. , Limdi, N. , Bartolucci, A. , Ojha, B. , Blount, J. , Burneo, J. G. , Ver Hoef, L. , Paige, L. , Faught, E. , Kankirawatana, P. , Riley, K. , & Kuzniecky, R. (2008). Functional imaging: I. relative predictive value of intracranial electroencephalography. Annals of Neurology, 64, 25–34. 10.1002/ana.21389 [DOI] [PubMed] [Google Scholar]
- Kramer, M. A. , & Cash, S. S. (2012). Epilepsy as a disorder of cortical network organization. The Neuroscientist, 18, 360–372. 10.1177/1073858411422754 [DOI] [PMC free article] [PubMed] [Google Scholar]
- Krishnan, B. , Faith, A. , Vlachos, I. , Roth, A. , Williams, K. , Noe, K. , Drazkowski, J. , Tapsell, L. , Sirven, J. , & Iasemidis, L. (2011). Resetting of brain dynamics: Epileptic versus psychogenic nonepileptic seizures. Epilepsy & Behavior, 22, S74–S81. [DOI] [PMC free article] [PubMed] [Google Scholar]
- Krishnan, B. , Tousseyn, S. , Sateesh Nayak, C. , Aung, T. , Kheder, A. , Wang, Z. I. , Wu, G. , Gonzalez‐Martinez, J. , Nair, D. , Burgess, R. , Iasemidis, L. , Najm, I. , Bulacio, J. , & Alexopoulos, A. V. (2021). Neurovascular networks in epilepsy: Correlating ictal blood perfusion with intracranial electrophysiology. NeuroImage, 231, 117838. [DOI] [PubMed] [Google Scholar]
- Krishnan, B. , Vlachos, I. , Wang, Z. I. , Mosher, J. , Najm, I. , Burgess, R. , Iasemidis, L. , & Alexopoulos, A. V. (2015). Epileptic focus localization based on resting state interictal MEG recordings is feasible irrespective of the presence or absence of spikes. Clinical Neurophysiology, 126, 667–674. 10.1016/j.clinph.2014.07.014 [DOI] [PubMed] [Google Scholar]
- Kucyi, A. , Schrouff, J. , Bickel, S. , Foster, B. L. , Shine, J. M. , & Parvizi, J. (2018). Intracranial electrophysiology reveals reproducible intrinsic functional connectivity within human brain networks. The Journal of Neuroscience, 38, 4230–4242. 10.1523/JNEUROSCI.0217-18.2018 [DOI] [PMC free article] [PubMed] [Google Scholar]
- Lachaux, J. P. , Rodriguez, E. , Martinerie, J. , & Varela, F. J. (1999). Measuring phase synchrony in brain signals. Human Brain Mapping, 8, 194–208. [DOI] [PMC free article] [PubMed] [Google Scholar]
- Lagarde, S. , Roehri, N. , Lambert, I. , Trebuchon, A. , McGonigal, A. , Carron, R. , Scavarda, D. , Milh, M. , Pizzo, F. , Colombet, B. , Giusiano, B. , Medina Villalon, S. , Guye, M. , Bénar, C.‐G. , & Bartolomei, F. (2018). Interictal stereotactic‐EEG functional connectivity in refractory focal epilepsies. Brain, 141, 2966–2980. 10.1093/brain/awy214 [DOI] [PubMed] [Google Scholar]
- Lee, J. Y. , Joo, E. Y. , Park, H. S. , Song, P. , Young Byun, S. , Seo, D. W. , & Hong, S. B. (2011). Repeated ictal SPECT in partial epilepsy patients: SISCOM analysis. Epilepsia, 52, 2249–2256. 10.1111/j.1528-1167.2011.03257.x [DOI] [PubMed] [Google Scholar]
- Lee, U. , Kim, S. , Noh, G.‐J. , Choi, B.‐M. , Hwang, E. , & Mashour, G. A. (2009). The directionality and functional organization of frontoparietal connectivity during consciousness and anesthesia in humans. Consciousness and Cognition, 18, 1069–1078. 10.1016/J.CONCOG.2009.04.004 [DOI] [PubMed] [Google Scholar]
- Lowet, E. , Roberts, M. J. , Bonizzi, P. , Karel, J. , & De Weerd, P. (2016). Quantifying neural oscillatory synchronization: A comparison between spectral coherence and phase‐locking value approaches. PLoS One, 11, e0146443. 10.1371/journal.pone.0146443 [DOI] [PMC free article] [PubMed] [Google Scholar]
- Malinowska, U. , Badier, J. M. , Gavaret, M. , Bartolomei, F. , Chauvel, P. , & Bénar, C. G. (2014). Interictal networks in magnetoencephalography. Human Brain Mapping, 35, 2789–2805. 10.1002/hbm.22367 [DOI] [PMC free article] [PubMed] [Google Scholar]
- Marshall, T. R. , Bergmann, T. O. , & Jensen, O. (2015). Frontoparietal structural connectivity mediates the top‐down control of neuronal synchronization associated with selective attention. PLoS Biology, 13, e1002272. 10.1371/journal.pbio.1002272 [DOI] [PMC free article] [PubMed] [Google Scholar]
- Murakami, H. , Wang, Z. I. , Marashly, A. , Krishnan, B. , Prayson, R. A. , Kakisaka, Y. , Mosher, J. C. , Bulacio, J. , Gonzalez‐Martinez, J. A. , Bingaman, W. E. , Najm, I. M. , Burgess, R. C. , & Alexopoulos, A. V. (2016). Correlating magnetoencephalography to stereo‐electroencephalography in patients undergoing epilepsy surgery. Brain, 139, 2935–2947. 10.1093/brain/aww215 [DOI] [PMC free article] [PubMed] [Google Scholar]
- Newey, C. R. , Wong, C. , Irene Wang, Z. , Chen, X. , Wu, G. , & Alexopoulos, A. V. (2013). Optimizing SPECT SISCOM analysis to localize seizure‐onset zone by using varying z scores. Epilepsia, 54, 793–800. 10.1111/epi.12139 [DOI] [PubMed] [Google Scholar]
- Newton, M. R. , Berkovic, S. F. , Austin, M. C. , Rowe, C. C. , McKay, W. J. , & Bladin, P. F. (1995). SPECT in the localisation of extratemporal and temporal seizure foci. Journal of Neurology, Neurosurgery, and Psychiatry, 59, 26–30. 10.1136/JNNP.59.1.26 [DOI] [PMC free article] [PubMed] [Google Scholar]
- Nissen, I. A. , van Klink, N. E. C. , Zijlmans, M. , Stam, C. J. , & Hillebrand, A. (2016). Brain areas with epileptic high frequency oscillations are functionally isolated in MEG virtual electrode networks. Clinical Neurophysiology, 127, 2581–2591. 10.1016/J.CLINPH.2016.04.013 [DOI] [PubMed] [Google Scholar]
- Percha, B. , Dzakpasu, R. , Zochowski, M. , & Parent, J. (2005). Transition from local to global phase synchrony in small world neural network and its possible implications for epilepsy. Physical Review E: Statistical, Nonlinear, and Soft Matter Physics, 72, 031909. 10.1103/PhysRevE.72.031909 [DOI] [PubMed] [Google Scholar]
- Pizzo, F. , Roehri, N. , Medina Villalon, S. , Trébuchon, A. , Chen, S. , Lagarde, S. , Carron, R. , Gavaret, M. , Giusiano, B. , McGonigal, A. , Bartolomei, F. , Badier, J. M. , & Bénar, C. G. (2019). Deep brain activities can be detected with magnetoencephalography. Nature Communications, 10, 971. 10.1038/s41467-019-08665-5 [DOI] [PMC free article] [PubMed] [Google Scholar]
- Rose, D. F. , Fujiwara, H. , Holland‐Bouley, K. , Greiner, H. M. , Arthur, T. , & Mangano, F. T. (2013). Focal peak activities in spread of interictal‐ictal discharges in epilepsy with beamformer MEG: Evidence for an epileptic network? Frontiers in Neurology, 4, 56. 10.3389/fneur.2013.00056 [DOI] [PMC free article] [PubMed] [Google Scholar]
- Schneider, F. , Irene Wang, Z. , Alexopoulos, A. V. , Almubarak, S. , Kakisaka, Y. , Jin, K. , Nair, D. , Mosher, J. C. , Najm, I. M. , & Burgess, R. C. (2013). Magnetic source imaging and ictal SPECT in MRI‐negative neocortical epilepsies: Additional value and comparison with intracranial EEG. Epilepsia, 54, 359–369. 10.1111/epi.12004 [DOI] [PubMed] [Google Scholar]
- Shin, W. C. , Hong, S. B. , Tae, W. S. , & Kim, S. E. (2002). Ictal hyperperfusion patterns according to the progression of temporal lobe seizures. Neurology, 58, 373–380. 10.1212/WNL.58.3.373 [DOI] [PubMed] [Google Scholar]
- Shon, Y.‐M. , Lee, K. J. , Kim, H. J. , Chung, Y.‐A. , Ahn, K. J. , Kim, Y. I. , Yang, D. W. , & Kim, B. S. (2005). Effect of chronic deep brain stimulation of the subthalamic nucleus for frontal lobe epilepsy: Subtraction SPECT analysis. Stereotactic and Functional Neurosurgery, 83, 84–90. 10.1159/000086867 [DOI] [PubMed] [Google Scholar]
- Spanaki, M. V. , Zubal, I. G. , MacMullan, J. , & Spencer, S. S. (1999). Periictal SPECT localization verified by simultaneous intracranial EEG. Epilepsia, 40, 267–274. 10.1111/j.1528-1157.1999.tb00703.x [DOI] [PubMed] [Google Scholar]
- Spencer, S. S. (2002). Neural networks in human epilepsy: Evidence of and implications for treatment. Epilepsia, 43, 219–227. [DOI] [PubMed] [Google Scholar]
- Tadel, F. , Baillet, S. , Mosher, J. C. , Pantazis, D. , & Leahy, R. M. (2011). Brainstorm: A user‐friendly application for MEG/EEG analysis. Computational Intelligence and Neuroscience, 2011, 879716. 10.1155/2011/879716 [DOI] [PMC free article] [PubMed] [Google Scholar]
- Tagliazucchi, E. , & Laufs, H. (2014). Decoding wakefulness levels from typical fMRI resting‐state data reveals reliable drifts between wakefulness and sleep. Neuron, 82, 695–708. 10.1016/J.NEURON.2014.03.020 [DOI] [PubMed] [Google Scholar]
- Taulu, S. , & Hari, R. (2009). Removal of magnetoencephalographic artifacts with temporal signal‐space separation: Demonstration with single‐trial auditory‐evoked responses. Human Brain Mapping, 30, 1524–1534. 10.1002/hbm.20627 [DOI] [PMC free article] [PubMed] [Google Scholar]
- Thomson, D. J. (1982). Spectrum estimation and harmonic analysis. Proceedings of the IEEE, 70, 1055–1096. 10.1109/PROC.1982.12433 [DOI] [Google Scholar]
- Tousseyn, S. , Dupont, P. , Goffin, K. , Sunaert, S. , & Van Paesschen, W. (2015). Correspondence between large‐scale ictal and interictal epileptic networks revealed by single photon emission computed tomography (SPECT) and electroencephalography (EEG)‐functional magnetic resonance imaging (fMRI). Epilepsia, 56, 382–392. 10.1111/epi.12910 [DOI] [PubMed] [Google Scholar]
- Tousseyn, S. , Krishnan, B. , Wang, Z. I. , Wongwiangjunt, S. , Nayak, C. S. , Mosher, J. C. , Wu, G. , Van Paesschen, W. , Leahy, R. M. , Gonzalez‐Martinez, J. A. , Bulacio, J. , Najm, I. M. , Alexopoulos, A. V. , & Nair, D. R. (2017). Connectivity in ictal single photon emission computed tomography perfusion: A cortico‐cortical evoked potential study. Brain, 42, 282–286. 10.1093/brain/awx123 [DOI] [PMC free article] [PubMed] [Google Scholar]
- Turner, K. L. , Gheres, K. W. , Proctor, E. A. , & Drew, P. J. (2020). Neurovascular coupling and bilateral connectivity during NREM and REM sleep. eLife, 9, 1. 10.7554/ELIFE.62071 [DOI] [PMC free article] [PubMed] [Google Scholar]
- Usami, K. , Matsumoto, R. , Kobayashi, K. , Hitomi, T. , Shimotake, A. , Kikuchi, T. , Matsuhashi, M. , Kunieda, T. , Mikuni, N. , Miyamoto, S. , Fukuyama, H. , Takahashi, R. , & Ikeda, A. (2015). Sleep modulates cortical connectivity and excitability in humans: Direct evidence from neural activity induced by single‐pulse electrical stimulation. Human Brain Mapping, 36, 4714–4729. 10.1002/HBM.22948 [DOI] [PMC free article] [PubMed] [Google Scholar]
- Van Laere, K. , Vonck, K. , Boon, P. , Versijpt, J. , & Dierckx, R. (2002). Perfusion SPECT changes after acute and chronic vagus nerve stimulation in relation to prestimulus condition and long‐term clinical efficacy. Journal of Nuclear Medicine, 43, 733 LP–744. [PubMed] [Google Scholar]
- Van Paesschen, W. (2004). Ictal SPECT. Epilepsia, 45, 35–40. 10.1111/j.0013-9580.2004.04008.x [DOI] [PubMed] [Google Scholar]
- Van Paesschen, W. , Dupont, P. , Van Driel, G. , Van Billoen, H. , & Maes, A. (2003). SPECT perfusion changes during complex partial seizures in patients with hippocampal sclerosis. Brain, 126, 1103–1111. 10.1093/brain/awg108 [DOI] [PubMed] [Google Scholar]
- Varghese, G. I. , Purcaro, M. J. , Motelow, J. E. , Enev, M. , McNally, K. A. , Levin, A. R. , Hirsch, L. J. , Tikofsky, R. , Paige, A. L. , Zubal, I. G. , Spencer, S. S. , & Blumenfeld, H. (2009). Clinical use of ictal SPECT in secondarily generalized tonic–clonic seizures. Brain, 132, 2102–2113. 10.1093/brain/awp027 [DOI] [PMC free article] [PubMed] [Google Scholar]
- Vaudano, A. E. , Carmichael, D. W. , Salek‐Haddadi, A. , Rampp, S. , Stefan, H. , Lemieux, L. , & Koepp, M. J. (2012). Networks involved in seizure initiation. A reading epilepsy case studied with EEG‐fMRI and MEG. Neurology, 79, 249–253. 10.1212/WNL.0b013e31825fdf3a [DOI] [PMC free article] [PubMed] [Google Scholar]
- Vlachos, I. , Krishnan, B. , Treiman, D. , Tsakalis, K. , Kugiumtzis, D. , & Iassemidis, L. (2016). The concept of effective inflow: Application to interictal localization of the epileptogenic focus from iEEG. IEEE Transactions on Bio‐medical Engineering, 64, 2241–2252. 10.1109/TBME.2016.2633200 [DOI] [PubMed] [Google Scholar]
- Yu, T. , Wang, X. , Li, Y. , Zhang, G. , Worrell, G. , Chauvel, P. , Ni, D. , Qiao, L. , Liu, C. , Li, L. , Ren, L. , & Wang, Y. (2018). High‐frequency stimulation of anterior nucleus of thalamus desynchronizes epileptic network in humans. Brain, 141, 2631–2643. 10.1093/BRAIN/AWY187 [DOI] [PubMed] [Google Scholar]
Associated Data
This section collects any data citations, data availability statements, or supplementary materials included in this article.
Supplementary Materials
Data S1: Supporting Information
Data Availability Statement
Raw MEG and SPECT data are not publicly available due to patient privacy restrictions. However, de‐identified data can be made available upon reasonable request and completion of a formal data‐sharing agreement.