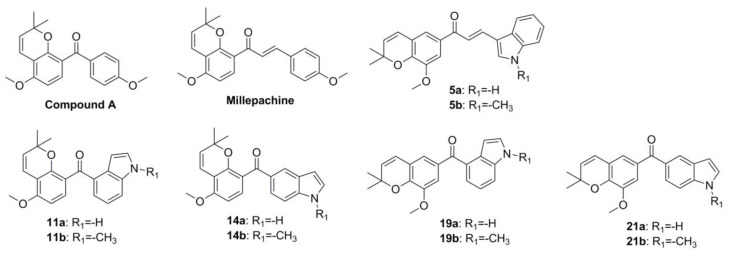
Table 1.
The antiproliferative activities evaluated in five kinds of human cancer cell lines a.

| |||||
|---|---|---|---|---|---|
| Compds | IC50, Mean ± SE (μΜ) b | ||||
| A549 | Caski | HepG2 | C42B | MCF-7 | |
| 5a | 0.812 ± 0.022 | 1.929 ± 0.035 | 0.963 ± 0.032 | 1.377 ± 0.021 | 1.553 ± 0.014 |
| 5b | 0.362 ± 0.017 | 0.729 ± 0.033 | 0.461 ± 0.017 | 0.577 ± 0.021 | 0.350 ± 0.011 |
| 11a | 0.631 ± 0.018 | 0.832 ± 0.011 | 0.998 ± 0.034 | 0.911 ± 0.034 | 0.816 ± 0.045 |
| 11b | 0.208 ± 0.009 | 0.516 ± 0.012 | 0.454 ± 0.021 | 0.455 ± 0.015 | 0.651 ± 0.024 |
| 14a | 0.072 ± 0.004 | 0.086 ± 0.009 | 0.142 ± 0.014 | 0.089 ± 0.021 | 0.082 ± 0.011 |
| 14b | 0.022 ± 0.002 | 0.037 ± 0.003 | 0.074 ± 0.013 | 0.051 ± 0.005 | 0.027 ± 0.006 |
| 19a | 1.321 ± 0.016 | 2.311 ± 0.019 | 3.098 ± 0.021 | 2.411 ± 0.042 | 1.775 ± 0.004 |
| 19b | 0.642 ± 0.081 | 1.098 ± 0.032 | 0.898 ± 0.009 | 1.076 ± 0.034 | 1.021 ± 0.015 |
| 21a | 0.105 ± 0.011 | 0.211 ± 0.012 | 0.441 ± 0.071 | 0.209 ± 0.020 | 0.121 ± 0.021 |
| 21b | 0.082 ± 0.010 | 0.106 ± 0.012 | 0.097 ± 0.031 | 0.107 ± 0.006 | 0.099 ± 0.031 |
| Compd. A | 0.226 ± 0.035 | 0.892 ± 0.024 | 0.758 ± 0.017 | 0.526 ± 0.007 | 0.456 ± 0.021 |
| Millepachine | 2.566 ± 0.131 | 6.712 ± 0.233 | 3.881 ± 0.244 | 3.176 ± 0.384 | 4.528 ± 0.338 |
a Cell lines were treated with different concentrations of the compounds for 48 h. Cell viability was measured by a CCK-8 assay, as described in the Materials and Methods section. b IC50 values are indicated as the mean ± SE (standard error) of at least three independent experiments.
