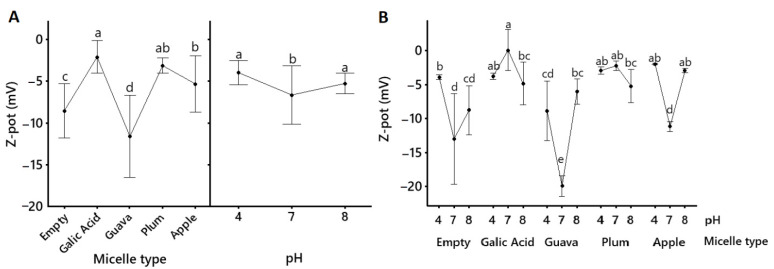
Figure 3.
Mean values (mean ± 95% confidence interval, n = 6) for the ζ potential (Z-pot) of pure gallic acid and apple peel (M. domestica cv. Anna), plum (P. domestica cv. Satsuma), and guava (P. guajava L.) fruit extracts that were solubilized into polysorbate-based micellar formulations. Lines connect mean values. Empty refers to a non-loaded micellar formulation. Inserts within (A) show the mean size of each micellar formulation (regardless of the pH) on the right and the mean size of all micellar formulations (regardless of the content) on the left; (B) shows mean size depending on pH and micelle content. Statistical differences between the type of micellar fruit extract, the pH, and the type of micellar fruit extract x pH were determined using a General Lineal Model, followed by Bonferroni’s multiple comparison post-hoc tests, and they are indicated by superscript letters (p < 0.05) (Minitab v.19.1.1., USA).

