

Abstract
Pathogenic microorganisms can grow accidentally on fish origin human food and can be a cause of human food‐borne illness. The purpose of this study was to estimate the occurrence and microbial load pattern of Escherichia coli, Salmonella, Staphylococcus aureus, and Shigella spp. along the fish origin food value chain. A total of 396 fish samples were collected by a systematic random sampling technique of cooked and raw in the three species of fish. Fish muscles were tested using selective media, followed by conventional biochemical tests. The bacterial load was assessed using a standard plate count method. Whereas the fungal load were measured by cultured in a Sabouraud's dextrose agar (SDA) medium. The overall prevalence was Escherichia coli 84 (21.21%), Salmonella 27 (6.82%), Staphylococcus aureus 19 (4.80%), and Shigella spp. 17 (4.29%). The average mean total coliform count was observed 1.2 × 10² cfu/g and 5.10 × 10⁴ cfu/g in cooked and raw fish samples, respectively. Whereas total viable count mean of 8.05 × 10⁴ cfu/g and 11.5 × 10⁴ cfu/g in cooked and raw fish, respectively. The Fungal load counts under the range 5.6 × 101 cfu/g to 1.09 × 10³cfu/g were observed. The study has revealed that fish food in the study area has the possibility of microbial public health risk. Hence, it could be wise to improve the knowledge of key actors from harvesting to consumption to enhance the meals protection practices and high‐quality standards of fish foods.
Keywords: E. coli, fish food; microbial load; S. aureus; salmonella, Shigella
The microbiological contamination of fish and fish products can be a cause of human food‐borne illness. The occurrences and microbial load pattern of Escherichia coli, Salmonella, Staphylococcus aureus, and Shigella spp. and fungus in the fish origin foods along the value chain of the upper water shed of the Blue Nile River, Ethiopia, was estimated. The study has revealed that fish food in the study area has the possibility of microbial public health risk. Hence, it could be wise to improve the knowledge of key actors from harvesting to consumption to improve the food safety practices and quality standards of fish food.

1. INTRODUCTION
Fish and fishery products are the most necessary nutritious meals all over the world, which represent around 15–20% of all animal protein on a world basis (FAO, 2009). Fish gives 19% of animal protein consumption in Africans and performs a special role in supplying a range of micro nutrients and especially essential fatty acids which cannot substitute food commodities. In Africa, fish consumption is 10.8 kg/person/year (Tran et al., 2019). In Ethiopia, fish consumption is 0.2 kg/person/year (Breuil & Grima, 2014).
Numerous studies have been properly demonstrated that fish origin food has essential nutrients, such as proteins, minerals, vitamins; peptides, amino acids, selenium, and long‐chain n‐3 polyunsaturated fatty acids (LC n‐3 PUFAs). In addition to nutritional value, fish food consumption has been related to protective outcomes in opposition to cardiovascular disease (CVD) and has also been related to extended fetal and child development, as well as really helpful results in various different illnesses and clinical conditions (Rimm et al., 2018). The health‐promoting effects have mainly been attributed to the LC n‐3 PUFAs, Eicosapentanoic acid (EPA), and docosahexaenoic acid (DHA) (Zenebe et al., 2006).
However, in addition to the benefits, there are risks associated with bacterial contamination and other biological, chemical, and physical contaminations. Among the risks, microbiological contamination is the leading cause of fish food (WHO, 2007). As a result, fish food is a common source of food poisoning, causing illnesses with various levels of severity ranging from mild indisposition to persistent or life‐threatening illnesses (Goja et al., 2013). Microbial contamination, in addition to its health effects, can be a cause of food wastage. Thirty percent of the fish captured are lost due to microbial activity alone (Ghaly et al., 2010).
Food‐borne diseases are recognized to regularly occur and are related to low‐income countries, probably due to improper food handling, hygiene, lack of food safety laws and weak implementation systems, lack of economic assets to procure safety tools, and lack of education and/or training for different food handlers (Addis & Sisay, 2015; Goja et al., 2013; Haileselassie et al., 2013). In Ethiopia, animal and fish origin meals are the main sources of food‐borne ailments due to poor handling conditions and sanitation practices, inadequate food safety laws, weak regulatory structures, and lack of training for food handlers (Dabassa & Bacha, 2011; Fratamico et al., 2005). This low food safety and quality practice in developing countries aggravates fish food spoilage and contamination.
Of the range of pathogenic bacterial species that cause fish food‐borne diseases, E. coli, Sallmonella Shigella spp., and S. aureus (Food and Drug Administration's [FDA's], 2021; Gosa, 2015). The occurrence of these bacteria in food is directly related to contamination. For instance, if E. coli count in food sample is greater than 100 cfu/g, it is unacceptable for consumption and indicates a stage of contamination (CFS (Centre for Food Safety), 2014).
Hence, monitoring of bacterial load and its occurrence pattern in fish was of supreme importance in order to provide useful data regarding the public health risk profile of fish and fish products. This work result will aid in the development of appropriate management strategies for fish food‐borne diseases. Therefore, the objective of this study was to evaluate the occurrence of bacteria (E. coli, Salmonella, S. aureus, and Shigella spp.), their load, and fungal load along the fish value chain in the upper Blue Nile watershed.
2. MATERIALS AND METHODS
2.1. Description of study area
The study was conducted in Lake Tana and surrounding districts, in the upper Blue Nile River watershed area. It is located in the northwest part of Ethiopia. The lake is one of the largest (3600 km2) and best fishing sites in Ethiopia. Lake Tana is found at latitude 12°1′35.75″ N and longitude 37°18′12.54″ E. Temperatures range from 13°C to 22°C on an annual basis. The annual average rainfall of Lake Tana is 1248 mm (Stave et al., 2017).
The lake has three main commercially important fish groups such as: large Labeobarbus spp., African catfish (Clarias gariepinus), and Nile tilapia (Oreochromis niloticus). They are consumed by a larger part of the community and traded widely in the region, even in neighboring Sudan in dry form. There are 55 fishery enterprises and a total of 21,084 beneficiaries directly dependent on the fishing activities (Mengistu et al., 2017; Shewit et al., 2018). There are 10 geopolitical districts surrounding Lake Tana with their landing sites (Dembiya, Alefa, Takusa, Northachefer, Bahir Dar Zuria, Libokemkem, Dera, Fogera, Gondar Zuria, and Bahir Dar Town).
2.2. Targeted population and sample types
Fish were collected at six landing sites of Lake Tana (n = 250), and samples were taken from randomly selected from list of local fish retailers' (n = 66), fish restaurants and/or hotels (n = 30), operator hand swab (n = 18), filleting knife (n = 16), and filleting table/board/plastic sheet (n = 16) of the study area. In all, 396 samples were processed. The above (n = 250) sample was divided according to the site and species of fish. For instance, according to the fish species, African catfish (Clarius gariepinus) (n = 60), Nile tilapia (Oreochromis niloticus) (n = 102), and Labeobarbus spp. (n = 88) were collected. Filleted raw and cooked products were chosen for sampling. A fillet includes the flesh tissue part of fish.
2.3. Study design, sampling and sample analysis methods
The study was carried out from October 2019 to June 2021. A total of 396 (366 raw and 30 cooked) fish samples were collected. A systematic random sampling method was employed periodically to select the sample. A quantity of a 300 g sample was taken from filleted fish muscle tissue aseptically. Each specimen was placed in a plastic bag, sealed and kept in an ice bag, and transported within 4 h until the start of sample preparation and analysis.
Sampling from the hands of fish operators, the hands' backs, palms, and fingertips were rubbed with sterile saline dipped cotton swabs. Similarly, a cotton swab sample was also collected from a knife and a filleting /cutting board/ plastic sheet. Then, the swabs were removed and placed in a triangular flask container containing 50 ml of sterile saline, which was shaken strongly to make the 1:1 sample liquid. Collected samples were tagged with identification code and transported to Bahir Dar University for laboratory processing.
Laboratory procedures were conducted using selective culture media for each tested bacteria according to the codex of bacteriological analytical methods for food samples (FAO, 2011; WHO, 2015). Following that, biochemical tests for organism isolation and identification were performed in accordance with ISO 6887‐3: (2017) recommendation for microbiological evaluation of fish samples.
The bacterial load (total viable count and total coliform count) of uncooked and cooked fish samples was assessed using the standard plate count method. The colonies were counted using a digital colony counter for each plate and expressed as colony‐forming units of the suspension (cfu/g). The fungal load was measured by culture in a Sabouraud dextrose agar (SDA) medium (Gebala & Sandle, 2013). Then, the plates were incubated at room and body temperature to check dimorphism (25°C and 37°C) for 3–7 days. Then, the results were also presented/read using cfu/g.
2.3.1. Identification of E. coli
25 g of raw or cooked fish samples was homogenized for 2 min. in a sterile bag containing 225 ml of buffered peptone water (0.1%) (Lab M, UK) using a stomacher (Seward Stomacher 400 circulator, UK). All samples were inoculated onto eosin methylene blue medium (EMB) agar and incubated at 37°C for 24 h. Suspected colonies on EMB agar showed a green metallic sheen appearance and were subcultured on MacConkey agar medium and nutrient agar to get a pure colony and were incubated at 37°C for 24 h (Gupta et al., 2013). Colonies of E. coli on EMB suggest a green metallic sheen appearance. Colonies suspected to be E. coli were subjected to biochemical identification (Alexander et al., 2010).
The suspected result from the above media was inoculated into nutrient agar and tested by different biochemical tests: Indole test, Methyl red test, Simon citrate test, Triple sugar iron agar (TSI) test, and Urease test.
2.3.2. Identification of Salmonella
A 25‐g portion of fish muscle tissue was placed in a sterile plastic bag with 225 ml of buffered peptone water and homogenized with a stomacher. The combined sample was homogenized and incubated for 24 h at 37°C for pre‐enrichment broth media. Thus, 1 ml of aliquot (pre‐enrichment broth) inoculated into a tube containing 10 ml of Muller Kauffmann Tetrathionate broth (MKTT broth) and a Modified Semisolid Rappaport Vassiliadis broth (MSRV broth) was inoculated with around 50 μl of broth. Both media were incubated at 37°C for 24 h.
A loop full of (approximately 10 μl) MSRV broth and MKTT broth inoculums was transferred and streaked separately onto the surface of Xylose Lysine Deoxycholate agar (XLD agar); (Titan Biotech Ltd., Bhiwadi, India) and Ramback agar plate selective media separately. The plates were incubated at 37°C for 24 h. After proper incubation, the plates were examined for the presence of suspected Salmonella colonies; brown, gray, or pink colonies having a black center were taken for further biochemical confirmation of Salmonella (Mooijman et al., 2019).
Sallmonella suspected colony of culture test was biochemically confirmed by inoculating into triple sugar iron agar, methyl‐red‐Voges‐Proskauer broth, indole test, Simmons' citrate agar, urea agar, lysine iron agar, kligler's iron agar, and SIM medium, then incubating at 37°C for 24 hours (Mooijman et al., 2019).The result was interpreted according to ISO‐6579‐1, (2017).
2.3.3. Identification of Shigella spp.
25 g of homogenized sample was added into 225 ml of Gram‐negative (GN) (HuanKai Microbial, China) enrichment medium. After overnight incubation at 37°C, a loop full of the enriched culture was directly streaked onto Hektoen Enteric Agar (HEA) (HuanKai Microbial, China) and incubated aerobically at 37°C for 24 h. Then, the culture plates were examined for the presence of Shigella (small greenish colonies) (FDA, 2017; Trofa et al., 2009).
Colonies suspected to be Shigella were further characterized by standard biochemical tests; including triple sugar iron (TSI) agar, Urea Agar Base (Oxoid Ltd., Basingstoke, Hampshire, England), and the SIM test (Himedia Laboratories Pvt. Ltd. India) (H2S production, motility). The result of each biochemical test culture was read after incubation for 24–48 h at 37°C (FAO, 2018; FDA, 2017; WHO, 2015).
2.3.4. Detection of S. aureus
Occurrence and identification of S. aureus from fish samples was made by taking 25 gram of fish muscle and transferring it aseptically into a sterile stomacher bag containing 225 ml of buffered peptone water and homogenizing it for 1–3 min using a stomacher. A 10‐fold serial dilution was prepared by transferring 1 ml of the homogenized sample to 9 ml of diluents. From appropriate serial dilutions, 0.1 ml aliquots was spread on mannitol salt agar and incubated for 24–48 h at 37°C. Presumptive colonies were inoculated on Blood Agar plates (5% difibrinated sheep blood), and the plates were incubated aerobically at 37°C and examined after 24 h of incubation for growth and hemolytic pattern of S. aureus. Furthermore, the colonies were identified on the basis of staining reaction with gram's stain, pigment production, colony morphology, catalase test, and coagulase test. On blood agar, S. aureus displays a light to golden yellow pigment and colonies surrounded by zones of clear alpha hemolysis. Inoculated media were incubated as a negative control to check for sterility.
2.4. Statistical analysis
Findings of this study were statistically analyzed with SPSS version 23. Descriptive statistics were made for cooked or raw fillet samples for the site; a stage of the fish value chain of total aerobic plate count and coliforms was conducted.
2.5. Ethical appraisal
The study protocol was revised and accepted by the research ethics appraisal board of Bahir Dar University (Ref. No. 1/3040/1.2.9). Furthermore, verbal consent was gained from all study participants aforementioned to involvement by explaining positive and negative consequences. Study units were knowledgeable that they could withdraw their involvement without restriction at any time if they felt any discomfort. Privacy of the collected information and laboratory test results were kept.
3. RESULTS
3.1. Occurrences of indicator Bacteria's
Frequency data for all bacteria studied (individually and in combination) for a total of 396 (366 raw and 30 cooked) collected over 1 year and nine‐month survey period were summarized in Table 1. The percentage (%) of positives for each disease (E. coli, Salmonella, S. aureus, and Shigella spp.) was included in the table. Overall, the results revealed that the prevalence of bacterial contamination in the fish food was variable and ranged from 0% to 44.44%. Of a total of 396 samples taken, 84 (21.21%), 27 (6.82%), 19 (4.80%), and 17 (4.29%) were positive for E. coli, Salmonella, S. aureus, and Shigella spp. Isolates, respectively. Of the filleted fish samples from landing sites, 18 (17.65%) of Nile Tilapia, 10 (11.36%) of Labeo Barbus, and 8 (13.33%) of African catfish were positive for E. coli.
TABLE 1.
Bacterial contamination in fish origin food in our study area
| Target population | Category | No of samples | No of positives (%) | |||
|---|---|---|---|---|---|---|
| E. coli | Salmonella | S. aureus | Shigella spp. | |||
| Species | African Cat fish (Clarius gariepinus) | 60 | 8 (13.33) | 3 (5) | 3 (5) | 1 (1.67) |
| Nile tilapia (Oreochromis niloticus) | 102 | 18 (17.65) | 6 (5.88) | 4 (3.92) | 4 (3.92) | |
| Labeobarbus spp. | 88 | 10 (11.36) | 6 (6.82) | 5 (5.68) | 1 (1.14) | |
| Landing sites/location | Bahir Dar | 54 | 8 (14.81) | 6 (11.11) | 5 (9.26) | 2 (3.70) |
| Gorgora | 42 | 5 (11.90) | 1 (2.38) | 1 (2.38) | 1 (2.38) | |
| Aged kergna | 42 | 6 (14.29) | 0 | 0 | 0 | |
| Kunzela | 38 | 4 (10.53) | 2 (5.26) | 1 (2.63) | 1 (2.63) | |
| Esay Debre | 32 | 5 (15.63) | 2 (6.25) | 0 | 0 | |
| Delegie | 42 | 8 (19.05) | 4 (9.52) | 5 (11.90) | 2 (4.76) | |
| Fish retailer's | Whole sellers | 32 | 9 (28.13) | 2 (6.25) | 2 (6.25) | 2 (6.25) |
| Cooperatives | 34 | 11 (32.35) | 3 (8.82) | 3 (8.82) | 2 (5.88) | |
| Fish restaurants and hotels | Ready‐to‐eat cooked fish | 30 | 5 (16.67) | 4 (13.33) | 1 (3.33) | 2 (6.67) |
| Operators | Hand swab | 18 | 8 (44.44) | 2 (11.11) | 1 (5.56) | 3 (16.67) |
| Filleting knife | 16 | 7 (43.75) | 0 | 0 | 1 (6.25) | |
| Filleting table/board/plastic sheet | 16 | 7 (43.75) | 1 (6.25) | 0 | 1 (6.25) | |
| Ground total | 396 | 84 (21.21) | 27 (6.82) | 19 (4.80) | 17 (4.29) | |
The prevalence of indicator bacteria's situational analysis along the fish food value chain in the study area was also documented. The first value chain identified as a source of contaminants was landing sites, retailers, operators' hands and equipment, and ready‐to‐eat (cooked fish food). The main landing sites were chosen based on the following criteria: (i) a high human population density; (ii) a high amount of fish produced and collected; (iii) the existence of regulatory bodies; (iv) the presence of fish producer cooperatives and suppliers; and (v) geographical representativeness of the lake. Specifically, the landing sites (Bahir Dar, Gorgora, Aged kergna, Kunzela, Esay Debre, Delegie) were selected. In the above‐identified fish food value chain, the prevalence of indicator bacteria was up to 44.44% E. coli (Figure 1).
FIGURE 1.
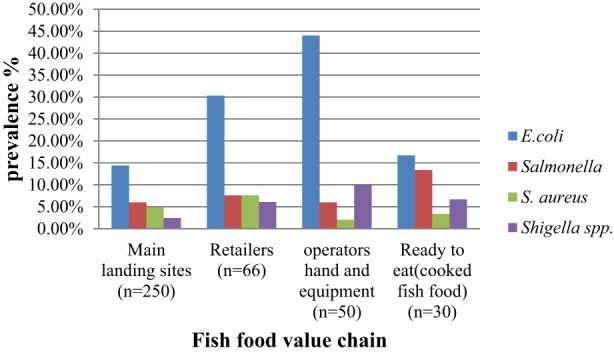
Bacterial prevalence along the fish food value chain in the study area
3.2. Overall bacterial and fungal contamination status
Enumeration of microbial growth was carried out in all positive samples, irrespective of the pathogen. Most of the microbial load was found to be above 100 cfu/g, a level deemed to represent a risk of public health. Total coliform, an indicator of fecal contamination, was found to be an average of 5.10 × 10⁴ CFU and 11.5 × 10⁴cfu/g of total viable count in raw fish origin food samples (Table 2).
TABLE 2.
Total bacterial and fungal load count from cooked and raw fish samples
| Measure | Samples type | Minimum count | Maximum count | Average count |
|---|---|---|---|---|
| Total coliform | Cooked | 1.4 × 10² cfu/g | 2.217 × 10³ cfu/g | 1.2 × 10² cfu/g |
| Raw (uncooked) | 1.2 × 10² cfu/g | 1.02 × 10⁵ cfu/g | 5.10 × 10⁴ cfu/g | |
| Total viable count | Cooked | 1 × 10³ cfu/g | 1.6 × 10⁵ cfu/g | 8.05 × 10⁴ cfu/g |
| Raw (uncooked) | 1.92 × 10² cfu/g | 2.3 × 10⁵ cfu/g | 11.5 × 10⁴ cfu/g | |
| Fungi | Cooked | 1.2 × 10² cfu/g | 1 × 10³ cfu/g | 5.6 × 101 cfu/g |
| Raw (uncooked) | 1.7 × 10² cfu/g | 2 × 10³ cfu/g | 1.09 × 10³cfu/g |
4. DISCUSSION
Despite the increasing use of fish origin food as a source of protein for nutritious meals and health benefits, there was a need to assess significant scientific evidence of microbial public health risks. Thus, this study highlights the microbial occurrences and burden of selected contamination indicator bacteria, such as E. coli, Salmonella, S. aureus, and Shigella spp. Due to the prevalence of bacterial contamination in the fish food in this study were 84 (21.21%), 27, (6.82%), 19 (4.80%), and 17 (4.29%) positive for E. coli, Salmonella, S. aureus, and Shigella spp. isolates, respectively.
The result of this study showed that E. coli prevalence was greater than the detection of Awot et al. (2019), nine (9.4%) E. coli isolates from 96 fish samples in fish meat retailing shops in Mekelle city, Ethiopia. But the current study finding was lower than that of Ayenadis and Aweke (2019), who reported that 80 (23.3%) E. coli was isolated from fish samples in Lake Hawassa, Southern Ethiopia. This result was also lower than the previous reports of Kumar et al. (2005) who estimate the prevalence of E. coli in tropical seafood and documented a prevalence of 47% for fecal coli forms including E. coli. In this study, the occurrence of E. coli was higher in raw fish than cooked fish samples. This might be the exposure to heat during processing the cooked fish samples. This work was agreed with the work of Gupta et al. (2013) who found 47 (48.95%) E. coli isolates in 96 raw fish samples and seven (12.96%) E. coli isolates in 88 ready‐to‐eat fish product samples. Thailambal (2006) and Omenwa et al. (2012) reported similar frequency occurrences of bacteria isolates from cooked fish foods.
Our study result was lower than Wendwesen et al. (2017), who showed 42.5% of raw fish samples had E. coli in Arba Minch town, Ethiopia. Moreover, this study indicated that five (16.67) of the cooked (fried fish, asa dulet, lebleb, etc…) fish samples had E. coli. Okonko et al. (2009) suggest that improper handling and improper hygiene might lead to the contamination of ready‐to‐eat foods, and this might eventually affect the health of consumers. The result of this study was higher than the result of Wendwesen et al. (2017) who reported that 7.5% of (asa lebleb) Nile tilapia fish muscle had E. coli from ready‐to‐eat fish foods in Arba Minch town, Ethiopia, and lower than Ohalete et al. (2013) report that 58.3% of fried fish had E. coli in Owerri, Nigeria.
With regard to the species of fish, the highest E. coli isolates 18(17.65%) were found in Nile Tilapia. This was agreed with previous reports by Hanson et al. (2008) who reported higher infection in plankton feeders (Nile tilapia species) of E. coli than in catfish. This finding disagrees with the reports of Ayenadis and Aweke (2019), who reported that there was no difference in the occurrence of E. coli in three species of fish. This potential disagreement might arise from the difference in sample size used, the ecosystem of the study area or sampling methods.
Of a total of 396 samples collected along the fish value chain, 27 (6.82) were found to be Salmonella positive (Table 2). The occurrence of Salmonella in this study was found to be lower than in the previous study conducted by Elhadi (2014) in Saudi Arabia, with an occurrence of 31–60% in fresh water fish samples. This result was also found to be lower than the occurrence of the previous study in China (12.4%) (Zhang et al., 2015), in Nigeria (11.5%) (Raufu et al., 2014) and higher than the study from Brazil (4%) (Ferreira et al., 2014). The reasons for these prevalence variations might be due to water quality and environmental distinctiveness (rainfall, temperature, sewage effluents; agricultural run‐off and direct fecal contamination from natural fauna) (Fernandes et al., 2018). In addition, food handlers' characteristics such as poor handling and processing practices might contribute to such a difference.
The number of S. aureus in the current study was 19 (4.80%). This finding was lower than with other researchers' findings in different areas of the globe. For instance, Mohammad et al. (2015) isolated 31.8% S. aureus in Egypt and Murugadas et al. (2016) isolated 36.5% S. aureus in Kerala, on the southwest coast of India. The result of this finding was also lower than that of Oh et al. (2007), Haiffa (2014), and Bujjamma and Padmavathi (2015), who reported that 17.7%, 19.8%, and 24.47% in Korea, Mosul City, Iraq, and Andhra Pradesh, India, respectively. The presence of S. aureus in fish indicates improper handling and possible cross‐contamination (Da Silva et al., 2020). Human beings are the major source of S. aureus contamination of fishery products during handling, preparation, and serving. The existence of S. aureus is a potential health threat to consumers, especially fish that are often eaten without further heat (Haiffa, 2014).
In the present study, a relatively lower percentage of Shigella spp. isolation 17 (4.29%) was recorded along the value chain of fish food samples. In fact, high levels of three (16.67%) of Shigella spp. were found in the hand swabs of operators. Cooking and roasting were apparently efficient in killing these pathogens (Sichewo et al., 2014). Ready‐to‐eat fish at hotels and restaurants, two (6.67%) have direct exposure to consumers. There is a small number of Shigella spp. that can cause infection. Shigella spp. organisms are highly infectious, causing bacillary dysentery after ingestion of 10–100 organisms (Kosek et al., 2010). The reason that fresh fillets had more bacteria in this study might be that they were more liable for contamination during filleting and processing.
In our study, retailers, operators' hands, and equipment were relatively the highest bacterial occurrence recorded from fish food value chain identified. The isolation of E. coli, Salmonella, S. aureus, and Shigella spp. might be attributed to sewage pollution of human origin, animal feces or unsatisfactory hygienic conditions during catching, handling, and marketing of the fish (Penakalapati et al., 2017; Food and Drug Administration's (FDA's), 2021). For instance, the fish filletors in the study area use single piece of mosquito net for decreasing the slippery of fish mucus during filleting for long period of time without disinfecting or washing. They did not wear any contamination protective wears such as gown, glove, and boots. In addition, they use single knife, without disinfecting for long period of time, plastic sheet on contaminated ground (they did not use tables), number of peoples move here and there in filleting places, and the presence of high burden of fly may increase the contamination in our study area. The most fishing style is netted overnight it is not fresh and uses contaminated nets. In all circumstances of the fish value chain, product contamination has great public health significance due to its liable nature to pathogenic bacteria from human reservoirs during handling, processing, and packaging of fish (Ghanem et al., 2019). In general, the results obtained from this study give evidence of the unsatisfactory microbiological quality and safety of fish from the local artisanal fish value chain. The particular concern was the occurrence of key indicator pathogenic bacteria such as E. coli, Salmonella, S. aureus, and Shigella spp. as fish and their products contain hazardous microorganisms. The current results of E. coli, Salmonella, S. aureus, and Shigella spp. were not compatible with the standards of the (CFS (Centre for Food Safety), 2014) and the (APHA and WHO, 2004) and thus pose a significant public health risk.
This study's results indicate that a low mean value of bacterial load was found in ready‐to‐eat or cooked fish samples. This might be due to the negative effect of heat on the bacteria during fish origin food preparation. Our finding was that there was a lower microbial load compared with the results of Wendwesen et al. (2017) who reported that there were 4.63 × 10⁶ cfu/g in frozen raw Nile Tilapia fish samples and 4.92 × 10³ cfu/g in inadequately cooked fish origin foods in Arba Minch town, Ethiopia. The coliform load in raw fish samples was higher than the result of Dhanapal et al. (2012), who found 4.9 × 10⁴cfu/g and lower than the result of Wendwesen et al. (2017), who reported 4.63 × 10⁶cfu/g in frozen raw Nile tilapia fillet samples. The mean fungal load was measured by culture in a Sabouraud dextrose agar (SDA) medium and was 1.09 × 10³ cfu/g and 5.6 × 101 cfu/g in raw and cooked fish samples, respectively. This non‐negligible high microbial load in our study area might be due to the result of poor handling during transportation and/or poor personal hygiene during harvesting and filleting.
The Center for Food Safety organization has set minimum standards for the recovery of microorganisms from foods of various origins. When compared with that standard, the recovery rate in the current study result was higher, and this could be due to the absence of hygienic practices and strict follow‐up of this sector by the concerned authorities. According to CFS (Centre for Food Safety) (2014) guidelines, <20 cfu/g is satisfactory, 20–102 intermediate or border line and >102 unacceptable for human consumption. The average microbial load (total viable count and coliform count) of the fish samples was in an unacceptable range.
5. CONCLUSIONS
Most of the fish samples were found to contain higher microbial loads than prescribed standards. This indicates that E. coli, S. aureus, Salmonella, and Shigella spp are contaminants of fish in the study area, and their occurrence in fish could represent a risk to consumers. The total coliform, total viable, and fungal/mold count indicate that they were above the recommended level of the Centre for food safety standards. Due to this, fish handlers and processors should be trained on the hygienically and sanitary handling of foods. The sanitation of the filleting ground, fish harvesting materials, and fish landings in the study area should be kept clean. This indicates that there is an inadequate level of food safety and poor handling practices at every stage of the fish value chain. Therefore, fish harvester societies and handlers should undertake training and education on regarding safe food handling to prevent contamination. Processing plants should be built at each landing site with their facilities. A new code of practice to control infections of fish origin food should be installed in study area to ensure safe fish products. Education and training should be given to fish handlers.
5.1. Limitations
Confirmation of bacteria by molecular methods was not performed. Similarly, serotyping of isolated pathogens was not done.
FUNDING INFORMATION
Ethiopian Institute of Agricultural Research; National Fishery and Aquatic Life Research Centre; ref. No. 17.2/0409/2019.
CONFLICT OF INTEREST
The authors declare that they have no competing interests.
ACKNOWLEDGMENTS
We would like to thank the Ethiopian Institute of Agricultural Research, the National Fishery and Aquatic Life Research Centre, and Bahir Dar University for their financial, material, and ideal support. We would like to thank the fish processors in our area of study for cooperating during the sample collection.
Mitiku, B. A. , Mitiku, M. A. , Ayalew, G. G. , Alemu, H. Y. , Geremew, U. M. , & Wubayehu, M. T. (2023). Microbiological quality assessment of fish origin food along the production chain in upper Blue Nile watershed, Ethiopia. Food Science & Nutrition, 11, 1096–1103. 10.1002/fsn3.3147
DATA AVAILABILITY STATEMENT
All data and materials are available upon reasonable request from the corresponding author.
REFERENCES
- Addis, M. , & Sisay, D. (2015). A review on major food borne bacterial illnesses. Journal of Tropical Diseases, 3(4), 176–183. [Google Scholar]
- Alexander, T. , Inglis, G. , Yanke, J. , Topp, E. , Read, R. R. , & Reuter, M. T. (2010). Farm‐to‐fork characterization of Escherichia coli associated with feedlot cattle with a known history of antimicrobial use. International Journal of Food Microbiology, 137, 40–48. [DOI] [PubMed] [Google Scholar]
- APHA and WHO (2004). Shigellosis. In Heymann D. L. (Ed.), Control of communicable disease manual (18th ed., pp. 487–491). American Public Health Association. [Google Scholar]
- Awot, T. , Tehetna, A. , Shishay, A. , Belayneh, G. , Yohannes, H. , Tsegay, T. , & Netsanet, B. (2019). Isolation and antimicrobial sensitivity testing of E. coli from fish meat retailing shops of Mekelle City, Ethiopia. Ethiopian Journal of Science, 11(2), 229–238. [Google Scholar]
- Ayenadis, T. , & Aweke, E. (2019). Isolation, Identifi cation and antimicrobial susceptibility Profi le of E. coli (O157:H7) from fish in Lake Hawassa, Southern Ethiopia. International Journal of Veterinary Science & Technology, 3(1), 13–19. [Google Scholar]
- Breuil, C. , & Grima, D. (2014). Baseline report Ethiopia. Smart fish programme of the Indian Ocean Commission, fisheries managment of FAO component, Ebene, Mauritius. 1‐24 .
- Bujjamma, P. , & Padmavathi, P. (2015). Prevalence of Staphylococcus aureus in fish samples of local domestic fish market. International Journal of Current Microbiology and Applied Sciences, 4(5), 427–433 ISSN: 2319‐7706. [Google Scholar]
- CFS (Centre for Food Safety) . (2014). Microbiological guidelines for food (for ready‐to‐eat food in general and specific food items) (p. 10). Food and Environmental Hygiene Department, 43/F, Queens Way Government Offices. [Google Scholar]
- Dabassa, A. , & Bacha, K. (2011). The prevalence and antibiogram of Salmonella and Shigella isolated from abattoir, Jimma Town, South western Ethiopia (p. 169). Conference of Jimma University. [Google Scholar]
- Da Silva, A. C. , Rodrigue, M. X. , & Silva, N. C. (2020). Methicilline resistant Staphylococcus aureus in food & the prevalence in Brazil: A review. Brazilian Journal of Microbiology, 51(1), 347–356. [DOI] [PMC free article] [PubMed] [Google Scholar]
- Dhanapal, K. G. , Vidya, S. L. , Binay, B. N. , Venkateswarlu, G. , Devivaraprasad, A. R. , & Basu, S. (2012). Effect of cooking on physical, biochemical, bacteriological characteristics and fatty acid profile of tilapia (Oreochromis mossambicus) fish steaks. Archives of Applied Science Research, 4(2), 1142–1149. [Google Scholar]
- Elhadi, N. (2014). Prevalence and antimicrobial resistance of Salmonella spp. in raw retail frozen imported freshwater fish to Eastern Province of Saudi Arabia. Asian Pacific Journal of Tropical Biomedicine., 4(3), 234–238. [DOI] [PMC free article] [PubMed] [Google Scholar]
- FAO . (2011). Report of the joint FAO/WHO expert consultation on the risks and benefits of fish consumption, January, Rome, Italy (No. FIPM/R978 [En]) (pp. 25–29). World Health Organization. [Google Scholar]
- FAO . (2018). The state of world fisheries and aquaculture meeting the sustainable development goals. FAO. [Google Scholar]
- FAO (Food and agriculture organization of the United Nations) (2009). The state of food and agriculture. Available from http://www.fao.org/docrep/012/i0680e/i0680e.Pdf
- FDA (2017). BAM (Bacteriological Analytical Manual), Edition 8, Revision A. Available from: https://www.fda.gov/food/laboratory‐methods‐food
- Fernandes, D. V. , Castro, V. S. , Neto, A. D. , & Figueiredo, E. E. (2018). Salmonella spp. in the fish production chain: Review. Ciência Rural, 48(8), 1–9. [Google Scholar]
- Ferreira, M. , Lopes, S. , Pereira, M. , Rodrigues, C. , & Costa, N. (2014). Microbiological quality of the fish saw & the ice used for its conservation. Arquivos do instituto biologico, 81, 49–54. [Google Scholar]
- Food and Drug Administration's (FDA's) . (2021). Fish and fishery products hazards and controls guidance (4th ed., pp. 75–345). https://www.fda.gov/media/80637 [Google Scholar]
- Fratamico, P. M. , Bhunia, A. K. , & Smith, J. L. (2005). Foodborne pathogens: Microbiology and molecular biology (p. 454). Horizon Scientific Press. [Google Scholar]
- Gebala, B. , & Sandle, T. (2013). Comparison of different fungal agar for the environmental monitoring of pharmaceutical‐grade cleanrooms. PDA Journal of Pharmaceutical Science and Technology, 67(6), 621–633. [DOI] [PubMed] [Google Scholar]
- Ghaly, A. , Dave, D. , Budge, S. , & Brooks, M. S. (2010). Fish spoilage mechanisms and preservation techniques. American Journal of Applied Sciences, 7(7), 859–877. [Google Scholar]
- Ghanem, A. N. , Ibrahim, A. S. , & Mohammad, A. N. (2019). Incidence of some pathogenic bacteria in smoked and salted fish products. Alexandria Journal of Veterinary Science., 60(2), 104–109. [Google Scholar]
- Goja, A. M. , Ahmed, T. A. A. , Saeed, S. A. M. , & Dirar, H. A. (2013). Isolation and identification of staphylococcus spp. in fresh beef. Pakistan Journal of Nutrition, 12(2), 114. [Google Scholar]
- Gosa, G. (2015). Prevalence, antibiogram and growth potential of Salmonella and Shigella in Ethiopia: Implications for public health: A review. Research Journal of Microbiology, 10(7), 288–307. [Google Scholar]
- Gupta, B. , Ghatak, S. , & Gill, J. (2013). Incidence & virulence properties of E. coli isolated from fresh fish & ready‐ to‐ eat fish products. Veter World, 6, 5–9. [Google Scholar]
- Hafsat, A. G. , Yaqub, A. G. , Galadima, B. G. , James, A. , & Abubakar, S. (2015). Methicillin‐resistant staphylococcus aureus: A review. Advances in Animal and Veterinary Sciences, 3, 79–98. [Google Scholar]
- Haiffa, H. (2014). Isolation and identification of staphylococcus bacteria from fish of fresh water and its antibiotics sensitivity in Mosul city. Basrah Journal of Veterinary Research, 13(1), 33–42. [Google Scholar]
- Haileselassie, M. , Taddele, H. , Adhana, K. , & Kalayou, S. (2013). Food safety knowledge and practices of abattoir and butchery shops and the microbial profile of meat in Mekelle City, Ethiopia. Asian Pacific journal of tropical biomedicine., 3(5), 407–412. [DOI] [PMC free article] [PubMed] [Google Scholar]
- Hanson, S. , Austin, B. , & Austin, D. (2008). Bacterial fish pathogens. Diseases of farmed and wild fish 6th (pp. 1–9). Springer‐praxis publishing Ltd. [Google Scholar]
- Justine, F. , Henry, A. , Njom, C. , Ateba, N. , & Roland, N. N. (2020). Antibiotic resistance and virulence gene characteristics of methicillin‐resistant Staphylococcus aureus (MRSA) isolated from healthy edible marine fish. Hindawi International Journal of Microbiology, 2020, 9803903. [DOI] [PMC free article] [PubMed] [Google Scholar]
- Kosek, M. , Yori, P. P. , & Olortegui, M. P. (2010). Shigellosis update: Advancing antibiotic resistance, investment empowered vaccine development and green bananas. Current Opinion in Infectious Diseases, 23, 475–480. [DOI] [PMC free article] [PubMed] [Google Scholar]
- Kumar, H. S. , Parvathi, A. , Karunasagar, I. , & Karunasagar, I. (2005). Prevalence and antibiotic resistance of Escherichia coli in tropical seafood. World Journal of Microbiology & Biotechnology, 21, 619–623. [Google Scholar]
- Mengistu, A. A. , Aragaw, C. , Mengist, M. , & Goshu, G. (2017). The fish and the fisheries of Lake tana. In Stave K., Yemer G. G. & Ayenalem S. (Eds.), Social and ecological system dynamics (pp. 157–177). Springer. [Google Scholar]
- Mohammad, M. , Obaidat, A. E. , Salman, B. , & Shawkat, Q. L. (2015). Prevalence of Staphylococcus aureus in imported fish and correlations between antibiotic resistance and Enterotoxigenicity. Journal of Food Protection, 78(11), 1999–2005. [DOI] [PubMed] [Google Scholar]
- Mooijman, K. A. , Pielaat, A. , & Kuijpers, A. F. (2019). Validation of EN ISO 6579‐1 ‐ microbiology of the food chain ‐ horizontal method for the detection, enumeration and serotyping of Salmonella ‐ part 1 detection of Salmonella spp. International Journal of Food Microbiology, 288, 3–12. [DOI] [PubMed] [Google Scholar]
- Murugadas, V. , Toms, C. , Joseph, K. , Reshmi, K. , & Lalitha, K. V. (2016). Prevalence of methicillin resistant Staphylococcus aureus in selected seafood markets and aquaculture farms in Kerala, south‐west coast of India. Indian Journal of Fisheries, 63(4), 150–153. [Google Scholar]
- Oh, S. K. , Lee, N. , Cho, Y. S. , Shin, D. B. , Choi, S. Y. , & Koo, M. (2007). Occurance of toxigenic Staphylococus aureus in ready‐ to‐eat food in korea. Journal of Food Protection, 70(5), 1153–1158. [DOI] [PubMed] [Google Scholar]
- Ohalete, C. N. , Obiajuru, I. O. C. , Obiukwu, C. E. , Uwaezuoke, J. C. , Nwaehiri, U. L. , & Daniel, U. N. (2013). Microbiological quality of fried and smoked fish in Owerri, Imo state Nigeria. WJPPS, 2, 1–19. [Google Scholar]
- Okonko, I. O. , Donbraye, E. , & Babatunde, S. O. (2009). Microbiological quality of seafood processors and water used in two different sea processing plants in Nigeria. EJEAF che, 8(8), 621–629. [Google Scholar]
- Omenwa, V. C. , Ansa, E. J. , Agokei, O. E. , Uka, A. , & George, O. S. (2012). Microbiological quality of raw and processed farm‐reared periwinkles from brackish water earthen pond Buguma, Nigeria. African Journal of Food Agriculture Nutrition and Development, 11, 4623–4631. [Google Scholar]
- Penakalapati, G. , Swarthout, J. , Miranda, J. , Delahoy, M. A. L. , Wodnik, B. , Levy, K. , & Freeman, M. C. (2017). Exposure to animal feces and human health: A systematic review and proposed research priorities. Environmental Science & Technology, 51, 11537–11552. [DOI] [PMC free article] [PubMed] [Google Scholar]
- Raufu, I. A. , Lawan, F. A. , Bello, H. S. , Musa, A. S. , Ameh, J. H. , & Ambali, A. G. (2014). Occurrence and antimicrobial susceptibility profiles of Salmonella serovars from fish in Maiduguri, sub‐Saharah, Nigeia. The Egyptian Journal of Aquatic Research, 40, 59–63. [Google Scholar]
- Rimm, E. B. , Appel, L. J. , Chiuve, S. E. , Djoussé, L. , Engler, M. B. , Kris‐Etherton, P. M. , Mozaffarian, D. , Siscovick, D. S. , & Lichtenstein, A. H. (2018). Seafood long‐chain n‐3 polyunsaturated fatty acids and cardiovascular disease: A science advisory from the American Heart Association. Circulation, 138, 35–47. [DOI] [PMC free article] [PubMed] [Google Scholar]
- Shewit, G. , Abebe, G. , Wassie, A. , Bruneel, S. , & Goethals, P. A. (2018). Drivers‐pressure‐state‐impact‐responses framework to support the sustainability of fish and fisheries in Lake tana, Ethiopia. Sustainability, 10, 2957. 10.3390/su10082957 [DOI] [Google Scholar]
- Sichewo, P. R. , Gono, K. , Muzvondiwa, J. V. , & Sizanobuhle, N. (2014). Isolation and identification of pathogenic bacteria in edible fish: A case study of fletcher dam in Gweru, Zimbabwe. International Journal of Science and Research, India, 2(9), 269–272. [Google Scholar]
- Stave, K. , Yemer, G. G. , & Aynalem, S. (2017). Social and ecological system dynamics, characteristics trends, and integration in Lake Tana basin, Ethiopia (pp. 9–23). Springer International Publishing Switzerland. 10.1007/978-3-319-45755-0_2 [DOI] [Google Scholar]
- Thailambal, A. S. (2006). Effect of processing on bacterial population of cuttle fish and crab and determination of bacterial spoilage and rancidity developing on frozen storage. Journal of Food Processing and preservation, 31(1), 13–31. [Google Scholar]
- Tran, N. , Chu, L. , Chan, C. Y. , Genschick, S. , Phillipns, M. , & Kefi, A. S. (2019). Fish supply and demand for food & nutrition security in sub‐saharan Africa: An analysis of the Zambian fish sector. Marine Policy, 99, 343–350. [Google Scholar]
- Trofa, A. F. , Ueno‐Olsen, H. , Oiwa, R. , & Yoshikawa, M. (2009). Dr. Kiyoshi Shiga: Discoverer of the dysentery bacillus. Clinical Infectious Diseases, 29(5), 1303–1306. [DOI] [PubMed] [Google Scholar]
- Wendwesen, T. , Dagmar, N. , Yitbarek, G. , & Matusala, M. (2017). Microbiological quality of frozen raw and undercooked Nile tilapia (Oreochromis niloticus) fillets and food safety practices of fish handlers in Arba Minch town, SNNPR, Ethiopia. Journal of Veterinary Medicine and Animal Health, 9(3), 55–62. [Google Scholar]
- WHO . (2007). Food safety issues associated with products from aquaculture.T.R.S.No.883. World Health Organization. [PubMed] [Google Scholar]
- WHO . (2015). Food safety (pp. 1–15). World Health Organization. [Google Scholar]
- Zenebe, T. , Ahlgren, G. , Gustafsson, I. B. , & Boberg, M. (2006). Fatty acid and lipid content of Oreochromis niloticus L. in Ethiopian lakes‐dietary effects of phytoplankton. Ecology of Freshwater Fish, 7(3), 146–158. [Google Scholar]
- Zhang, J. , Yang, X. , Kuang, D. , Shi, X. , Xiao, W. , Zhang, J. , Gu, Z. , Xu, X. , & Meng, J. (2015). Prevalence of antimicrobial resistance of non‐typhoidal Salmonella serovars in retail aquaculture products. International Journal of Food Microbiology, 210, 47–52. [DOI] [PubMed] [Google Scholar]
Associated Data
This section collects any data citations, data availability statements, or supplementary materials included in this article.
Data Availability Statement
All data and materials are available upon reasonable request from the corresponding author.