

Abstract
Rationale & Objective
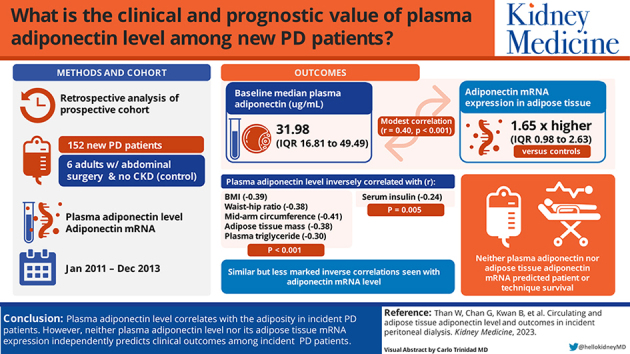
Cardiovascular disease is the major cause of mortality and morbidity in peritoneal dialysis (PD) patients. Adiponectin, a key adipokine, is related to obesity and insulin resistance. We determined the clinical and prognostic value of plasma adiponectin level and its adipose tissue messenger RNA (mRNA) expression in new PD patients.
Study Design
Retrospective analysis of a prospective observational study.
Setting & Participants
152 new PD patients from a single center; 6 adults undergoing abdominal surgeries without kidney disease served as controls.
Predictors
Plasma adiponectin level and its adipose tissue mRNA expression.
Outcomes
Body build and composition, patient and technique survival.
Analytical Approach
Adiponectin level and mRNA expression were grouped in quartiles for correlation analysis for body build and Cox regression for survival analysis.
Results
The median plasma adiponectin level was 31.98 μg/mL (IQR, 16.81-49.49 μg/mL), and adiponectin mRNA expression in adipose tissue was 1.65 times higher than in controls (IQR, 0.98-2.63). There was a modest but statistically significant correlation between plasma adiponectin and its adipose tissue mRNA expression (r = 0.40, P < 0.001). Plasma adiponectin level inversely correlated with body mass index, waist-hip ratio, mid-arm circumference, adipose tissue mass, plasma triglyceride (r = -0.39, -0.38, -0.41, -0.38, and -0.30, respectively; P < 0.001 for all), as well as serum insulin level (r = -0.24, P = 0.005). Similar correlations were present but less marked with adipose tissue adiponectin mRNA level. Neither plasma adiponectin level nor adipose tissue adiponectin mRNA level predicted patient or technique survival.
Limitations
Observational study, single center, single baseline measurement.
Conclusions
Plasma adiponectin level correlated with the degree of adiposity in new PD patients. However, neither plasma adiponectin level nor its adipose tissue mRNA expression was an independent prognostic indicator in kidney failure patients newly started on PD.
Index Words: Adiponectin, adipose, outcome, peritoneal dialysis, plasma
Graphical abstract
Plain-Language Summary.
Cardiovascular disease (CVD) is the major cause of mortality and morbidity in peritoneal dialysis (PD) patients. Non-traditional risk factors play an important role in the pathogenesis of CVD in PD patients. Adiponectin, a key adipokine, is related to obesity and insulin resistance and may be an important non-traditional CVD risk factor in PD. We explored the prognostic roles of plasma adiponectin level and its messenger RNA (mRNA) expression in adipose tissue in incident PD patients. We found that plasma adiponectin level, and to a lesser extent its adipose tissue mRNA expression, correlated with the degree of adiposity in incident PD patients. However, neither plasma adiponectin level nor its adipose tissue mRNA expression was an independent predictor of patient or technique survival.
Peritoneal dialysis (PD) is a life-saving home-based kidney replacement therapy.1,2 In the era of the coronavirus disease 2019 pandemic, PD has the distinct advantages of allowing home-based self-care, having simple equipment, and minimizing staff costs.3,4 With the advances in dialysis technology and reduction in peritonitis rate, cardiovascular disease (CVD) has become the major cause of mortality and morbidity in PD patients.5 In addition to the high prevalence of traditional cardiovascular risk factors in PD patients, the role of obesity as a non-traditional CVD risk factor has been increasingly recognized.
Obesity is common in the general population6,7 as well as kidney failure patients newly started on PD,8 and weight gain is common in prevalent PD patients.9 There is a wealth of literature to support that obesity is a risk factor of mortality and technique failure in PD.10,11 Obesity may adversely affect the outcome of PD patients because of inadequate dialysis dosage12 or new-onset diabetes.8 In addition, the relation between obesity and the outcome of dialysis patients further shed light on the pathogenic process of CVD. In the past decade, it was increasingly recognized that adipose tissue is not an inert store of lipids, but an active endocrine and metabolic organ that contributes to the systemic inflammatory state by producing various adipokines with distant effects.13,14
Adiponectin is the major adipokine that is involved in regulating glucose levels and fatty acid breakdown15 and has been explored as a potential clinical biomarker. For example, plasma adiponectin level correlated inversely with insulin resistance and serum triglyceride level in non-diabetic patients16 but positively with insulin sensitivity and high-density lipoprotein cholesterol levels, and it was a powerful risk marker of incident prediabetes in patients with parental history of diabetes.17 In chronic kidney disease patients, plasma adiponectin level was an independent predictor of cardiovascular mortality.18 However, the prognostic role of adiponectin in the PD population has not been specifically studied. Furthermore, most of the previous studies examined the circulating adiponectin level, which represents both the adiponectin secretion capacity of each adipocyte in combination with the total body adipose tissue mass. Because PD is typically associated with extra glucose load, truncal obesity, and visceral adiposity, the local paracrine effect of adiponectin may be better represented by the adipose messenger RNA (mRNA) expression rather than its circulating level. In the present study, we explored the different prognostic roles of plasma adiponectin level and adipose tissue adiponectin mRNA expression level.
Methods
Overall Design
We performed a retrospective analysis of a prospective observational study. The original prospective cohort study recruited 167 consecutive incident PD patients in our center from January 2011 to December 2013; it aimed to examine the correlation between adipokines and CVD and was approved by the Joint Chinese University of Hong Kong – New Territories East Cluster Clinical Research Ethics Committee (Reference Number CREC-2008.554). In the study, we excluded 15 patients from the original cohort because of insufficient samples for adiponectin measurement, and 152 patients were studied. All study procedures were in compliance with the Declaration of Helsinki.
After obtaining written informed consent, 1-2 g of subcutaneous and pre-peritoneal adipose tissue samples were obtained during mini-laparotomy for PD catheter insertion. Plasma adiponectin level was measured at the same time. The subcutaneous and pre-peritoneal adipose tissues of 6 patients without kidney disease but who required abdominal surgery were used as controls. All adipose tissue specimens were processed immediately and stored at -80°C. Four weeks after the patients were stabilized on PD, we performed routine biochemical tests, peritoneal equilibration test, arterial pulse wave velocity study, anthropometric measurement and multi-frequency bioimpedance study for body build, dialysis adequacy, and nutritional assessment. Charlson’s comorbidity index was computed as previously described.19 Plasma and PD effluent specimens were also collected at this time for other biochemical analyses.
Adipose Tissue Adiponectin mRNA Expression
Total RNA was extracted from the adipose tissue specimen with the miRNeasy Mini Kit (Qiagen). Reverse transcription was performed with the Invitrogen Complementary DNA Synthesis Kit and SuperScript IV VILO Master Mix (both from ThermoFisher Scientific) according to the manufacturers’ instructions. Adiponectin mRNA expression in the adipose tissue was measured by real-time quantitative polymerase chain reaction using the Applied Biosystems Step One Plus system. Commercially available TaqMan primers and probes, including 2 unlabeled polymerase chain reaction primers and 1 fluorescein amidite dye-labeled TaqMan minor groove label probe, were used (all from Applied Biosystems). Phosphoglycerate kinase-1 was used as the housekeeping gene because of its stable expression in human adipose tissue.20 The expression of adiponectin mRNA was compared to that of the adipose tissue from 6 individuals with no kidney disease. All samples were performed in triplicate. The results were analyzed with the Sequence Detection Software v2.0 (Applied Biosystems). The ΔΔCT method for relative quantitation was used.21
Plasma Adiponectin Levels
Plasma adiponectin level was measured by a commercially available enzyme-linked immunosorbent assay kit (Adiponectin Human Enzyme-Linked Immunosorbent Assay Kit, Invitrogen), following the manufacturer’s instructions. All assays were performed in duplicate. The detection limit of adiponectin was 0.012 ng/mL; the inter-assay coefficient of variation was 3.1%.
Study of Peritoneal Transport
The standard peritoneal permeability test was performed by the method of Twardowski and has been described previously.22 In this study, dialysate-to-plasma ratios of creatinine at 4 hours were calculated after correction for glucose interference. Mass transfer area coefficients of creatinine normalized for body surface area were calculated using a standard formula.23 Body surface area was determined using the formula of Gehan and George.24
Anthropometric Measurements
Four weeks after the patients were stable on PD, we performed standard anthropometric measurements and recorded their body weight, body mass index (BMI), waist circumference, hip circumference, mid-arm circumference, and triceps and subscapular skinfold thickness. BMI was computed by the conventional formula and categorized according to the Asia Pacific version of the World Health Organization classification,25,26 ie, BMI <18 kg/m2 for underweight; between 18 and 22.9 for normal weight; between 23 and 24.9 for marginal overweight; between 25 and 29.9 for overweight; and >30 for obesity. The method of anthropometric measurement has been described previously.27 In essence, waist circumference was defined as the measurement taken around the abdomen at the level of the iliac crest at the end of a normal expiration; hip circumference was defined as the measurement taken around the abdomen at the level of maximum posterior extension of the buttocks. The waist-hip ratio was computed accordingly. Mid-arm circumference was defined as the circumference of the arm at the midpoint between shoulder and elbow. Triceps skinfold thickness was measured on the right arm halfway between the olecranon process of the elbow and the acromial process of the scapula; subscapular skinfold thickness was measured 2 cm below the inferior angle of the scapular.
Dialysis Adequacy and Nutritional Status
The method of dialysis adequacy assessment has been described previously.28 In essence, 24-hour urine and dialysate collection was performed for the calculation of the total Kt/V. Residual kidney function was represented by the residual glomerular filtration rate (GFR), which was calculated as the average of 24-hour urinary urea and creatinine clearances.29 Nutritional status was represented by serum albumin level, subjective global assessment score, comprehensive malnutrition-inflammation score, normalized protein nitrogen appearance, and fat-free edema-free body mass. For subjective global assessment, the 4-item 7-point scoring system validated in PD patients was used.30 The calculation of malnutrition-inflammation score included 10 items, each scored from 0 to 3, with a total score of 30.31 Normalized protein nitrogen appearance was calculated by the modified Bergstrom’s formula.32 Fat-free edema-free body mass was determined by the creatinine kinetic method according to the formula described by Forbes and Brunining33 and presented as the percentage of ideal body weight.
Multi-frequency Bioimpedance Spectroscopy Study
We used the multi-frequency device (Body Composition Monitor, Fresenius Medical Care) as described previously.34,35 In this study, we analyzed the data on lean tissue mass, adipose tissue mass, the volume of over-hydration, and extracellular-to-intracellular volume ratio.
Arterial Pulse Wave Velocity Study
Arterial pulse wave velocity was measured with an automatic computerized recorder and analyzed using the Complior @ SP program (Artech Medical) by the method described previously.36 In the present report, we computed the carotid-radial and carotid-femoral pulse wave velocity.
Clinical Outcome
After the initial assessment, all patients were followed for up to 5 years. During the follow-up period, the clinical management was decided by an individual clinician and not affected by the study. The primary outcomes were patient survival and technique survival. For patient survival, recovery of kidney function, loss to follow-up, and transfer to other dialysis centers were censored, while conversion to long-term hemodialysis and kidney transplant were taken as competing events. For the analysis of technique survival, patient death and kidney transplant were taken as competing events, while recovery of kidney function, loss to follow-up, and transfer to other dialysis centers were censored. Secondary outcome measures of this study included peritonitis rate, number of hospital admissions, duration of hospital stay, and the rate of residual kidney function decline.
Statistical Analysis
Statistical analysis was performed using SPSS for Windows software version 25.0 (IBM). The normality of data distribution was checked with the Shapiro-Wilk Test. Summary statistics were described as frequency (%) for categorical variables and mean ± standard deviation or median (interquartile range [IQR]) for continuous variables as appropriate. Demographic and clinical data were compared among patient quartiles of plasma adiponectin level by analysis of variance and χ2 test as appropriate. Correlation between variables was explored using Spearman’s rank correlation coefficient. Because the distributions of plasma adiponectin level and its adipose tissue mRNA expression were both skewed (Fig 1), they were grouped into quartiles for outcome analysis. Survival rates were represented by Kaplan–Meier survival curves and analyzed by the univariate Cox regression between adiponectin level quartiles. The multivariable Cox proportional hazards models were then used to adjust for potential confounders. In addition to the plasma adiponectin level or adipose tissue adiponectin mRNA expression, age, Charlson’s comorbidity score, serum albumin, malnutrition-inflammation score, total weekly Kt/V, residual GFR, baseline BMI, normalized protein nitrogen appearance , and adipose tissue mass were included for the construction of the Cox regression models. These parameters were included because of their reported prognostic role on PD patients or significant difference between plasma adiponectin level quartiles. Backward stepwise analysis was applied to remove insignificant variables. A value of P < 0.05 was considered statistically significant. All probabilities were 2-tailed.
Figure 1.

Distribution histogram of (A) plasma adiponectin level, and (B) adipose adiponectin mRNA expression. Abbreviation: mRNA, messenger RNA.
Results
We evaluated 152 new PD patients. Their average age was 58.38 ± 11.67 years; 102 patients (67.1%) were men, and 92 (60.5%) had diabetes. The baseline median plasma level of adiponectin was 31.98 μg/mL (IQR, 16.81-49.49 μg/mL), and adipose tissue mRNA expression were 1.65 fold of control (IQR, 0.98-2.63 fold). There was a modest but statistically significant correlation between plasma adiponectin level and adipose tissue adiponectin mRNA expression (r = 0.40, P < 0.001), and the correlation was only marginally better when plasma adiponectin level was adjusted by the adipose tissue mass (r = 0.40, P < 0.001). The baseline demographic, clinical, and biochemical characteristics of the patients are grouped by the plasma adiponectin level quartile and summarized in Table 1 and Table 2, respectively.
Table 1.
Baseline Demographic and Clinical Characteristics According to Plasma Adiponectin Level Quartile
| Plasma Adiponectin Quartile | Overall | I | II | III | IV | P |
|---|---|---|---|---|---|---|
| No. of patients | 152 | 38 | 38 | 38 | 38 | |
| Adiponectin | ||||||
| Plasma level (μg/mL) | 38.45 ± 28.44 | 11.0 ± 3.2 | 23.8 ± 4.7 | 39.4 ± 5.4 | 76.6 ± 27.3 | <0.001 |
| Adipose mRNA (folds to control) | 1.81 ± 1.11 | 1.4 ± 0.7 | 1.4 ± 0.9 | 2.0 ± 1.0 | 2.5 ± 1.4 | <0.001 |
| Age (y) | 58.38 ± 11.67 | 59.0 ± 10.3 | 56.4 ± 14.1 | 58.4 ± 10.1 | 59.9 ± 11.7 | 0.62 |
| Sex, no. of patients (%) | 0.002 | |||||
| Male | 102 (67.1%) | 28 (73.7%) | 21 (55.3%) | 26 (68.4%) | 27 (71.1%) | |
| Female | 50 (32.9%) | 10 (26.3%) | 17 (44.7%) | 12 (31.6%) | 11 (28.9%) | |
| Body weight (kg) | 66.7 ± 14.3 | 73.3 ± 13.1 | 68.4 ± 16.8 | 64.1 ± 13.0 | 60.7 ± 10.7 | 0.001 |
| Body mass index (kg/m2) | 24.8 ± 4.12 | 26.7 ± 3.5 | 26.1 ± 5.2 | 23.8 ± 3.5 | 22.8 ± 3.1 | <0.001 |
| Blood pressure (mm Hg) | ||||||
| Systolic | 140.3 ± 18.7 | 138.2 ± 22.8 | 137.3 ± 17.7 | 143.8 ± 16.5 | 141.5 ± 17.4 | 0.42 |
| Diastolic | 75.9 ± 12.8 | 73.8 ± 13.0 | 76.0 ± 10.7 | 75.6 ± 11.4 | 78.2 ± 15.9 | 0.57 |
| Primary kidney disease, no. of cases (%) | 0.41 | |||||
| Diabetes mellitus | 76 (50.0%) | 19 (50.0%) | 22 (57.9%) | 21 (55.3%) | 14 (36.8%) | |
| Hypertension | 14 (9.2%) | 4 (10.5%) | 2 (5.3%) | 6 (15.8%) | 2 (5.3%) | |
| Glomerulonephritis | 31 (20.4%) | 9 (23.7%) | 8 (21.1%) | 5 (13.2%) | 9 (23.7%) | |
| Polycystic kidney disease | 3 (2.0%) | 0 | 1 (2.6%) | 0 | 2 (5.3%) | |
| Urological | 6 (3.9%) | 0 | 1 (2.6%) | 3 (7.9%) | 2 (5.3%) | |
| Others | 2 (1.3%) | 0 | 0 | 1 (2.6%) | 1 (2.6%) | |
| Unknown | 20 (13.2%) | 6 (15.8%) | 4 (10.5%) | 2 (5.3%) | 8 (21.1%) | |
| Comorbid conditions, no. of cases (%) | ||||||
| Diabetes mellitus | 92 (60.5%) | 28 (73.7%) | 23 (60.5%) | 21 (55.3%) | 20 (52.6%) | 0.26 |
| Ischemic heart disease | 40 (26.3%) | 13 (35.1%) | 12 (31.6%) | 7 (18.4%) | 8 (21.1%) | 0.30 |
| Cerebrovascular accident | 28 (18.4%) | 8 (21.6%) | 8 (21.1%) | 7 (18.4%) | 5 (13.2%) | 0.83 |
| Peripheral vascular disease | 12 (7.9%) | 3 (8.1%) | 5 (13.2%) | 0 | 4 (10.5%) | 0.09 |
| Charlson’s comorbidity score | 6.2 ± 2.5 | 6.7 ± 2.5 | 6.3 ± 2.8 | 5.6 ± 2.5 | 6.1 ± 2.3 | 0.30 |
| Anthropometry | ||||||
| Waist circumference (cm) | 88.8 ± 11.6 | 94.6 ± 9.9 | 90.1 ± 13.3 | 86.8 ± 10.3 | 84.1 ± 10.2 | 0.001 |
| Hip circumference (cm) | 95.6 ± 9.1 | 98.7 ± 6.7 | 96.6 ± 12.7 | 94.1 ± 7.7 | 93.1 ± 7.2 | 0.05 |
| Waist-hip ratio | 0.93 ± 0.07 | 0.96 ± 0.07 | 0.93 ± 0.08 | 0.92 ± 0.06 | 0.90 ± 0.06 | 0.005 |
| Mid-arm circumference (cm) | 25.9 ± 3.0 | 27.6 ± 2.2 | 26.4 ± 3.7 | 25.1 ± 2.8 | 24.4 ± 2.3 | <0.001 |
| Triceps skin fold (cm) | 9.8 ± 3.7 | 10.5 ± 3.9 | 11.5 ± 3.6 | 9.0 ± 3.2 | 8.3 ± 3.5 | 0.001 |
| Subscapular skin fold (cm) | 11.5 ± 4.8 | 11.6 ± 5.3 | 11.3 ± 4.6 | 11.7 ± 4.9 | 11.2 ± 4.6 | 0.96 |
| Other nutritional indices | ||||||
| Subjective global assessment | 5.3 ± 0.9 | 5.3 ± 0.8 | 5.5 ± 0.6 | 5.0 ± 1.0 | 5.6 ± 1.0 | 0.15 |
| Malnutrition-inflammation score | 6.7 ± 3.6 | 6.5 ± 3.9 | 6.6 ± 3.9 | 7.1 ± 3.4 | 6.2 ± 3.5 | 0.91 |
Abbreviation: mRNA, messenger RNA.
Table 2.
Baseline Nutrition and Biochemical Parameters According to Plasma Adiponectin Level Quartile
| Plasma Adiponectin Quartile | Overall | I | II | III | IV | P |
|---|---|---|---|---|---|---|
| No. of patients | 152 | 38 | 38 | 38 | 38 | |
| Baseline blood result | ||||||
| Hemoglobin (g/dL) | 8.94 ± 1.20 | 9.02 ± 1.57 | 9.12 ± 1.05 | 8.75 ± 1.20 | 8.89 ± .92 | 0.59 |
| Albumin (g/L) | 35.28 ± 4.42 | 36.53 ± 4.07 | 37.10 ± 2.97 | 34.01 ± 5.28 | 33.54 ± 4.03 | <0.001 |
| Total cholesterol (mmol/L) | 4.53 ± 1.21 | 4.19 ± 1.24 | 4.61 ± 1.13 | 4.56 ± .97 | 4.75 ± 1.47 | 0.27 |
| Triglyceride (mmol/L) | 1.52 ± 0.86 | 1.67 ± .89 | 1.85 ± 1.11 | 1.44 ± .66 | 1.13 ± 0.56 | 0.003 |
| LDL cholesterol (mmol/L) | 2.59 ± 1.04 | 2.37 ± 1.03 | 2.65 ± .89 | 2.63 ± .82 | 2.70 ± 1.37 | 0.57 |
| HDL cholesterol (mmol/L) | 1.26 ± 0.39 | 1.06 ± 0.30 | 1.12 ± .34 | 1.28 ± .31 | 1.56 ± 0.41 | <0.001 |
| Total Kt/V | 2.05 ± 0.63 | 2.04 ± 0.65 | 2.28 ± 0.76 | 2.00 ± 0.50 | 1.87 ± 0.54 | 0.07 |
| Residual GFR (mL/min/1.73 m2) | 3.96 ± 2.67 | 4.95 ± 2.64 | 4.34 ± 2.96 | 3.47 ± 2.53 | 3.01 ± 2.10 | 0.02 |
| Peritoneal transport characteristics | ||||||
| D/P4 | 0.69 ± 0.12 | 0.66 ± 0.10 | 0.71 ± 0.13 | 0.69 ± 0.11 | 0.70 ± 0.14 | 0.26 |
| MTAC (mL/min/1.73 m2) | 10.91 ± 5.04 | 8.63 ± 2.66 | 12.35 ± 6.29 | 10.87 ± 4.99 | 11.86 ± 4.86 | 0.01 |
| NPNA (g/kg/day) | 1.13 ± 0.24 | 1.20 ± 0.23 | 1.20 ± 0.28 | 1.06 ± 0.20 | 1.05 ± 0.22 | 0.01 |
| FEBM (%) | 40.48 ± 13.05 | 36.73 ± 10.67 | 41.90 ± 16.43 | 39.34 ± 9.32 | 44.39 ± 14.23 | 0.12 |
| Bioimpedance spectroscopy | ||||||
| Over-hydration (L) | 4.53 ± 3.25 | 4.10 ± 2.89 | 4.22 ± 3.14 | 4.63 ± 4.12 | 5.19 ± 2.53 | 0.52 |
| E:I ratio | 1.01 ± 0.17 | 1.00 ± 0.18 | 1.02 ± 0.18 | 1.00 ± 0.19 | 1.04 ± 0.15 | 0.81 |
| Lean tissue mass (kg) | 41.41 ± 10.98 | 43.67 ± 8.98 | 40.86 ± 13.81 | 40.89 ± 11.29 | 40.32 ± 8.89 | 0.6 |
| Adipose tissue mass (kg) | 20.04 ± 11.13 | 25.00 ± 11.20 | 23.04 ± 13.23 | 17.47 ± 8.74 | 14.34 ± 7.26 | <0.001 |
| Pulse wave velocity (cm/s) | ||||||
| Carotid-radial | 10.51 ± 1.35 | 10.27 ± 1.22 | 10.62 ± 1.60 | 10.62 ± 1.16 | 10.49 ± 1.42 | 0.69 |
| Carotids-femoral | 11.44 ± 2.35 | 10.88 ± 1.93 | 11.49 ± 2.57 | 11.57 ± 2.15 | 11.76 ± 2.69 | 0.49 |
Abbreviations: D/P4, dialysate-to-plasma creatinine concentration at 4 h; E:I ratio, extracellular-to-intracellular volume ratio; FEBM, fat-free edema-free lean body mass; GFR, glomerular filtration rateHDL, high-density lipoprotein; LDL, low-density lipoprotein; MTAC, mass transfer areas coefficient of creatinine; NPNA, normalized protein nitrogen appearance.
Relation with Clinical Parameters
There were modest but statistically significant correlations between plasma and adipose tissue adiponectin levels and adipose tissue mass, body anthropometric parameters, and serum lipid profile (Table 3). Plasma adiponectin level, and to a lesser extent adipose tissue adiponectin mRNA level, inversely correlated with measures of adiposity, including adipose tissue mass by bioimpedance spectroscopy, BMI, waist and hip circumferences, triceps skinfold thickness, and plasma triglyceride level (Table 3). Plasma adiponectin level, but not its adipose tissue mRNA expression, had a modest but statistically significant correlation with serum albumin level, residual GFR, normalized protein nitrogen appearance, and mass transfer area coefficients. Among patients with diabetes, adipose tissue adiponectin expression, but not plasma adiponectin level, had a modest but significant correlation with hemoglobin A1C level (r = -0.21, P = 0.01). Both plasma adiponectin level (r = -0.24, P = 0.005) and adipose tissue adiponectin mRNA expression (r = -0.18, P = 0.03) had modest inverse correlations with baseline serum insulin level.
Table 3.
Correlation between adiponectin levels and nutritional and biochemical indices
| Variable | Adiponectin |
|
|---|---|---|
| Plasma Level | Adipose Tissue mRNA | |
| Blood pressure | ||
| Systolic | r = 0.07 (-0.10 to 0.24), P = 0.39 | r = -0.10 (-0.26 to 0.07), P = 0.25 |
| Diastolic | r = 0.05 (-0.12 to 0.22), P = 0.54 | r = 0.04 (-0.13 to 0.21), P = 0.6 |
| Charlson’s score | r = -0.17 (-0.33 to -0.00), P = 0.04 | r = -0.17 (-0.33 to 0.00), P = 0.04 |
| Anthropometry | ||
| Body weight | r = -0.35 (-0.49 to -0.19), P < 0.001 | r = -0.14 (-0.30 to 0.03), P = 0.09 |
| BMI | r = -0.39 (-0.53 to -0.24), P < 0.001 | r = -0.30 (-0.44 to -0.14), P < 0.001 |
| Waist circumference | r = -0.33 (-0.47 to -0.17), P < 0.001 | r = -0.17 (-0.33 to -0.00), P = 0.04 |
| Hip circumference | r = -0.22 (-0.38 to -0.06), P = 0.008 | r = -0.12 (-0.29 to 0.05), P = 0.14 |
| Waist-hip ratio | r = -0.38 (-0.52 to -0.22), P < 0.001 | r = -0.08 (-0.25 to 0.09), P = 0.32 |
| mid-arm circumference | r = -0.41 (-0.54 to -0.25), P < 0.001 | r = -0.19 (-0.35 to -0.02), P = 0.03 |
| Triceps skinfold | r = -0.27 (-0.42 to -0.10), P = 0.001 | r = -0.38 (-0.52 to -0.23), P < 0.001 |
| Subscapular skin fold | r = -0.03 (-0.20 to 0.14), P = 0.73 | r = 0.01 (-0.16 to 0.18), P = 0.89 |
| SGA | r = 0.01 (-0.22 to 0.25), P = 0.91 | r = 0.14 (-0.10 to 0.36), P = 0.24 |
| MIS | r = -0.02 (-0.25 to 0.22), P = 0.87 | r = -0.10 (-0.33 to 0.13), P = 0.38 |
| Baseline blood result | ||
| Serum albumin | r = -0.31 (-0.46 to -0.15), P < 0.001 | r = -0.02 (-0.19 to 0.15), P = 0.83 |
| Hemoglobin | r = -0.10 (-0.26 to 0.07), P = 0.25 | r = -0.00 (-0.17 to 0.17), P = 0.99 |
| Total cholesterol | r = 0.19 (0.02-0.35), P = 0.02 | r = 0.04 (-0.13 to 0.20), P = 0.67 |
| Triglycerides | r = -0.30 (-0.45 to -0.14), P < 0.001 | r = -0.37 (-0.51 to -0.22), P < 0.001 |
| LDL cholesterol | r = 0.12 (-0.05 to 0.28), P = 0.16 | r = 0.04 (-0.14 to 0.20), P = 0.68 |
| HDL cholesterol | r = 0.52 (0.38-0.63), P < 0.001 | r = 0.37 (0.22-0.51), P < 0.001 |
| Total Kt/V | r = -0.13 (-0.30 to 0.05), P = 0.14 | r = -0.08 (-0.25 to 0.10), P = 0.38 |
| Residual GFR | r = -0.32 (-0.47 to -0.15), P < 0.001 | r = -0.11 (-0.28 to 0.07), P = 0.22 |
| Peritoneal transport | ||
| D/P4 | r = 0.14 (-0.03 to 0.31), P = 0.1 | r = 0.05 (-0.12 to 0.22), P = 0.56 |
| MTAC | r = 0.21 (0.04-0.37), P = 0.02 | r = 0.09 (-0.09 to 0.26), P = 0.31 |
| NPNA | r = -0.26 (-0.42 to -0.09), P = 0.003 | r = -0.06 (-0.24 to 0.12), P = 0.48 |
| FEBM | r = 0.25 (0.07 to 0.41), P = 0.005 | r = 0.13 (-0.05 to 0.30), P = 0.14 |
| Bioimpedance spectroscopy | ||
| Over-hydration | r = 0.15 (-0.03 to 0.31), P = 0.09 | r = -0.09 (-0.26 to 0.08), P = 0.29 |
| E:I ratio | r = 0.05 (-0.12 to 0.23), P = 0.53 | r = -0.21 (-0.37 to -0.04), P = 0.01 |
| Lean tissue mass | r = -0.08 (-0.25 to 0.10), P = 0.37 | r = 0.11 (-0.07 to 0.27), P = 0.21 |
| Adipose tissue mass | r = -0.38 (-0.52 to -0.22), P < 0.001 | r = -0.29 (-0.44 to -0.12), P < 0.001 |
| Pulse wave velocity | ||
| Carotid-radial | r = 0.01 (-0.16 to 0.18), P = 0.9 | r = -0.07 (-0.24 to 0.11), P = 0.44 |
| Carotid-femoral | r = 0.06 (-0.11 to 0.23), P = 0.49 | r = -0.13 (-0.30 to 0.04), P = 0.12 |
Note: Data are presented as Spearman’s rank correlation coefficient, r (95% confidence interval).
Abbreviations: E:I ratio, extracellular-to-intracellular volume ratio; FEBM, fat-free edema-free body mass; GFR, glomerular filtration rate; HDL, high-density lipoprotein; LDL, low-density lipoprotein; MIS, malnutrition-inflammation score; NPNA, normalized protein nitrogen appearance; SGA, subjective global assessment overall score.
Patient and Technique Survival
During the follow-up period, 90 patients died, 17 patients were switched to long-term hemodialysis, 15 patients had kidney transplantation, and 6 patients were transferred to other centers. The causes of death were ischemic heart diseases (23 patients), cerebrovascular accidents (9 patients), sudden cardiac arrest (5 patients), peritonitis (10 patients), non-peritonitis infection (34 patients), malignancy (3 patients), termination of dialysis (2 patients), and other specific causes (4 patients). The relation between quartiles of plasma adiponectin level and its adipose tissue mRNA expression with patient and technique survival by univariate Cox analysis is summarized in Table 4. In essence, plasma adiponectin level by ELISA was associated with a better patient survival but not technique survival (Fig 2). However, when the effect was adjusted for other clinical confounders by the multivariate Cox regression model, plasma adiponectin level by ELISA was not an independent predictor of patient survival. In this model, only Charlson’s comorbidity score, normalized protein nitrogen appearance, and baseline BMI were independent predictors of patient survival.
Table 4.
Relation Between Plasma Adiponectin or Its Adipose Tissue mRNA Level Quartiles and Clinical Outcome
| Plasma Adiponectin Level |
Adipose Tissue Adiponectin mRNA |
|||||
|---|---|---|---|---|---|---|
| Statistics | 95% CI | P | Statistics | 95% CI | P | |
| Patient survival | HR = 0.94 | 0.77-1.15 | 0.54a | HR = 0.83 | 0.69-0.99 | 0.04a |
| Technique survival | HR = 1.17 | 0.73-1.86 | 0.52a | HR = 0.86 | 0.56-1.30 | 0.47a |
| Number of hospital admission per year | β = 0.02 | -0.08 to 0.13 | 0.44b | β = -0.08 | -0.18 to 0.03 | 0.15b |
| Duration of hospitalization per year | β = -0.08 | -0.18 to 0.03 | 0.15b | β = -0.12 | -0.32 to 0.07 | 0.21b |
| Rate of residual GFR decline | β = 0.47 | 0.06-0.88 | 0.02b | β = -0.01 | -0.41 to 0.40 | 0.97b |
| Time to anuria | HR = 0.88 | 0.70-1.10 | 0.88a | HR = 0.85 | 0.68-1.05 | 0.12a |
| Peritonitis-free survival | HR = 1.13 | 0.93-1.38 | 0.21a | HR = 1.03 | 0.86-1.24 | 0.75a |
Abbreviations: CI, confidence interval; GFR, glomerular filtration rate; HR, hazard ratio; mRNA, messenger RNA.
Data were analyzed by aunivariate Cox regression or bunadjusted log-linear regression.
Figure 2.

Kaplan–Meier plot for (A) patient survival; and (B) technique survival according to plasma adiponectin level quartiles (with quartile IV had the highest levels). Data were compared by log-rank test.
Secondary Outcomes
During the follow-up period, there were 862 hospital admissions for a total of 6082 days. The overall median rate of hospital admission was 1.59 episodes per year (IQR, 0.84-3.27), for a median of 9.53 days per year (IQR, 2.96-21.05). During the same period, 63 patients developed anuria. The median rate of residual GFR decline was -1.22 mL/min/1.73 m2 per year (IQR, -0.53 to -2.22). At the same time, 89 patients developed 188 peritonitis episodes. The overall peritonitis rate was 0.77 episodes per patient-year. The relation between plasma adiponectin level or its adipose tissue mRNA level quartiles and secondary outcomes are summarized in Table 4. In essence, plasma adiponectin level quartile had a significant but modest correlation with the rate of residual GFR decline. There was no significant relation between plasma adiponectin level or its adipose tissue mRNA level quartiles and other secondary outcome parameters. In view of the small number of events, further multivariable analysis was not performed.
Discussion
In this study, we found that plasma adiponectin level, and to a lesser extent adipose tissue adiponectin mRNA level, inversely correlated with the degree of adiposity in patients with kidney failure newly started on PD. Although adipose tissue adiponectin mRNA level has a marginal association with patient survival by univariate analysis, neither adipose tissue adiponectin mRNA level nor its plasma level was an independent predictor of patient or technique survival after multivariate analysis to adjust for clinical confounding factors.
Adiponectin is a major adipokine that is involved in regulating glucose levels and fatty acid breakdown.15 Specifically, adiponectin increases fatty acid transport, β-oxidation, triglyceride clearance, and its dissipation in skeletal muscle, leading to a reduction of intracellular lipid levels and thus improved insulin signaling.37,38 Adiponectin also regulates cellular glucose flux, including both gluconeogenesis and glucose uptake.15,37 In terms of its systemic effects, adiponectin directly improves endothelial dysfunction, at least in rat models,39,40 and contributes to the pathogenesis of chronic kidney disease–mineral bone disease, mostly by downregulation of fibroblast growth factor 23 and kidney’s Klotho expression.41 Increased adipose tissue results in a decrease in the secretion of adiponectin, which is an anti-inflammatory adipokine produced by adipocytes.42 Plasma adiponectin level was associated with insulin resistance and serum triglyceride level in patients without diabetes16 and was a powerful risk marker of incident prediabetes in patients with parental history of diabetes.17
The aim of our study was to determine both plasma adiponectin level and the corresponding mRNA expression in adipose tissue. Although plasma adiponectin level is generally assumed to be more stable and suitable for laboratory quantification, the adipose tissue mRNA expression is probably a better indicator of its local paracrine effect. In this study, we observed that plasma adiponectin level had a modest but significant correlation with body weight, BMI, various anthropometric measurements, and adipose tissue mass as determined by bioimpedance spectroscopy (see Table 3). The result agrees with the prediction from its physiological actions and is consistent with previous studies in the normal population43 as well as PD patients.44,45 More importantly, we observed a similar but less strong correlation between the above parameters and adiponectin mRNA expression in abdominal adipose tissue, indicating that peripheral (rather than abdominal) adipose tissue may be the major source of circulating adiponectin. Our findings on the relation between adiponectin level and baseline insulin level were also consistent with previous studies, which reported that plasma adiponectin level was decreased in obese and insulin-resistant mice and humans.15,46 Similarly, we found a modest correlation between plasma adiponectin level and peritoneal transport characteristic, as represented by the mass transfer area coefficient of creatinine, and the observation is consistent with the recent report of Sumi et al.47 The actual plasma adiponectin levels of our PD patients, however, were substantially higher than that reported in patients with diabetes17 or obese individuals with normal kidney function,16 which seems to be expected because the PD population tends to be less obese than the general population.8 Another strength of our study is that Hong Kong has the well-established “PD first” policy, and there is minimal selection bias for PD. Notably, few individuals were deemed unsuitable for PD because of obesity.
There is a wealth of literature on the relationship between plasma adiponectin level and survival. Although laboratory studies showed beneficial effects of adiponectin on glucose homeostasis, systemic inflammation, apoptosis, and atherosclerosis,48,49 a positive, rather than the expected negative, relationship between plasma adiponectin level and the overall mortality rate was reported in a variety of patient populations.50 The result of published studies on dialysis patients is, however, conflicting. In hemodialysis patients, studies reported that a high plasma adiponectin level was associated with a higher51, 52, 53, 54 as well as lower mortality.55, 56, 57 In the PD population, both Díez et al58 and Tung et al59 noted that plasma adiponectin level was inversely related to patient mortality. Although Park et al60 found that plasma adiponectin level per se was not associated with patient mortality, the leptin-adiponectin ratio is a prognostic indicator. Taken together, our observation that plasma adiponectin level did not have a significant correlation with patient survival is consistent with the available literature.
There are, however, several major limitations of our study. First, there was no previous work to validate our findings on adipose tissue adiponectin mRNA expression, either in the general population or in dialysis patients, and it remains to be determined whether our findings could be extrapolated to other patient populations. Nonetheless, because we took advantage of PD catheter insertion and obtained adipose tissue for adiponectin mRNA expression, similar studies may not be feasible for non–dialysis-dependent chronic kidney disease patients or those on long-term hemodialysis. Second, we only measured baseline plasma adiponectin level, and it remains unknown how long-term PD, either in itself or as a result of weight gain, affects plasma adiponectin level or its mRNA expression in adipose tissue. Theoretically, it is possible to use a pre-specified threshold of adiponectin level from the literature for risk assessment, rather than classifying the patients into quartiles. However, there is no well accepted “normal” adiponectin level. The results of our present study also suggest that the prognostic value of the adiponectin level, if any, is linear across the measured range, without a threshold value. Finally, our study is observational, and the underlying molecular mechanisms were not explored. Notably, the discordance between correlates of adipose tissue adiponectin mRNA expression and its plasma level may shed light on the actual molecular mechanism (ie, paracrine versus distal effects, respectively).
In conclusion, plasma adiponectin level, and to a lesser extent adipose tissue adiponectin mRNA level, inversely correlated with the severity of adiposity. However, neither plasma adiponectin level nor its adipose tissue mRNA expression was an independent prognostic indicator in kidney failure patients newly started on PD.
Article Information
Authors’ Full Names and Academic Degrees
Win Hlaing Than, MBBS, MSc, Gordon Chun-Kau Chan, MBChB, MRCP, Bonnie Ching-Ha Kwan, MBBS, FRCP, Ka-Bik Lai, PhD, Ronald Cheong-Kin Chan, MBBS, Jeromy Yuen Chun Teoh, MBBS, FRCSEd, Jack Kit-Chung Ng, MBChB, MRCP, Winston Wing-Shing Fung, MBChB, MRCP, Kai-Ming Chow, MBChB, FRCP(Edin), Phyllis Mei-Shan Cheng, BN, RN, Man-Ching Law, BN, RN, Philip Kam-Tao Li, MD, FRCP, and Cheuk-Chun Szeto, MD, FRCP
Authors’ Contributions
Research idea and study design: WHT, GCKC, BCHK, CCS; data acquisition: WHT, BCHK, WWSF, KBL, RCKC, JYCT, PMSC, MCL; data analysis/interpretation: WHT, GCKC, JKCN, CCS; statistical analysis: WHT, CCS; supervision or mentorship: BCHK, KMC, PKTL, CCS. KMC was responsible for project administration and supervision. Each author contributed important intellectual content during manuscript drafting or revision and accepts accountability for the overall work by ensuring that questions pertaining to the accuracy or integrity of any portion of the work are appropriately investigated and resolved.
Support
This study was supported by the Hong Kong Society of Nephrology research grant 2021-2022 and the Richard Yu Chinese University of Hong Kong (CUHK) PD Research Fund, and CUHK research accounts 6905134 and 7105912. The funders had no role in study design, data collection and analysis, decision to publish, or preparation of the manuscript.
Financial Disclosure
The authors declare that they have no relevant financial interests.
Peer Review
Received March 22, 2022. Evaluated by 1 external peer reviewer, with direct editorial input from the Statistical Editor and the Editor-in-Chief. Accepted in revised form October 23, 2022.
Footnotes
Complete author and article information provided before references.
References
- 1.Mehrotra R., Devuyst O., Davies S.J., Johnson D.W. The current state of peritoneal dialysis. J Am Soc Nephrol. 2016;27(11):3238–3252. doi: 10.1681/ASN.2016010112. [DOI] [PMC free article] [PubMed] [Google Scholar]
- 2.Ho Y.W., Chau K.F., Choy B.Y., et al. Hong Kong renal registry report 2012. HK J Nephrol. 2013;15(1):28–43. [Google Scholar]
- 3.Cozzolino M., Conte F., Zappulo F., et al. COVID-19 pandemic era: is it time to promote home dialysis and peritoneal dialysis? Clin Kidney J. 2021;14(suppl 1):i6–i13. doi: 10.1093/ckj/sfab023. [DOI] [PMC free article] [PubMed] [Google Scholar]
- 4.Alfano G., Fontana F., Ferrari A., et al. Peritoneal dialysis in the time of coronavirus disease 2019. Clin Kidney J. 2020;13(3):265–268. doi: 10.1093/ckj/sfaa093. [DOI] [PMC free article] [PubMed] [Google Scholar]
- 5.Cozzolino M., Mangano M., Stucchi A., Ciceri P., Conte F., Galassi A. Cardiovascular disease in dialysis patients. Nephrol Dial Transplant. 2018;33(suppl_3):iii28–iii34. doi: 10.1093/ndt/gfy174. [DOI] [PMC free article] [PubMed] [Google Scholar]
- 6.Blüher M. Obesity: global epidemiology and pathogenesis. Nat Rev Endocrinol. 2019;15(5):288–298. doi: 10.1038/s41574-019-0176-8. [DOI] [PubMed] [Google Scholar]
- 7.Chen Y., Peng Q., Yang Y., Zheng S., Wang Y., Lu W. The prevalence and increasing trends of overweight, general obesity, and abdominal obesity among Chinese adults: a repeated cross-sectional study. BMC Public Health. 2019;19(1):1293. doi: 10.1186/s12889-019-7633-0. [DOI] [PMC free article] [PubMed] [Google Scholar]
- 8.Than W.H., Ng J.K., Chan G.C., Fung W.W.S., Chow K.M., Szeto C.C. The change in the prevalence of obesity and new-onset diabetes in Chinese peritoneal dialysis patients over 25 years. Clin Kidney J. 2022;15(1):70–78. doi: 10.1093/ckj/sfab139. [DOI] [PMC free article] [PubMed] [Google Scholar]
- 9.Castro A.C.M., Bazanelli A.P., Nerbass F.B., Cuppari L., Kamimura M.A. Waist circumference as a predictor of mortality in peritoneal dialysis patients: a follow-up study of 48 months. Br J Nutr. 2017;117(9):1299–1303. doi: 10.1017/S0007114517001179. [DOI] [PubMed] [Google Scholar]
- 10.Turgut F., Abdel-Rahman E.M. Challenges associated with managing end-stage renal disease in extremely morbid obese patients: case series and literature review. Nephron. 2017;137(3):172–177. doi: 10.1159/000479118. [DOI] [PubMed] [Google Scholar]
- 11.Diwan T.S., Cuffy M.C., Linares-Cervantes I., Govil A. Impact of obesity on dialysis and transplant and its management. Semin Dial. 2020;33(3):279–285. doi: 10.1111/sdi.12876. [DOI] [PubMed] [Google Scholar]
- 12.Obi Y., Streja E., Mehrotra R., et al. Impact of obesity on modality longevity, residual kidney function, peritonitis, and survival among incident peritoneal dialysis patients. Am J Kidney Dis. 2018;71(6):802–813. doi: 10.1053/j.ajkd.2017.09.010. [DOI] [PMC free article] [PubMed] [Google Scholar]
- 13.Trayhurn P., Beattie J.H. Physiological role of adipose tissue: white adipose tissue as an endocrine and secretory organ. Proc Nutr Soc. 2001;60(3):329–339. doi: 10.1079/pns200194. [DOI] [PubMed] [Google Scholar]
- 14.Kershaw E.E., Flier J.S. Adipose tissue as an endocrine organ. J Clin Endocrinol Metab. 2004;89(6):2548–2556. doi: 10.1210/jc.2004-0395. [DOI] [PubMed] [Google Scholar]
- 15.Zhu Q., Scherer P.E. Immunologic and endocrine functions of adipose tissue: implications for kidney disease. Nat Rev Nephrol. 2018;14(2):105–120. doi: 10.1038/nrneph.2017.157. [DOI] [PubMed] [Google Scholar]
- 16.Katsuki A., Sumida Y., Urakawa H., et al. Plasma levels of adiponectin are associated with insulin resistance and serum levels of triglyceride in Japanese metabolically obese, normal-weight men with normal glucose tolerance. Diabetes Care. 2003;26(10):2964–2965. doi: 10.2337/diacare.26.10.2964. [DOI] [PubMed] [Google Scholar]
- 17.Jiang Y., Owei I., Wan J., Ebenibo S., Dagogo-Jack S. Adiponectin levels predict prediabetes risk: the pathobiology of prediabetes in a biracial cohort (POP-ABC) study. BMJ Open Diabetes Res Care. 2016;4(1) doi: 10.1136/bmjdrc-2016-000194. [DOI] [PMC free article] [PubMed] [Google Scholar]
- 18.Menon V., Li L., Wang X., et al. Adiponectin and mortality in patients with chronic kidney disease. J Am Soc Nephrol. 2006;17(9):2599–2606. doi: 10.1681/ASN.2006040331. [DOI] [PubMed] [Google Scholar]
- 19.Pylväläinen J., Talala K., Murtola T., et al. Charlson Comorbidity Index based on hospital episode statistics performs adequately in predicting mortality, but its discriminative ability diminishes over time. Clin Epidemiol. 2019;11:923–932. doi: 10.2147/CLEP.S218697. [DOI] [PMC free article] [PubMed] [Google Scholar]
- 20.Neville M.J., Collins J.M., Gloyn A.L., McCarthy M.I., Karpe F. Comprehensive human adipose tissue mRNA and microRNA endogenous control selection for quantitative real-time-PCR normalization. Obesity (Silver Spring) 2011;19(4):888–892. doi: 10.1038/oby.2010.257. [DOI] [PMC free article] [PubMed] [Google Scholar]
- 21.Rao X., Huang X., Zhou Z., Lin X. An improvement of the 2ˆ(-delta delta CT) method for quantitative real-time polymerase chain reaction data analysis. Biostat Bioinforma Biomath. 2013;3(3):71–85. [PMC free article] [PubMed] [Google Scholar]
- 22.Szeto C.C., Chow K.M., Lam C.W., et al. Clinical biocompatibility of a neutral peritoneal dialysis solution with minimal glucose-degradation products – a 1-year randomized control trial. Nephrol Dial Transplant. 2007;22(2):552–559. doi: 10.1093/ndt/gfl559. [DOI] [PubMed] [Google Scholar]
- 23.Krediet R.T., Boeschoten E.W., Zuyderhoudt F.M.J., Strackee J., Arisz L. Simple assessment of the efficacy of peritoneal transport in continuous ambulatory peritoneal dialysis patients. Blood Purif. 1986;4(4):194–203. doi: 10.1159/000169445. [DOI] [PubMed] [Google Scholar]
- 24.Noe D.A. A body surface area nomogram based on the formula of Gehan and George. J Pharm Sci. 1991;80(5):501. doi: 10.1002/jps.2600800520. [DOI] [PubMed] [Google Scholar]
- 25.Lim J.U., Lee J.H., Kim J.S., et al. Comparison of World Health Organization and Asia-Pacific body mass index classifications in COPD patients. Int J Chron Obstruct Pulmon Dis. 2017;12:2465–2475. doi: 10.2147/COPD.S141295. [DOI] [PMC free article] [PubMed] [Google Scholar]
- 26.WHO Expert Consultation Appropriate body-mass index for Asian populations and its implications for policy and intervention strategies. Lancet. 2004;363(9403):157–163. doi: 10.1016/S0140-6736(03)15268-3. [DOI] [PubMed] [Google Scholar]
- 27.Szeto C.C., Kong J., Wu A.K., Wong T.Y., Wang A.Y., Li P.K. The role of lean body mass as a nutritional index in Chinese peritoneal dialysis patients--comparison of creatinine kinetics method and anthropometric method. Perit Dial Int. 2000;20(6):708–714. [PubMed] [Google Scholar]
- 28.Szeto C.C., Wong T.Y., Chow K.M., Leung C.B., Li P.K. Oral sodium bicarbonate for the treatment of metabolic acidosis in peritoneal dialysis patients: a randomized placebo-control trial. J Am Soc Nephrol. 2003;14(8):2119–2126. doi: 10.1097/01.asn.0000080316.37254.7a. [DOI] [PubMed] [Google Scholar]
- 29.Van Olden R.W., Krediet R.T., Struijk D.G., Arisz L. Measurement of residual renal function in patients treated with continuous ambulatory peritoneal dialysis. J Am Soc Nephrol. 1996;7(5):745–750. doi: 10.1681/ASN.V75745. [DOI] [PubMed] [Google Scholar]
- 30.Enia G., Sicuso C., Alati G., Zoccali C. Subjective global assessment of nutrition in dialysis patients. Nephrol Dial Transplant. 1993;8(10):1094–1098. [PubMed] [Google Scholar]
- 31.Kalantar-Zadeh K., Kopple J.D., Block G., Humphreys M.H. A malnutrition-inflammation score is correlated with morbidity and mortality in maintenance hemodialysis patients. Am J Kidney Dis. 2001;38(6):1251–1263. doi: 10.1053/ajkd.2001.29222. [DOI] [PubMed] [Google Scholar]
- 32.Bergström J., Heimbürger O., Lindholm B. Calculation of the protein equivalent of total nitrogen appearance from urea appearance. Which formulas should be used? Perit Dial Int. 1998;18(5):467–473. [PubMed] [Google Scholar]
- 33.Forbes G.B., Bruining G.J. Urinary creatinine excretion and lean body mass. Am J Clin Nutr. 1976;29(12):1359–1366. doi: 10.1093/ajcn/29.12.1359. [DOI] [PubMed] [Google Scholar]
- 34.Kwan B.C., Szeto C.C., Chow K.M., et al. Bioimpedance spectroscopy for the detection of fluid overload in Chinese peritoneal dialysis patients. Perit Dial Int. 2014;34(4):409–416. doi: 10.3747/pdi.2013.00066. [DOI] [PMC free article] [PubMed] [Google Scholar]
- 35.Ng J.K., Kwan B.C., Chow K.M., et al. Asymptomatic fluid overload predicts survival and cardiovascular event in incident Chinese peritoneal dialysis patients. PLOS ONE. 2018;13(8) doi: 10.1371/journal.pone.0202203. [DOI] [PMC free article] [PubMed] [Google Scholar]
- 36.Szeto C.C., Kwan B.C., Chow K.M., Leung C.B., Law M.C., Li P.K. Prognostic value of arterial pulse wave velocity in peritoneal dialysis patients. Am J Nephrol. 2012;35(2):127–133. doi: 10.1159/000335580. [DOI] [PubMed] [Google Scholar]
- 37.Yamauchi T., Kamon J., Minokoshi Y., et al. Adiponectin stimulates glucose utilization and fatty-acid oxidation by activating AMP-activated protein kinase. Nat Med. 2002;8(11):1288–1295. doi: 10.1038/nm788. [DOI] [PubMed] [Google Scholar]
- 38.Stern J.H., Rutkowski J.M., Scherer P.E. Adiponectin, leptin, and fatty acids in the maintenance of metabolic homeostasis through adipose tissue crosstalk. Cell Metab. 2016;23(5):770–784. doi: 10.1016/j.cmet.2016.04.011. [DOI] [PMC free article] [PubMed] [Google Scholar]
- 39.Li R., Wang W.Q., Zhang H., et al. Adiponectin improves endothelial function in hyperlipidemic rats by reducing oxidative/nitrative stress and differential regulation of eNOS/iNOS activity. Am J Physiol Endocrinol Metab. 2007;293(6):E1703–E1708. doi: 10.1152/ajpendo.00462.2007. [DOI] [PubMed] [Google Scholar]
- 40.Deng G., Long Y., Yu Y.R., Li M.R. Adiponectin directly improves endothelial dysfunction in obese rats through the AMPK-eNOS Pathway. Int J Obes (Lond) 2010;34(1):165–171. doi: 10.1038/ijo.2009.205. [DOI] [PubMed] [Google Scholar]
- 41.Karava V., Christoforidis A., Kondou A., Dotis J., Printza N. Update on the crosstalk between adipose tissue and mineral balance in general population and chronic kidney disease. Front Pediatr. 2021;9 doi: 10.3389/fped.2021.696942. [DOI] [PMC free article] [PubMed] [Google Scholar]
- 42.Achari A.E., Jain S.K. Adiponectin, a therapeutic target for obesity, diabetes, and endothelial dysfunction. Int J Mol Sci. 2017;18(6):1321. doi: 10.3390/ijms18061321. [DOI] [PMC free article] [PubMed] [Google Scholar]
- 43.Goropashnaya A.V., Herron J., Sexton M., et al. Relationships between plasma adiponectin and body fat distribution, insulin sensitivity, and plasma lipoproteins in Alaskan Yup'ik Eskimos: the Center for Alaska Native Health Research study. Metabolism. 2009;58(1):22–29. doi: 10.1016/j.metabol.2008.09.002. [DOI] [PMC free article] [PubMed] [Google Scholar]
- 44.Bazanelli A.P., Kamimura M.A., Canziani M.E., Manfredi S.R., Cuppari L. Waist circumference as a predictor of adiponectin levels in peritoneal dialysis patients: a 12-month follow-up study. Perit Dial Int. 2013;33(2):182–188. doi: 10.3747/pdi.2011.00129. [DOI] [PMC free article] [PubMed] [Google Scholar]
- 45.Xu X., Tian X., Chen Y., Yang Z.K., Qu Z., Dong J. Associations of adiponectin, leptin Levels, and the change of body composition in patients on peritoneal dialysis: A prospective cohort study. Perit Dial Int. 2018;38(4):278–285. doi: 10.3747/pdi.2017.00177. [DOI] [PubMed] [Google Scholar]
- 46.Anastasia G., Athanasios R., Stefanos R., et al. Adiponectin plasma levels and albuminuria in patients with type 2 diabetes and different stages of diabetic kidney disease. J Nephrol Ther. 2017;7:2–7. [Google Scholar]
- 47.Sumi Y., Sakai Y., Terada K., Otsuka Y., Otsuka T., Tsuruoka S. Association of adipocytokines with peritoneal function. Perit Dial Int. 2021;41(1):79–85. doi: 10.1177/0896860819896133. [DOI] [PubMed] [Google Scholar]
- 48.Ouchi N., Walsh K. Adiponectin as an anti-inflammatory factor. Clin Chim Acta. 2007;380(1-2):24–30. doi: 10.1016/j.cca.2007.01.026. [DOI] [PMC free article] [PubMed] [Google Scholar]
- 49.Robinson K., Prins J., Venkatesh B. Clinical review: adiponectin biology and its role in inflammation and critical illness. Crit Care. 2011;15(2):221. doi: 10.1186/cc10021. [DOI] [PMC free article] [PubMed] [Google Scholar]
- 50.Menzaghi C., Trischitta V. The adiponectin paradox for all-cause and cardiovascular mortality. Diabetes. 2018;67(1):12–22. doi: 10.2337/dbi17-0016. [DOI] [PMC free article] [PubMed] [Google Scholar]
- 51.Ohashi N., Kato A., Misaki T., et al. Association of serum adiponectin levels with all-cause mortality in hemodialysis patients. Intern Med. 2008;47(6):485–491. doi: 10.2169/internalmedicine.47.0614. [DOI] [PubMed] [Google Scholar]
- 52.Abdallah E., Waked E., Nabil M., El-Bendary O. Adiponectin and cardiovascular outcomes among hemodialysis patients. Kidney Blood Press Res. 2012;35(4):247–253. doi: 10.1159/000334649. [DOI] [PubMed] [Google Scholar]
- 53.Markaki A., Kyriazis J., Stylianou K., et al. The role of serum magnesium and calcium on the association between adiponectin levels and all-cause mortality in end-stage renal disease patients. PLOS ONE. 2012;7(12) doi: 10.1371/journal.pone.0052350. [DOI] [PMC free article] [PubMed] [Google Scholar]
- 54.Rhee C.M., Nguyen D.V., Moradi H., et al. Association of adiponectin with body composition and mortality in hemodialysis patients. Am J Kidney Dis. 2015;66(2):313–321. doi: 10.1053/j.ajkd.2015.02.325. [DOI] [PMC free article] [PubMed] [Google Scholar]
- 55.Rao M., Li L., Tighiouart H., et al. Plasma adiponectin levels and clinical outcomes among haemodialysis patients. Nephrol Dial Transplant. 2008;23(8):2619–2628. doi: 10.1093/ndt/gfn070. [DOI] [PMC free article] [PubMed] [Google Scholar]
- 56.Spoto B., Mattace-Raso F., Sijbrands E., et al. Resistin and all-cause and cardiovascular mortality: effect modification by adiponectin in end-stage kidney disease patients. Nephrol Dial Transplant. 2013;28(suppl 4):iv181–iv187. doi: 10.1093/ndt/gft365. [DOI] [PubMed] [Google Scholar]
- 57.Zhou Y., Zhang J., Zhang W., Ni Z. Association of adiponectin with peripheral arterial disease and mortality in nondiabetic hemodialysis patients: long-term follow-up data of 7 years. J Res Med Sci. 2016;21:50. doi: 10.4103/1735-1995.184000. [DOI] [PMC free article] [PubMed] [Google Scholar]
- 58.Díez J.J., Estrada P., Bajo M.A., et al. High stable serum adiponectin levels are associated with a better outcome in prevalent dialysis patients. Am J Nephrol. 2009;30(3):244–252. doi: 10.1159/000221147. [DOI] [PubMed] [Google Scholar]
- 59.Tung C.W., Hsu Y.C., Shih Y.H., Lin C.L. Association of adiponectin with high-sensitivity C-reactive protein and clinical outcomes in peritoneal dialysis patients: a 3.5-year follow-up study. PLOS ONE. 2015;10(10) doi: 10.1371/journal.pone.0141058. [DOI] [PMC free article] [PubMed] [Google Scholar]
- 60.Park J.T., Yoo T.H., Kim J.K., et al. Leptin/adiponectin ratio is an independent predictor of mortality in nondiabetic peritoneal dialysis patients. Perit Dial Int. 2013;33(1):67–74. doi: 10.3747/pdi.2011.00066. [DOI] [PMC free article] [PubMed] [Google Scholar]