. 2015 Oct;136(4):702–718. doi: 10.1542/peds.2015-1283

FIGURE 2.

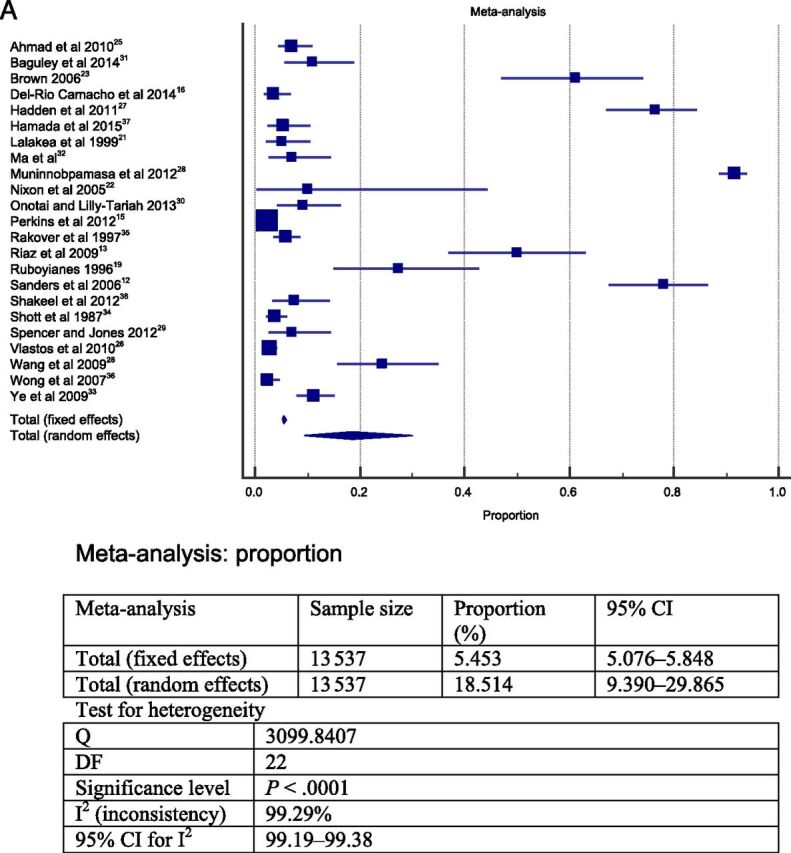
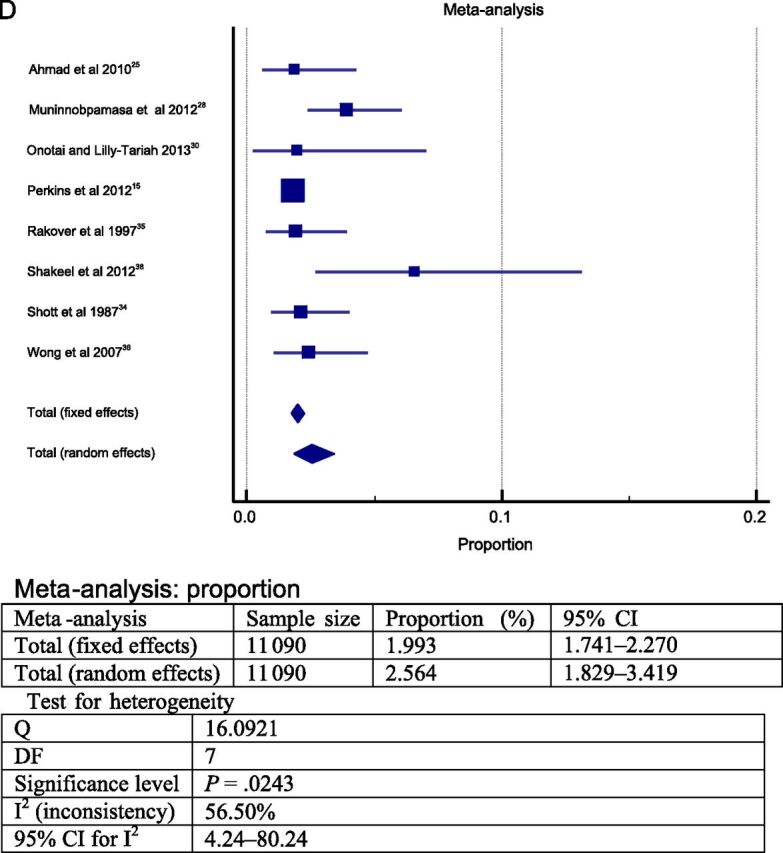
FIGURE 2. Forest plot question 1. Frequency of complications after AT in children (question 1). Results from 2 types of meta-analysis: fixed and random effects. A, Forest plot for all postoperative complications. Sample = 13 537. B, Forest plot for respiratory complications. Sample = 3148. C, Forest plot for primary hemorrhage. Sample = 11 760. D, Forest plot for secondary hemorrhage. Sample = 11 090.

FIGURE 2. Forest plot question 1. Frequency of complications after AT in children (question 1). Results from 2 types of meta-analysis: fixed and random effects. A, Forest plot for all postoperative complications. Sample = 13 537. B, Forest plot for respiratory complications. Sample = 3148. C, Forest plot for primary hemorrhage. Sample = 11 760. D, Forest plot for secondary hemorrhage. Sample = 11 090.
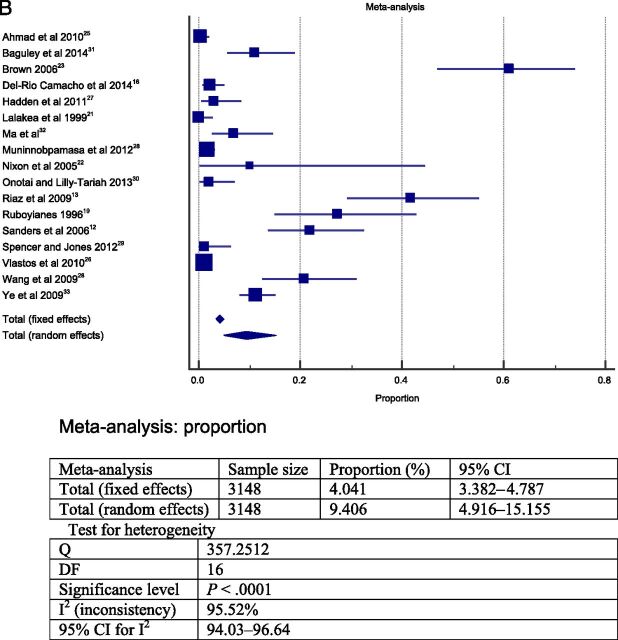
FIGURE 2. Forest plot question 1. Frequency of complications after AT in children (question 1). Results from 2 types of meta-analysis: fixed and random effects. A, Forest plot for all postoperative complications. Sample = 13 537. B, Forest plot for respiratory complications. Sample = 3148. C, Forest plot for primary hemorrhage. Sample = 11 760. D, Forest plot for secondary hemorrhage. Sample = 11 090.
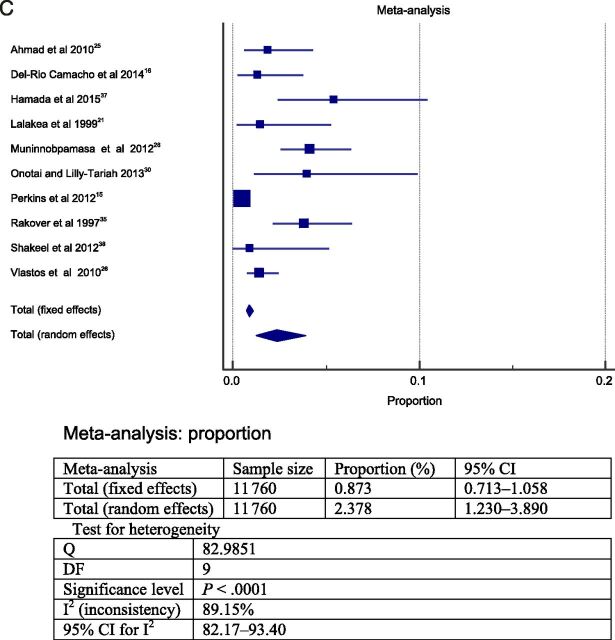
FIGURE 2. Forest plot question 1. Frequency of complications after AT in children (question 1). Results from 2 types of meta-analysis: fixed and random effects. A, Forest plot for all postoperative complications. Sample = 13 537. B, Forest plot for respiratory complications. Sample = 3148. C, Forest plot for primary hemorrhage. Sample = 11 760. D, Forest plot for secondary hemorrhage. Sample = 11 090.

Forest plot question 1. Frequency of complications after AT in children (question 1). Results from 2 types of meta-analysis: fixed and random effects. A, Forest plot for all postoperative complications. Sample = 13 537. B, Forest plot for respiratory complications. Sample = 3148. C, Forest plot for primary hemorrhage. Sample = 11 760. D, Forest plot for secondary hemorrhage. Sample = 11 090.