

Abstract
OBJECTIVE:
To increase knowledge on iron status and growth during the first 6 months of life. We hypothesized that iron status would be better in infants who received complementary foods in addition to breast milk compared with those exclusively breastfed.
METHODS:
One hundred nineteen healthy term (≥37 weeks) singleton infants were randomly assigned to receive either complementary foods in addition to breast milk from age 4 months (CF) or to exclusive breastfeeding for 6 months (EBF). Dietary data were collected by 3-day weighed food records, and data on iron status and growth were also collected.
RESULTS:
One hundred infants (84%) completed the trial. Infants in the CF group had higher mean serum ferritin levels at 6 months (P = .02), which remained significant when adjusted for baseline characteristics. No difference was seen between groups in iron deficiency anemia, iron deficiency, or iron depletion. The average daily energy intake from complementary foods of 5-month-olds in the CF group was 36.8 kJ per kg body weight. Infants in both groups grew at the same rate between 4 and 6 months of age.
CONCLUSIONS:
In a high-income country, adding a small amount of complementary food in addition to breast milk to infants’ diets from 4 months of age does not affect growth rate between 4 and 6 months, but has a small and positive effect on iron status at 6 months. The biological importance of this finding remains to be determined.
Keywords: exclusive breastfeeding, complementary feeding, iron status, growth rate, randomized trial
What’s Known on This Subject:
In a previous randomized trial, infants from a low-resource country exclusively breastfed for 6 months had lower iron stores at 6 months compared with breastfeeding infants receiving solid foods. Randomized trials of exclusive breastfeeding in high-income countries are lacking.
What This Study Adds:
In a high-income country, infants who receive complementary foods in addition to breast milk from 4 months of age had higher iron stores at 6 months compared with those exclusively breastfed for 6 months.
In 2001, after a World Health Organization (WHO) Expert Consultation on the Optimal Duration of Exclusive Breastfeeding 1 and a systematic review, 2 WHO changed the recommended duration of exclusive breastfeeding from the first 4 to 6 months 3 to the first 6 months of life. The principle reason for this change was to provide optimal nutrition to young infants in low-resource countries where available water and complementary foods may be nutritionally inadequate or contaminated. 4 – 6 In high-income countries, the evidence for recommending 6 months of exclusive breastfeeding is less clear. 7 One systematic review of the optimal age for the introduction of complementary foods concluded that there was inadequate evidence to increase the duration of exclusive breastfeeding from 4 to 6 months of age. 8 Because few randomized controlled trials are available, WHO has requested such trials be done to guide policy decisions in this regard. 2
In this study, we sought to examine the optimal duration of exclusive breastfeeding by conducting a masked, randomized, controlled trial comparing the iron status and growth rate of infants in Iceland randomized to 4 versus 6 months of exclusive breastfeeding. Our primary hypothesis in this analysis was that serum iron status at 6 months of age would be better in infants who received complementary foods in addition to breast milk from 4 months of age compared with those exclusively breastfed. Secondary outcomes included gains in infant weight, length, and head circumference during the study period.
Methods
Study Design
This parallel group, masked, randomized controlled trial was conducted in 7 health care centers in Iceland where >46% of mothers exclusively breastfeed through 4 months of age. 9 , 10 The study was reviewed and approved by the Data Protection Authority and National Bioethical Committee in Iceland and the Partners Health System Institutional Review Board.
Mothers of eligible infants (singleton birth, gestational length ≥37 weeks, exclusively breastfed, infant characterized as healthy; ie, absence of congenital abnormalities or chronic health issues likely to affect growth, development, or iron status) were informed about the study when their infant was ∼2 months old and given study handouts if the infant was still exclusively breastfed at age 3 months. They were contacted before the infant’s 4-month birthday and, if still exclusively breastfeeding, invited to participate in the trial.
Mothers and their infants attended a screening visit and, after obtaining informed consent, were evaluated for the following additional eligibility criteria: exclusively breastfed at the time of assessment, mother willing to continue to breastfeed exclusively until 6 months or give complementary foods at 4 months based on randomization, and mother-infant pair likely able to participate for the duration of the study. Exclusive breastfeeding was defined as breastfeeding with no additional liquid or solid foods other than vitamins and medications. 11 The use of up to 10 feedings of formula or water during the first 6 months was allowed to avoid having to exclude infants who were otherwise exclusively breastfed.
Eligible infant-mother pairs were randomly assigned to receive complementary foods from age 4 months in addition to breast milk (CF) or to continue being exclusively breastfed to age 6 months (EBF). Vitamin D supplements were recommended in both groups. Mothers in both groups received counseling from a nurse who also was an International Board Certified Lactation Consultant. Mothers in the EBF group were advised to breastfeed exclusively for 6 months, and mothers in the CF group were advised to give the infant complementary foods within 7 days of randomization, along with continued breastfeeding. During the 2-month study period, mothers could at all times contact the research staff at the Unit for Nutrition Research and the International Board Certified Lactation Consultant nurse at the health care centers.
Randomization
The trial statistician provided a computer generated randomization code. Assignments were generated by using permuted blocks of 2 and 4, with the sequence presented in random order. Assignments were accessed by using a password-protected web-based application, after eligibility criteria were confirmed.
Dietary Assessment
Mothers assigned to the CF group were asked to keep a diary to indicate the date that every new food item was added to the infant’s diet from the time of enrollment into the study until the child was 6 months of age. A 3-day weighed food record was obtained when the infant reached ∼5 months and 1 week (±7 days) of age. Parents were asked to weigh and record every food their infant consumed over this 3-day period, using electronic scales with 1-g accuracy (Philips HR 2385, Philips, Szekesfehervar, Hungary) provided by the study team. Energy and nutrient information were calculated with the nutrient calculation software ICEFOOD (version 2002; Public Health Institute of Iceland, Reykjavik, Iceland), with added information about infant foods. 12
Anthropometric Assessment
Infants’ weight, length, and head circumference were measured at birth, 6 weeks, and 3, 4, 5, and 6 months of age at their health care center. Mothers who enrolled in the study were asked if these records could be accessed to determine their infant’s growth rate for the trial period. The scales used to weigh the infants were Seca model 727 or model 757 (Vogel & Halke, Hamburg, Germany) depending on the health care center. Length was measured with the infant supine on a standard measuring board with a sliding foot plate (Seca model 207, Vogel & Halke). Head circumference was measured with nonstretchable tape. Infants were measured once at each visit by an experienced child health nurse trained specifically for the study. Weight, length, and head circumference were converted to z scores using the WHO Infant Growth Standards. 13
Blood Samples
Blood samples were obtained from the infants to determine iron status. Blood for hemoglobin (Hb), mean corpuscular volume (MCV), red blood cell distribution width (RDW), serum ferritin (SF), and total iron-binding capacity (TIBC) was obtained from the infants at age 6 months (±7 days) by an experienced pediatrician at the age of 6 months (±7 days). Analyses were done by using a Coulter Counter STKS at Landspitali National University Hospital of Iceland. The criteria for iron deficiency anemia (IDA) required that all 3 indicators met the following cutpoints: Hb <105 g/L, MCV <74 fl, and SF <12 µg/L. The same cutpoints were used to evaluate both iron deficiency (ID; MCV <74 fl and SF <12 µg/L) and iron depletion (SF <12 µg/L). 14 – 17
Statistical Analysis
Our sample size of 50 mother-infant pairs who completed their participation in each group (n = 100) was based on primary outcome of the study, breast-milk intake. That sample size allowed for the detection of an effect size of 0.6 between the 2 groups with 5% significance level (2-sided comparison) and 80% power. Subjects were recruited until 100 had completed the protocol. Statistical analysis was performed by using SPSS software (version 17; SPSS Inc., Chicago, IL).
For descriptive analysis, data were presented as mean and SD when normally distributed and median and interquartile range when not normally distributed. For comparison between two groups, the independent t test was used when data were normally distributed and the non-parametric Mann-Whitney U test was used when data were not normally distributed. χ-Square test or Fisher’s exact test was used for dichotomous variables. Multiple regression analysis was done to evaluate the predictors of iron status indices at 6 months. If there were baseline characteristics that were significantly different between the two intervention groups, for all subjects or among those who finished the whole trial, they were adjusted for in the regression analysis.
Results
Sample Size and Characteristics
One hundred nineteen mother-infant pairs were enrolled in the study between November 2007 and November 2009 (see Fig 1). One mother-infant pair was randomized to the CF group but was incorrectly instructed to exclusively breastfeed, which she did, so in the main analyses, this infant was analyzed in the EBF group. There were 10 dropouts in the CF group and 9 in the EBF group. Mothers of infants who dropped out had significantly fewer children in the household (1.0 ± 1.0 vs 2.0 ± 2.0; P = .03). The infants who dropped out had higher interval increases in z score for length (1.07 ± 0.59 vs 0.65 ± 0.86; P = .01) and gained more length from birth to 4 months of age (0.16 ± 0.90 vs –.43 ± 1.00; P = .02) compared with those who remained in the study. When categorized according to intention to treat no statistically significant differences were seen between groups in baseline characteristics in mothers or infants (see Table 1). No significant differences were seen between intervention groups in the characteristics (same as shown in Table 1) of subjects who completed the whole trial (n = 100), except for mode of delivery, for which vaginal delivery was more common in the CF group (90% vs 73% in the EBF group, P = .03).
FIGURE 1.
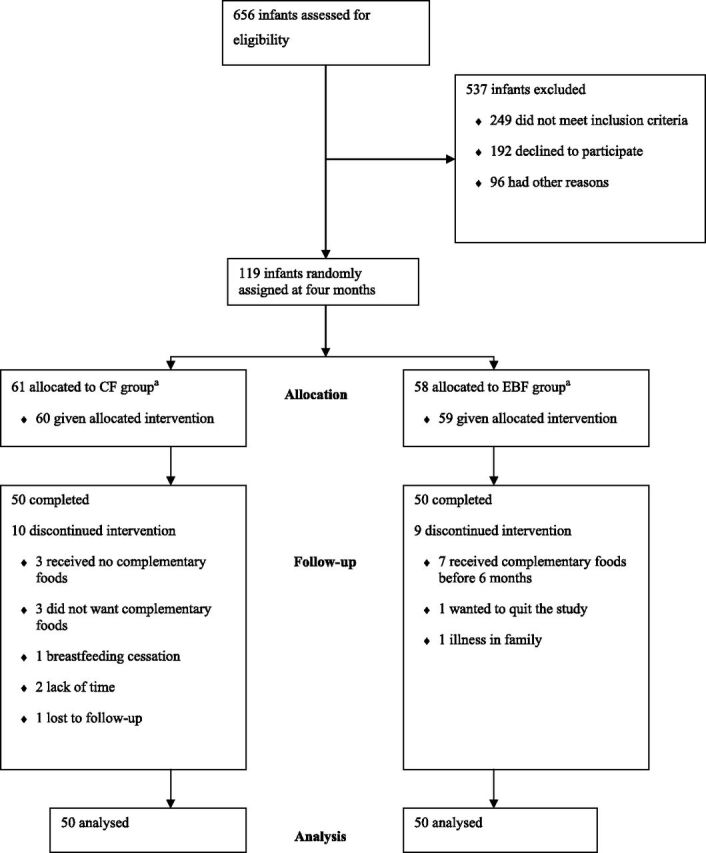
Trial profile: infants who received complementary foods in addition to breast milk from 4 months compared with infants who were exclusively breastfed for 6 months. aOne mother-infant pair was incorrectly instructed to group EBF and was therefore analyzed in group EBF.
TABLE 1.
Baseline Characteristics of Subjects: Infants Who Received Complementary Foods in Addition to Breast Milk From 4 Months Compared With Infants Who Were Exclusively Breastfed for 6 Months, a Categorized According to Intention to Treat
| CF (n = 61) | EBF (n = 58) | |
|---|---|---|
| Infant characteristics | ||
| Gender: boys | 31 (51%) b | 24 (41%) b |
| Age at randomization (d) | 122.9 (3.3) | 123.1 (3.1) |
| Gestational length (d) | 281.5 (8.4) | 279.6 (9.3) |
| Wt for age at birth c | 0.86 (0.83) | 0.78 (0.96) |
| Birth wt (kg) | 3.72 (0.43) | 3.68 (0.51) |
| Length for age at birth c | 1.07 (0.89) | 1.03 (1.06) |
| Length at birth (cm) | 51.5 (1.7) | 51.4 (2.1) |
| Head circumference for age at birth c | 1.40 (1.01) d | 1.44 (1.08) |
| Head circumference at birth (cm) | 35.9 (1.3) d | 35.9 (1.4) |
| Wt for age at 4 mo c | 0.36 (0.98) | 0.32 (0.80) |
| Wt at 4 mo (kg) | 7.07 (0.92) | 6.97 (0.79) |
| Length for age at 4 mo c | 0.68 (0.88) | 0.75 (0.80) |
| Length at 4 mo (cm) | 64.5 (2.2) | 64.5 (1.9) |
| Head circumference for age at 4 mo c | 0.93 (0.71) | 0.92 (0.88) |
| Head circumference at 4 mo (cm) | 42.3 (1.1) | 42.2 (1.3) |
| Maternal characteristics | ||
| Age at randomization (y) | 29.7 (5.2) | 30.1 (5.2) |
| Parity | 2.0 (2.0) e | 2.0 (2.0) e |
| Maternal education at university level f | 36 (59%) b | 29 (50%) b |
| Vaginal delivery | 54 (89%) b | 45 (78%) b |
Data are mean (SD) unless otherwise indicated.
One mother-infant pair was incorrectly instructed to follow directions for the EBF group.
Data are presented as n (%).
z scores calculated using WHO reference.
One missing value, n = 60.
Data are presented as median (interquartile range).
Finished studies at university level.
Infant Growth and Iron Status
Table 2 compares gain in weight, length, and head circumference z scores from 0 to 4, 4 to 6, and 0 to 6 months between groups. No significant differences were seen in growth rate between the groups before the intervention period (0 to 4 months) or during the intervention period (4 to 6 months) or from birth to 6 months, categorized according to infant diet during the study period.
TABLE 2.
Growth Rate in z Scores and Iron Status Indices in the 2 Intervention Groups, CF and EBF, a Categorized According to Infant Diet During the Study Period
| Variables | CF (n = 50) | EBF (n = 50) | P value |
|---|---|---|---|
| Wt gain from 0–4 mo b | −0.54 (1.01) | −0.42 (1.04) | .51 |
| Length gain from 0–4 mo b | −0.41 (0.85) | −0.26 (1.14) | .40 |
| Gain in HC from 0 to 4 mo b | −0.47 (0.84) c | −0.52 (1.03) | .80 |
| Wt gain from 4 to 6 mo | −0.02 (0.31) | −0.01 (0.42) | .90 |
| Length gain from 4 to 6 mo | 0.03 (0.50) | 0.04 (0.51) | .96 |
| Gain in HC from 4-6 mo | 0.06 (0.40) | 0.06 (0.48) | .99 |
| Wt gain from 0 to 6 mo | −0.55 (1.12) | −0.46 (1.17) | .71 |
| Length gain from 0 to 6 mo | −0.41 (0.95) | −0.37 (1.18) | .85 |
| Gain in HC from 0 to 6 mo | −0.36 (0.87) c | −0.41 (1.01) | .80 |
| Hb (g/L) d | 113.9 (6.1) | 113.7 (7.3) e | .91 |
| MCV (fl) d | 74.4 (3.3) | 73.4 (2.6) e | .11 |
| SF (µg/L) d | 70.0 (73.3) f | 44.0 (53.8) f | .02 |
| TIBC (µmol/L) d | 59.2 (9.2) | 60.8 (10.1) | .43 |
| RDW d | 13.0 (0.7) | 13.2 (0.7) e | .13 |
Data are mean (SD) unless otherwise indicated. HC, head circumference.
One mother-infant pair was incorrectly instructed to follow directions for the EBF group and was therefore analyzed in that group.
CF n = 60; EBF n = 59.
One missing value.
Hb, MCV, and RDW n = 98; SF n = 94; TIBC n = 95.
Mean (SD) calculated with values from a blood sample taken 2 weeks later than 6 mo from 1 infant because some indices were inadvertently not examined on the first sample and were therefore examined on the second sample.
Data are median (interquartile range).
Infants in CF group had significantly higher SF levels than those in EBF group (P = .02) as shown in Table 2. One infant in EBF group had a urinary tract infection 2 weeks before the blood sample was taken, which might have affected the SF level at 6 months, 18 which was high (524 µg/L). When this outlier was excluded from the data analysis, the infants in the CF group still had significantly higher SF level at 6 months (70.0 ± 73.0 µg/L vs 43.0 ± 50.0 µg/L in the EBF group; P = .013). Excluding infants (n = 16) who had any problem that might have affected the ferritin level (infections, C-reactive protein concentration >10 mg/L 19 or those in group EBF who received any complementary foods before 6 months) the difference in SF level remained significant, with higher levels of SF among infants in CF group (67.0 ± 61.0 µg/L vs 34.0 ± 44.5 µg/L in the EBF group; P = .003).
Figure 2 shows box plots of SF divided into quartiles for comparison between groups; in each quartile infants who received complementary foods had higher SF levels, significant in all quartiles. There was no significant difference in Hb, MCV, TIBC, or RDW between the 2 study groups. One infant in EBF group had 2 blood samples drawn (1 at age 6 months +4 days and the other at 6 months +18 days) because some indices were inadvertently not examined on the first sample and were therefore examined on the second sample, and values from both samples were combined into 1 report. SF was transformed because of its skewed distribution, and regression analysis was undertaken to test the impact of the intervention by group, excluding the outlier. It showed that SF differences remained significant (P = .035) when adjusted for mode of delivery, which was significantly different between groups at baseline.
FIGURE 2.

Box plot of SF divided into quartiles for comparison between groups in each quartile (1 outlier excluded). Mean and SD for each group in each quartile are presented in parentheses: lowest quartile (CF: 17.8 ± 8.4 µg/L vs EBF: 11.9 ± 3.4 µg/L; n = 22; P = .05), second quartile (CF: 49.4 ± 12.7 µg/L vs EBF: 29.9 ± 8.5 µg/L; n = 25; P < .001), third quartile (CF: 83.4 ± 7.8 µg/L vs EBF: 55.5 ± 8.6 µg/L; n = 24; P < .001) and highest quartile (CF: 176.6 ± 45.2 µg/L vs EBF: 117.4 ± 47.5 µg/L; n = 22; P = .007).
Seven infants had depleted iron stores at age 6 months, 5 of whom were in the EBF group and 2 in the CF group (P = .44). Of those 7 infants, 6 were also ID (4 in group EBF, 2 in the CF group; P = .68) and 2 had IDA (1 in group EBF, 1 in group CF; P = 1.00).
Nutrient Intake
Table 3 shows the results of weighed dietary registration for infants in the CF group and the percentage of recommended daily intake. Average daily intake of complementary foods among infants in the CF group was 92.2 ± 66.5 g. Mean energy intake from complementary foods at 5 months was 265.4 ±219.0 kJ per day (63.4 ± 52.3 kcal/d) and 36.8 kJ/kg body weight (8.8 kcal/kg), which is 10% of the average daily energy requirements for infants 6 to 11 months of age.
TABLE 3.
Intake of Selected Nutrients Received at 5.25 Months of Age as an Average Intake From Weighed Dietary Registration of Complementary Foods (n = 50)
| Mean (SD) | Median (IQR) | RDI (6–11 mo) | % of RDI | |
|---|---|---|---|---|
| Energy (kJ/d) | 265.4 (219.0) | 178.1 (271.0) | — | — |
| Energy (kJ/kg) | 36.8 (32.1) | 22.5 (42.2) | 355 | 10 |
| Protein (g/d) | 1.3 (1.1) | 0.9 (1.3) | — | — |
| Protein (g/kg) | 0.2 (0.2) | 0.1 (0.2) | 1.1 | 18 |
| Iron (mg/d) | 0.6 (0.5) | 0.3 (0.7) | 8 | 8 |
| Vitamin C (mg/d) | 8.8 (9.9) | 3.9 (15.5) | 20 | 44 |
| Calcium (mg/d) | 32.5 (41.7) | 11.2 (46.3) | 540 | 6 |
| Vitamin D (µg/d) | 4.3 (4.6) | 2.5 (9.9) | 10 | 43 |
All infants received breast milk in addition to the complementary foods, breast milk is not included in the table. One mother-infant pair was incorrectly instructed to group EBF and was therefore analyzed in group EBF. IQR, interquartile range; RDI, recommended daily intake. *Recommended daily intake does not exist for energy (Kj/d) or protein (g/d).
The mean daily intake of iron from complementary foods was 0.6 mg, which is 8% of an infant’s average daily iron requirements at age 6 to 11 months. The main sources of iron from the complementary foods consumed by infants in CF group were infant cereals (67%), infant formula (17%), and fruit purées (8%). Vitamin C intake from complementary foods mostly came from fruit purée (43%), infant cereals (21%), fruits and vegetables (15%), and infant formula (14%). Iron or vitamin C intake did not correlate with any iron status indices at 6 months, nor did total food or formula intake (data not shown).
Discussion
In 2001, WHO requested randomized trials of exclusive breastfeeding in both high-income and low-resource countries. To our knowledge this is the first such trial to examine the effects of exclusive breastfeeding for 4 versus 6 months on iron status and growth in a high-income country. Weight, length, and head circumference measures in these 2 groups of infants were equivalent, and no significant differences were seen between groups in growth before or during the intervention period or from birth to 6 months.
The results of the current study regarding growth are consistent with results from Kramer and Kakuma’s systematic review, 2 which was the basis of the WHO recommendation regarding the optimal duration of exclusive breastfeeding. The review concluded that there was no reduction in growth in children exclusively breastfed for 4 versus 6 months. These findings are also consistent with our previous analysis in which infants in the CF group consumed less breast milk than those in EBF group and received their compensatory energy from complementary foods, when measured by stable isotope techniques. 20 Whereas infants in CF group had higher iron stores at 6 months compared with those in EBF group, both had adequate stores as measured by SF levels and no significant differences were seen between groups in iron deficiency with or without anemia. The mode of delivery was significantly different between groups among those who finished the intervention, and this could affect the timing of umbilical cord clamping. Delayed cord clamping can have a beneficial effect on infant iron and hematologic status through 6 months of age. 21 – 23 After adjustments for mode of delivery, the association of intervention diet with SF was still seen, suggesting that the higher iron stores were related to the complementary feeding. These findings are consistent with those of a similar study conducted in a low-resource country in which infants who were exclusively breastfed for 6 months had lower measures of iron stores at 6 months compared with infants who received solid foods in addition to breast milk (48.4 vs 67.3 µg/L). 24 Other investigators have shown that infants with a higher growth rate are at greater risk of iron deficiency, 25 , 26 thought to be accounted for by more rapidly depleted iron stores from birth with greater weight gain. 27 Because weight gain did not differ between groups in this study, weight gain cannot account for the differences in the observed SF levels.
In the current study, the intake of complementary foods by infants in the CF group was much lower than expected, with an average energy intake of 265.4 kJ/d and mean daily iron intake of 0.6 mg per day at age 5 months and 1 week. Average energy intake and the amount of iron that these infants received from complementary foods was small, only 59% of the mean energy intake (451 kJ/d) and 15% of the mean iron intake (4.1 mg/d) that breastfeeding infants in Honduras received from solid foods at 21 weeks of age. 24 In our study, we considered whether vitamin C in complementary foods can have an effect on iron absorption 28 but saw no relationship between vitamin C intake and measures of iron status. This is likely related to low intakes of complementary foods, and thus both iron and vitamin C, among these infants. This low complementary food intake might be explained by the manner in which the study was presented to the mothers of infants in group CF. The mothers were told to give their infant some complementary foods daily, but no amount was specified. Alternatively, these infants may have consumed more complementary foods during the course of the study than parents recorded, either overall or during the specific 3-day period when they weighed and recorded the foods. Nevertheless, the CF infants stored significantly more iron. The biological importance of this finding remains to be seen, because both groups had values of SF considered to be within normal values, and the infants in the study were not followed beyond 6 months of age.
The dropout rate in the current study was low and similar in the 2 study groups. The length-for-age at 4 months was higher in the dropout group than among those who finished the whole intervention trial; also, the dropouts gained length faster from birth to 4 months. Thus, it is possible that some of those infants who left the study did so because of higher energy demand. Mothers who dropped out of the study had significantly fewer children in the household and were equally represented between both study groups.
A modified per protocol analysis were conducted for the mother-infant pair who was incorrectly instructed to group EBF. Whether an intent to treat or a modified per protocol analysis was conducted, the outcome remained unchanged.
Which markers should be used to detect iron deficiency is controversial. The iron status indicators and the thresholds chosen in the study are in line with studies on infant population in the neighboring countries and previous infant studies conducted in Iceland. Iron status at baseline was not possible to measure, and this is a limitation of the study.
Conclusions
The current study showed a significant difference in SF levels between groups, and the association between the timing of the introduction of complementary foods and SF was still seen after adjustments for baseline differences. The amount of complementary foods consumed from age 4 months by infants in this study was small as measured at 5 months and did not affect the growth of these infants compared with those exclusively breastfed. In this study, conducted in an urban setting in a high-income country, the biological significance of the higher SF levels among those infants who began complementary feeding at 4 months of age remains to be determined.
Acknowledgments
We are grateful to the infants and their parents for their willingness to participate in the study. We gratefully acknowledge the nurses at the Centre for Child Health Services, Jona Margret Jonsdottir, and Sesselja Gudmundsdottir, and the nurses at the Health Care centers, Alma Maria Rognvaldsdóttir, Audur Egilsdottir, Dagny Gudmundsdottir, Elin Sigurbjornsdottir, Gudrun Gudmundsdottir, Ingibjorg Eiriksdottir, and Kristin J. Vigfusdottir, for recruiting mother-infant pairs and their significant assistance in data collection. We also thank dietician Margret Thora Jonsdottir and PhD student Tinna Eysteinsdottir for their assistance in collecting data and the staff in the laboratories at Landspitali National University Hospital of Iceland for blood analysis.
Glossary
- CF
complementary feeding in addition to breast milk from the age of 4 months
- EBF
exclusive breastfeeding to the age of 6 months
- Hb
hemoglobin
- ID
iron deficiency
- IDA
iron deficiency anemia
- MCV
mean corpuscular volume
- RDW
red blood cell distribution width
- SF
serum ferritin
- TIBC
total iron-binding capacity
- WHO
World Health Organization
Footnotes
This study was structured by Drs Kleinman, Gunnlaugsson, Lucas, Fewtrell, and Jane Morgan (now retired) and subsequently designed in detail by them with Drs Hibberd, Thorsdottir, and Wells. Mrs Jonsdottir was responsible for the nutritional and isotope data collection, and, following extensive discussions among the study team, she conducted the statistical analysis and wrote the first draft of the manuscript, which was critically reviewed and revised by all authors. Funding was initially sought unsuccessfully from the National Institutes of Health but subsequently provided by Mead Johnson and the Eimskip Fund of the University of Iceland. All authors had full access to the trial data for interpretation. The corresponding author was responsible for the final decision to submit the report for publication.
The sponsors of the study had no role in study design, data collection, data analysis, data interpretation, preparation of the report, or the decision to submit for publication.
This trial has been registered with the ISRCTN Register (http://isrctn.org) (identifier ISRCTN41946519).
FUNDING: This study was supported by Mead Johnson and the Eimskip Fund of the University of Iceland. Additional support was provided by the Primary Health Care Organisations in Reykjavík Capital Area, Akranes and Sudurnes, and the directors of the participating health centers.
References
- 1.World Health Organization. The Optimal Duration of Exclusive Breastfeeding: Report of an Expert Consultation (WHO/NHD/01.09). Geneva, Switzerland: Department of Nutrition for Health and Development and Department of Child and Adolescent Health and Development, World Health Organization, 2001
- 2.Kramer MS, Kakuma R. The Optimal Duration of Exclusive Breastfeeding: A Systematic Review (WHO/NHD/01.08). Geneva, Switzerland: Department of Nutrition for Health and Development and Department of Child and Adolescent Health and Development, World Health Organization: 2001 [Google Scholar]
- 3. World Health Organization . Nutrition: Information and attitudes among health personnel about early infant-feeding practices. Wkly Epidemiol Rec. 1995;70(17):117–120 [PubMed] [Google Scholar]
- 4. Kramer MS , Chalmers B , Hodnett ED , et al. PROBIT Study Group (Promotion of Breastfeeding Intervention Trial) . Promotion of Breastfeeding Intervention Trial (PROBIT): a randomized trial in the Republic of Belarus. JAMA. 2001;285(4):413–420 [DOI] [PubMed] [Google Scholar]
- 5. Monterrosa EC , Frongillo EA , Vásquez-Garibay EM , Romero-Velarde E , Casey LM , Willows ND . Predominant breast-feeding from birth to six months is associated with fewer gastrointestinal infections and increased risk for iron deficiency among infants. J Nutr. 2008;138(8):1499–1504 [DOI] [PubMed] [Google Scholar]
- 6. Kramer MS , Guo T , Platt RW , et al. Infant growth and health outcomes associated with 3 compared with 6 mo of exclusive breastfeeding. Am J Clin Nutr. 2003;78(2):291–295 [DOI] [PubMed] [Google Scholar]
- 7. Fewtrell MS , Morgan JB , Duggan C , et al. Optimal duration of exclusive breastfeeding: what is the evidence to support current recommendations? Am J Clin Nutr. 2007;85(2):635S–638S [DOI] [PubMed] [Google Scholar]
- 8. Lanigan JA , Bishop JA , Kimber AC , Morgan J . Systematic review concerning the age of introduction of complementary foods to the healthy full-term infant. Eur J Clin Nutr. 2001;55(5):309–320 [DOI] [PubMed] [Google Scholar]
- 9. Atladottir H , Thorsdottir I . Energy intake and growth of infants in Iceland—a population with high frequency of breast-feeding and high birth weight. Eur J Clin Nutr. 2000;54(9):695–701 [DOI] [PubMed] [Google Scholar]
- 10. Thorisdottir AV , Thorsdottir I , Palsson GI . Nutrition and iron status of 1-year olds following a revision in infant dietary recommendations. Anemia. 2011;2011:986303 [DOI] [PMC free article] [PubMed] [Google Scholar]
- 11. WHO . Indicators for Assessing Breastfeeding Practices. Report of an Informal Meeting. Division of Child and Adolescent Health (WHO/CDD/SER/91.14). Geneva, Switzerland: World Health Organization; 1991. [Google Scholar]
- 12. Steingrímsdottir L , Þorgeirsdottir H , Olafsdottir AS . The Icelandic National Nutrition Survey 2002. Reykjavík: Public Health Institute of Iceland; 2003. [Google Scholar]
- 13.WHO Anthro for personal computers, version 3.1, 2010: Software for assessing growth and development of the world’s children. Geneva, Switzerland: WHO, 2010. Available at: www.who.int/childgrowth/software/en. Accessed October 1, 2012
- 14. Thorsdottir I , Gunnarsson BS , Atladottir H , Michaelsen KF , Palsson G . Iron status at 12 months of age—effects of body size, growth and diet in a population with high birth weight. Eur J Clin Nutr. 2003;57(4):505–513 [DOI] [PubMed] [Google Scholar]
- 15. Nordic Expert Group for Nutritional Recommendations . Nordic Nutrition Recommendation 2004. Copenhagen, Denmark: Nordic Council of Ministers, 2004:13 [Google Scholar]
- 16. Michaelsen KF , Milman N , Samuelson G . A longitudinal study of iron status in healthy Danish infants: effects of early iron status, growth velocity and dietary factors. Acta Paediatr. 1995;84(9):1035–1044 [DOI] [PubMed] [Google Scholar]
- 17. Fuchs GJ , Farris RP , DeWier M , et al. Iron status and intake of older infants fed formula vs cow milk with cereal. Am J Clin Nutr. 1993;58(3):343–348 [DOI] [PubMed] [Google Scholar]
- 18. Beard JL , Murray-Kolb LE , Rosales FJ , Solomons NW , Angelilli ML . Interpretation of serum ferritin concentrations as indicators of total-body iron stores in survey populations: the role of biomarkers for the acute phase response. Am J Clin Nutr. 2006;84(6):1498–1505 [DOI] [PubMed] [Google Scholar]
- 19. Singer JI , Buchino JJ , Chabali R . Selected laboratory in pediatric emergency care. Emerg Med Clin North Am. 1986;4(2):377–396 [PubMed] [Google Scholar]
- 20. Wells JC , Jonsdottir OH , Hibberd PL , et al. Randomized controlled trial of 4 compared with 6 mo of exclusive breastfeeding in Iceland: differences in breast-milk intake by stable-isotope probe. Am J Clin Nutr. 2012;96(1):73–79 [DOI] [PMC free article] [PubMed] [Google Scholar]
- 21. Ceriani Cernadas JM , Carroli G , Pellegrini L , et al. The effect of early and delayed umbilical cord clamping on ferritin levels in term infants at six months of life: a randomized, controlled trial [in Spanish]. Arch Argent Pediatr. 2010;108(3):201–208 [DOI] [PubMed] [Google Scholar]
- 22. Hutton EK , Hassan ES . Late vs early clamping of the umbilical cord in full-term neonates: systematic review and meta-analysis of controlled trials. JAMA. 2007;297(11):1241–1252 [DOI] [PubMed] [Google Scholar]
- 23. Chaparro CM , Neufeld LM , Tena Alavez G , Eguia-Líz Cedillo R , Dewey KG . Effect of timing of umbilical cord clamping on iron status in Mexican infants: a randomised controlled trial. Lancet. 2006;367(9527):1997–2004 [DOI] [PubMed] [Google Scholar]
- 24. Dewey KG , Cohen RJ , Rivera LL , Brown KH . Effects of age of introduction of complementary foods on iron status of breast-fed infants in Honduras. Am J Clin Nutr. 1998;67(5):878–884 [DOI] [PubMed] [Google Scholar]
- 25. Yang Z , Lönnerdal B , Adu-Afarwuah S , et al. Prevalence and predictors of iron deficiency in fully breastfed infants at 6 mo of age: comparison of data from 6 studies. Am J Clin Nutr. 2009;89(5):1433–1440 [DOI] [PubMed] [Google Scholar]
- 26. Wharf SG , Fox TE , Fairweather-Tait SJ , Cook JD . Factors affecting iron stores in infants 4–18 months of age. Eur J Clin Nutr. 1997;51(8):504–509 [DOI] [PubMed] [Google Scholar]
- 27. Lartey A , Manu A , Brown KH , Dewey KG . Predictors of micronutrient status among six- to twelve-month-old breast-fed Ghanaian infants. J Nutr. 2000;130(2):199–207 [DOI] [PubMed] [Google Scholar]
- 28. Siegenberg D , Baynes RD , Bothwell TH , et al. Ascorbic acid prevents the dose-dependent inhibitory effects of polyphenols and phytates on nonheme-iron absorption. Am J Clin Nutr. 1991;53(2):537–541 [DOI] [PubMed] [Google Scholar]