

Abstract
In mammalian development, oscillatory activation of Notch signaling is required for segmentation clock function during somitogenesis. Notch activity oscillations are synchronized between neighboring cells in the presomitic mesoderm (PSM) and have a period that matches the rate of somite formation. Normal clock function requires cyclic expression of the Lunatic fringe (LFNG) glycosyltransferase, as well as expression of the inhibitory Notch ligand Delta-like 3 (DLL3). How these factors coordinate Notch activation in the clock is not well understood. Recent evidence suggests that LFNG can act in a signal-sending cell to influence Notch activity in the clock, raising the possibility that in this context, glycosylation of Notch pathway proteins by LFNG may affect ligand activity. Here we dissect the genetic interactions of Lfng and Dll3 specifically in the segmentation clock and observe distinctions in the skeletal and clock phenotypes of mutant embryos showing that paradoxically, loss of Dll3 is associated with strong reductions in Notch activity in the caudal PSM. The patterns of Notch activity in the PSM suggest that the loss of Dll3 is epistatic to the loss of Lfng in the segmentation clock, and we present direct evidence for the modification of several DLL1 and DLL3 EGF-repeats by LFNG. We further demonstrate that DLL3 expression in cells co-expressing DLL1 and NOTCH1 can potentiate a cell’s signal-sending activity and that this effect is modulated by LFNG, suggesting a mechanism for coordinated regulation of oscillatory Notch activation in the clock by glycosylation and cis-inhibition.
Keywords: Lunatic fringe, Notch pathway, DLL1, DLL3, Deltalike, glycosylation, somitogenesis
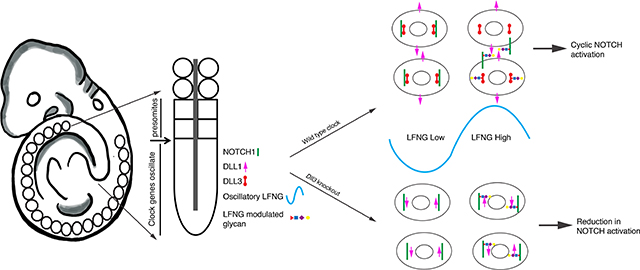
Graphical Abstract
Introduction
The Notch signaling pathway is an evolutionarily conserved signaling pathway involved in a number of developmental decisions (Carrieri and Dale, 2017; Wahi et al., 2016). In canonical Notch signaling, a Notch receptor presented on the surface of a signal-receiving cell is bound in trans by a ligand presented on a neighboring signal-sending cell (Hori et al., 2013). Ligand binding triggers a series of proteolytic cleavage events, resulting in the release of the Notch receptor intracellular domain (NICD). NICD translocates to the nucleus and drives the expression of Notch downstream targets (Bray and Bernard, 2010; Kopan and Ilagan, 2009). Notch activation is regulated on a number of levels. For example, co-expression of Notch ligands and receptors in the same cell can inhibit Notch activity in that cell; a process called cis-inhibition (Hori et al., 2013). In fact, recent data suggests that the relative expression levels of ligand and receptor in a cell define that cell’s function in the pathway, with a high ratio of ligand to receptor promoting signal-sending, while the reverse promotes signal-receiving states (LeBon et al., 2014; Sprinzak et al., 2010).
Notch signaling is further regulated by post-translational modifications, including glycosylation, which can modulate ligand-receptor interactions (Moloney et al., 2000; Panin et al., 1997; Rana and Haltiwanger, 2011). A critical glycosylation event that is required for Notch activity is the addition of O-linked fucose residues to specific extracellular Epidermal Growth Factor-like (EGF) repeats of Notch receptors by the enzyme POFUT1 (Okajima and Irvine, 2002; Sasamura et al., 2003; Shi and Stanley, 2003). Consensus sequences for POFUT1 activity have been defined as C2XXXX(S/T)C3 where C2 and C3 are the second and third conserved cysteines of the EGF repeat (Muller et al., 2014; Rana and Haltiwanger, 2011). These fucose moieties can be extended by addition of a GlcNAc by Fringe-family β3-N-acetylglucosaminyltransferases (Moloney et al., 2000; Rana and Haltiwanger, 2011). Three fringe proteins exist in mammals, Lunatic, Manic and Radical Fringe (LFNG, MFNG and RFNG) (Johnston et al., 1997). Only a subset of O-linked fucose residues are extended by FRINGEs, and the basis by which these EGF repeats are identified is not clear (Harvey et al., 2016; Kakuda and Haltiwanger, 2017). Many previous studies have demonstrated that LFNG glycosylation of the NOTCH1 receptor strengthens its interactions with Delta-like 1 (DLL1) both in trans and in cis (Hicks et al., 2000; Kato et al., 2010; LeBon et al., 2014; Xu et al., 2010; Yang et al., 2005).
Tight regulation of Notch activity is critical during vertebrate somitogenesis. This process involves the periodic formation of somites, which bud from the anterior region of an overtly undifferentiated tissue called the presomitic mesoderm (PSM). Somites are the embryonic precursors to the ribs, vertebrae, and striated muscle of the back (Benazeraf and Pourquie, 2013; Gossler and de Angelis, 1998). The somitogenesis process is regulated in part by a “segmentation clock”, which utilizes a network of oscillatory gene expression to time somite production (Resende et al., 2014; Wahi et al., 2016).
In mice the expression levels of Notch pathway genes, including Notch1, Dll1, and Lfng, as well as Notch activity levels as measured by NICD oscillate in the PSM with a period of approximately two hours, matching the rate of somite formation (Bone et al., 2014; Dequeant et al., 2006; Ozbudak and Pourquie, 2008). Loss or ubiquitous expression of either LFNG or DLL1 disrupts clock function (de Angelis et al., 1997; Evrard et al., 1998; Serth et al., 2003; Shimojo et al., 2016; Williams et al., 2016; Zhang et al., 2000), highlighting the importance of oscillatory expression in this system. In the context of the clock, it has been suggested that LFNG glycosylation acts to inhibit Notch activation in the PSM (Dale et al., 2003; Morimoto et al., 2005; Oginuma et al., 2010; Williams et al., 2016), which is inconsistent with many observations that LFNG modification enhances DLL1-mediated NOTCH1 trans-activation (Hicks et al., 2000; Kakuda and Haltiwanger, 2017; Yang et al., 2005). More recent work has suggested that in the PSM LFNG plays critical roles in production of synchronous, high-amplitude oscillations (Matsuda et al., 2020; Yoshioka-Kobayashi et al., 2020), and that LFNG can act in a signal-sending cell to reduce Notch activation in adjacent signal-receiving cells, suggesting an effect on ligand activity (Okubo et al., 2012). The molecular basis for this activity has not been defined.
The importance of protein interactions in cis in the clock is supported by the critical function of the divergent ligand Delta-like3 (Dll3) in mouse and human somitogenesis (Dunwoodie et al., 2002, 1997; Kusumi et al., 1998; Turnpenny et al., 2003). Most studies suggest that DLL3 functions solely via cis-inhibition, reducing Notch activity levels when expressed in the same cell with a Notch receptor, but unable to activate Notch in trans (Chapman et al., 2011; Ladi et al., 2005; Serth et al., 2015). Loss of Dll3 perturbs segmentation clock function and causes somite and skeletal phenotypes very similar to those observed after loss of Lfng (Evrard et al., 1998; Kusumi et al., 1998). This supports the model that DLL3 modulates Notch signaling in the clock, and that both glycosylation and cis-inhibition contribute to the integration of Notch pathway activity across time and space during somitogenesis.
Interestingly, many Notch ligands contain O-linked fucosylation consensus sequences suggesting they are substrates for POFUT1 and the FRINGE proteins. DLL1 can be O-fucosylated on EGF repeats 3, 4, 7, and 8 (Muller et al., 2014) and one or more of these fucose moieties can be extended by LFNG (Panin et al., 2002). Similarly, DLL3 is O-fucosylated on EGFs 2 and 5, and at least one of these EGF repeats is a substrate for LFNG (Serth et al., 2015). The functional relevance of O-fucose glycan modifications on ligands is unclear. In cell culture, both DLL1 and DLL3 are able to carry out their major biochemical functions in the absence of O-fucosylation (Muller et al., 2014; Serth et al., 2015). Despite this, O-fucosylation is necessary for the in vivo function of DLL3 (Serth et al., 2015).
Here we examine genetic interactions that link Notch O-fucosylation and cis-inhibition in the clock. We identify skeletal phenotypes and embryonic segmentation phenotypes suggesting that loss of Dll3 is epistatic to the loss of Lfng in the clock. Further, we show directly for the first time that LFNG can extend O-fucose on both EGF2 and EGF5 repeats in DLL3, as well as on EGFs 4, 7, and 8 in DLL1. Finally, we demonstrate that DLL3 expression can promote signal-sending activity in cells that co-express NOTCH1 and DLL1, and that this activity is abrogated by LFNG glycosylation, suggesting a mechanism for coordinated regulation of the segmentation clock by glycosylation and cis-inhibition.
Results
Loss of either Lfng or Dll3 lead to similar skeletal phenotypes, except in the sacral region.
The loss-of-function mutation phenotypes of Lfng (Evrard et al., 1998) and Dll3 (Kusumi et al., 1998) clearly demonstrate that both proteins are necessary for normal segmentation clock function (Sparrow et al., 2006; Turnpenny et al., 2003). Qualitative assessments of skeletal morphology in these mutants suggest that these defects are extremely similar, and that simultaneous loss of Lfng and Dll3 does not increase the severity of skeletal defects (Serth et al., 2015; Sewell et al., 2009; Zhang et al., 2002). This suggests that LFNG and DLL3 operate in overlapping pathways during somitogenesis. To extend previous observations, we quantified the differences in the skeletal phenotypes in Lfng or Dll3 mutants, as well as in double knockout mice with mutations at both loci. Loss of either Lfng or Dll3 leads to production of disorganized vertebrae, a truncated body axis, and numerous rib fusions and bifurcations (Fig. 1A). We quantified the number of rib defects and rib attachments to the sternum (Fig. 1B, Table 1), and although we observe high levels of mouse-to-mouse variability, no significant differences were observed between Lfng−/− and Dll3pu/pu skeletons. Further, simultaneous loss of both Lfng and Dll3 did not significantly increase the severity of skeletal defects in the thoracic region compared to either single mutation. Interestingly, while wild-type embryos have equal numbers of left and right rib attachments, each of the mutants had approximately one fewer attachment on the right side of the body axis, though the relevance of this finding is not clear (Table 1). Thus, our data support previous suggestions that in the thoracic region of the skeleton, the phenotypes that result from loss of Lfng are indistinguishable from those that result from loss of Dll3, and confirm that the simultaneous loss of Lfng and Dll3 does not have a synergistic effect during formation of the anterior skeleton.
Figure 1. Quantification of rib and vertebral defects indicates that while Lfng and Dll3 cooperate during skeletal patterning, some gene specific phenotypes exist.

(A) Alcian Blue/Alizarin Red skeletal preparations of 17.5 d.p.c. embryos. Dorsal ribs (a-d), ventral ribs (e-h) and dorsal views of the lumbar-sacral region (i-l) are shown. Rib fusions and bifurcations are observed in the Lfng−/− (b and f), Dll3pu/pu (c and g), and Lfng−/−; Dll3pu/pu (d and h) mutants. Normal sacral vertebral condensations (asterisks) are observed in wild-type (i) and Lfng−/− (j), while highly disorganized vertebrae are observed in the sacral regions of Dll3pu/pu (k) and Lfng−/−; Dll3pu/pu (l) mutants (lines). (B) Quantification of the total number of rib abnormalities in 17.5 and 18.5 d.p.c. embryos is represented as a box and whiskers plot. The average number of abnormalities is significantly different between wild-type and the mutant skeletons but does not vary among the three mutant phenotypes (see Table 1). (C) Quantification of normal sacral vertebrae in 17.5 and 18.5 d.p.c. embryos is shown as a box and whiskers plot. Significantly fewer normal sacral vertebral condensations are seen in Dll3pu/pu and Lfng−/−; Dll3pu/pu mutants compared to wild-type or Lfng−/− (see Table 1). Blue circles: wild-type, red squares: Lfng−/−; Dll3+/+, red circles: Lfng−/−; Dll3+/pu, green squares: Lfng+/+; Dll3pu/pu, green circles: Lfng+/−; Dll3pu/pu, pink circles: Lfng−/−; Dll3pu/pu. Embryos represent littermates to reduce concerns related to genetic background. * = P<0.001
Table 1.
Quantification and analysis of skeletal defects in Lfng−/−, Dll3pu/pu, and Lfng−/−;Dll3pu/pu mutant mice.
| # rib abnormalities | normal sacral vertebrae | Ribs on right | Ribs on left | |
|---|---|---|---|---|
|
| ||||
| Wild type | 0+/− 0.0 | 4 +/− 0.0 | 7.1 +/− 0.3 | 7.0 +/− 0.2 |
| (n=24) | ^ § ~ (<0.001) | § ~ (<0.001) |
^
~ (<0.001) § (<0/01) |
~ (<0.001) |
|
| ||||
| Lfng −/− | 10.9 +/− 3.0 | 3.6 +/− 0.5 | 5.7 +/− 0.6 | 6.7 +/− 0.8 |
| (n=17) | *(<0.001) | § ~ (<0.001) | *(<0.001) | ns |
|
| ||||
| Dll3pu/pu | 10.5 +/− 3.6 | 0.1 +/− 0.3 | 6.0 +/− 1.0 | 6.9 +/− 0.7 |
| (n=15) | *(<0.001) | *^ (<0.001) | *(<0.01) | ~ (<0.05) |
|
| ||||
| Dll3pu/pu; Lfng−/− | 9.3 +/− 1.5 | 0.0 +/= 0.0 | 5.4 +/− 0.8 | 6.2 +/− 0.6 |
| (n=12) | *(<0.001) | *^ (<0.001) | *(<0.001) |
*(<0.001) § (<0/05) |
17.5 and 18.5 d.p.c. embryos were harvested from intercrosses that could produce all four genotypic groups. Skeletal preparations were analyzed for defects as described. Numbers represent the average value +/− standard deviation. P-values <0.05 were considered to be significant.
(significantly different from wildtype)
(significantly different from Lfng−/−)
(significantly different from Dll3pu/pu)
(significantly different from Lfng−/−;Dll3pu/pu).
Numbers in parenthesis indicate P-value calculated by Kruskal-Wallis test using a Dunn’s post hoc test. The Lfng−/− group includes 13 embryos of genotype Lfng−/−;Dll3+/pu, and 4 of Lfng−/−;Dll3+/+. These are differentiated in the graphs shown in Fig. 1B and 1C demonstrating that the Lfng null phenotype is not enhanced by the loss of one copy of Dll3. Similarly, the Dll3pu/pu group includes 8 embryos of the genotype: Lfng+/−;Dll3pu/pu, and 7 of Lfng+/+; Dll3pu/pu. These are differentiated in the graphs in Fig. 1B and 1C demonstrating that the Dll3pu/pu phenotype is not enhanced by the loss of one copy of Lfng.
We and others have reported that although vertebrae in the lumbar region of Lfng−/− embryos are disorganized, these embryos produce several relatively normal vertebrae in the sacral region before production of an abnormal and truncated tail (Stauber et al., 2009; Williams et al., 2016, 2014). Here we observe that the sacral vertebrae of Dll3pu/pu mice were overtly abnormal, with most embryos producing no normal sacral vertebrae in contrast to Lfng−/− embryos, which produced 3–4 relatively normal sacral vertebrae (Fig. 1A compare panels j and k, quantified in 1C). When sacral vertebrae were examined in Lfng−/−; Dll3pu/pu double knockout skeletons, no embryos produced normal sacral vertebrae (Fig. 1A panel l, quantified in 1C). The differences in sacral vertebrae formation in these two mutants suggests that while LFNG and DLL3 likely cooperate in the regulation of somitogenesis, they may retain individual roles as well, perhaps specific to the transition from anterior skeletal formation to sacral and tail production.
Lfng and Dll3 affect Notch activity in the segmentation clock function in distinct ways.
Although the Lfng and Dll3 loss-of-function mutants appear to have very similar phenotypes in the adult and in somite patterning (Evrard et al., 1998; Kusumi et al., 1998; Serth et al., 2015; Sewell et al., 2009), the effects of loss of Dll3 and loss of Lfng on clock function have not been rigorously and directly compared. To compare clock function in the absence of Lfng and/or Dll3 we examined the expression profiles of activated NOTCH1 (NICD) in the PSMs of wild-type and mutant embryos (Fig. 2).
Figure 2. Loss of Lfng and loss of Dll3 have distinct effects on Notch activity in the clock.

(A) Whole mount IHC with an anti-NICD antibody (a-c) and expression profiles (d) in 10.5 d.p.c embryos reveal cyclic activation of NOTCH1 in the PSM of wild-type embryos. In Lfng−/− embryos NICD levels are dynamic in the posterior (e-f), but do not exhibit normal oscillations in expression profiles (g). In Dll3pu/pu embryos (h-j) NICD expression is confined to the anterior PSM. Occasional weak signals in the posterior PSM represent staining or probe trapping in cells at the end of the neural tube (compare h to i). The representative embryos shown are indicated by asterisks in the heat map expression comparisons. (B) Mutants with loss of both Dll3 and Lfng (DxL DKO) exhibit a faint band of NICD only in the anterior PSM. Since the level of NICD in the anterior is low, background signals are detected in the posterior in expression profiles. All embryos pictured in A and B were processed and developed in parallel. (C) In situ analysis for the Notch target Nrarp confirms that Notch target gene expression cycles in wild-type embryos (a-c), appears as a broad domain in Lfng null embryos (d-e), and is below levels of detection in Dll3pu/pu (e) and DKO embryos (f).
Notch pathway activation was detected via whole mount immunohistochemistry (IHC) using an antibody specific for the cleaved and active NICD protein. In wild-type embryos, as previously described (Dale et al., 2003; Niwa et al., 2011; Shifley et al., 2008), we observe a stripe of NICD in the anterior PSM and bands of differing width in the posterior PSM reflecting oscillatory Notch activation in the segmentation clock (Fig. 2A, a-c). We then examined distribution profiles of NICD in a large number of embryos by converting the localization of NICD in individual embryos to expression profile heat maps, which are then ordered to reflect the oscillatory expression pattern across time (frequently called a kymograph) (Bone et al., 2014; Nitanda et al., 2014). As expected, clear oscillation of NICD levels is observed in wild-type PSMs (Fig.2A, d). In contrast, in Lfng−/− embryos, a broad domain of NICD is observed in the PSM with no clear space between the anterior and posterior expression domains (Fig. 2A, e-f). Previous researchers have described NICD levels in Lfng null embryos as either static (Morimoto et al., 2005; Okubo et al., 2012; Shifley et al., 2008), or dynamic (Feller et al., 2008; Sewell et al., 2009). In our kymograph analysis, we observe NICD localization that is not overtly oscillatory but appears to remain dynamic, especially in the posterior PSM where the clock is active, while in the anterior somite patterning region, broad and diffuse NICD signal is observed (Fig. 2A, g).
In contrast, when Notch activation was examined in Dll3pu/pu embryos, we observed a strong reduction of NICD in the posterior PSM where the clock is active, although NICD can be detected in a single stripe in the anterior PSM where somite patterning is being initiated (Fig. 2A, h-j). The differences between Lfng−/− and Dll3pu/pu embryos persist even after extended detection of NICD (Supplemental Fig. 1), and thus are likely to reflect different patterns of Notch activation in the two mutant backgrounds, rather than changes in the absolute levels of pathway activity. Thus, the perturbation of the Notch signaling pathway is different in the absence of Lfng compared to the absence of Dll3, indicating that these proteins have distinct mechanistic functions in the clock.
Since the NICD phenotypes resulting from loss of Lfng and loss of Dll3 are distinct, we undertook epistasis analysis to examine the genetic interactions of Lfng and Dll3. When NICD expression was assessed in Lfng−/−;Dll3pu/pu double mutant embryos, the localization patterns of NICD were similar to those in the Dll3pu/pu embryos, with no NICD observed in the posterior PSM where the clock is active (Fig. 2B). In the anterior PSM, where pre-somites begin to be compartmentalized into anterior and posterior compartments, the level of NICD appears reduced in Lfng−/−;Dll3pu/pu double mutant embryos compared to Dll3pu/pu embryos, but in all double mutant embryos examined the localization of NICD expression is similar to that of the Dll3pu/pu mutants (Fig. 2B). These data support the idea that the loss of Dll3 is epistatic to loss of Lfng in the segmentation clock in the caudal PSM.
To confirm that the observed changes in NICD levels affect expression of Notch targets in the clock, we examined the expression of Nrarp, a direct target of Notch signaling in the PSM. As expected, we observe that Nrarp expression oscillates in wild-type embryos (Fig.2C a-c), but is expressed in a diffuse band throughout the PSM in Lfng−/− embryos (Fig.2C, d-e). In Dll3pu/pu embryos weak Nrarp expression is occasionally observed in the anterior PSM after long incubation for detection, but in Lfng−/−;Dll3pu/pu double mutants no Nrarp expression was observed after identical levels of signal development (n=6), confirming that NICD levels in the anterior PSM of Dll3pu/pu and double mutant embryos are lower than in wild-type embryos (Fig. 2C f-g).
The distinct outcomes from loss of Dll3 and loss of Lfng extended to the expression of additional Notch targets in the PSM. Expression of Hes5 is dynamic in wild-type PSMs with either one or two bands of expression observed (Fig. 3A, panels a-c). In Lfng−/− embryos dynamic expression is still observed, though the bands are broader and more diffuse than in wild-type embryos (Fig.3A, panels d,e). In contrast, in Dll3pu/pu embryos, Hes5 expression is not observed, even in the anterior PSM (Fig.3A, panel f).
Figure 3. Loss of Lfng and loss of Dll3 have distinct effects on multiple Notch targets.

(A) Whole mount RNA in situ analysis of Hes5 expression exhibits oscillatory expression in wild-type embryos (a-c), dynamic expression in Lfng null embryos (d-e) and undetectable expression in Dll3 null embryos (f). (B) Whole mount RNA in situ analysis of mature Hes7 mRNA expression demonstrates oscillatory expression in wild-type embryos (a-c), dynamic expression with broad, diffuse bands in Lfng null embryos (d-e) and a poosterior to anterior gradient of expression in the PSM in Dll3 null embryos (f). (C) Whole mount RNA in situ analysis of newly transcribed Hes7 mRNA using an intronic probe demonstrates oscillatory expression in wild-type embryos (a-c), dynamic expression with broad, diffuse bands in Lfng null embryos (d-e) and expression below the level of detections in Dll3 null embryos (f).
The expression patterns of Hes7 also are consistent with strong reductions in Notch pathway activity in Dll3pu/pu embryos. In wildtype embryos, we observe oscillatory expression of mature Hes7 transcripts, while in Lfng−/− embryos dynamic expression is observed, but with diffuse, broad bands as previously reported (Fig. 3B panels a-e, (Shifley et al., 2008)). In contrast, in Dll3pu/pu embryos, Hes7 transcripts appear as a gradient from posterior to anterior ((Fig. 3B, panel f), similar to the expression pattern observed when Notch signaling in the caudal PSM is inhibited by stable expression of Golgi-tethered LFNG (Williams et al., 2016). When we examine the expression of unspliced Hes7 transcripts using an intronic probe, we observe dynamic expression of immature Hes7 transcripts in wild-type and Lfng−/− embryos (Fig.3C, panels a-e). In contrast, only low levels of unspliced Hes7 transcripts are observed in the most caudal PSMs of Dll3pu/pu embryos (Fig. 3C panel f).This is similar to findings in other contexts where NICD levels are strongly inhibited (Williams et al., 2016), and has been interpreted to suggest that in the context of low Notch activity, Hes7 is transcribed in the caudal PSM, but the mature transcripts are stabilized and perdure in cells for several hours, appearing as a posterior to anterior gradient. Taken together, these results support a model where domains of Notch pathway activity are expanded in Lfng−/− embryos, while Notch pathway activity is strongly reduced in Dll3pu/pu embryos. These changes in pathway activation lead to reduced transcription of direct Notch targets like Nrarp, Hes5, and Hes7 in the PSM of Dll3pu/pu embryos, though mature Hes7 transcripts appear to be stabilized by an as-yet unknown mechanism when Notch activity is severely downregulated, as previously described (Williams et al., 2016)
The loss-of-function effects of Lfng and Dll3 do not arise due to changes in the levels of Notch signaling proteins.
One possible explanation for the different patterns of NICD and Notch pathway target gene expression in Lfng−/− and Dll3pu/pu mutants would be that loss of Lfng results in increased expression of NOTCH1 and/or DLL1 or that loss of Dll3 results in reduced expression of the ligand or receptor. To address these possibilities we examined the levels of Notch signaling proteins and Notch activity in the PSM of wild-type and mutant embryos. Initial analyses pooled four whole PSMs to address concerns of embryo-to-embryo variation in oscillatory proteins and activities. Multiple independent pools were run on the same blot and bands were quantified. We first demonstrated that we could recapitulate the reduction in Notch activity observed by wholemount IHC. Pools of PSMs were probed for S1-cleaved NOTCH1(p120) or NICD (using an NICD-specific antibody) and the ratio of NICD to NOTCH1(p120) was calculated (Fig. 4 A,B). In six independent pools of wild-type PSMs variability between different pools was small. The NICD:NOTCH1(p120) ratio in pooled Lfng−/− PSMs was not significantly different from wild-type. In pools of Dll3pu/pu embryos, NICD was detected, indicating that though Notch activity in the PSM is strongly downregulated, it is not absent. However the NICD:NOTCH1(p120) ratio was significantly reduced compared to that observed in wild-type or Lfng−/− embryos. Since NOTCH1(p120) and NICD were detected with different antibodies with different affinities, it is not possible to calculate the specific percentage of NOTCH1 that is cleaved in different backgrounds, but these data confirm that a smaller proportion of NOTCH1 protein is successfully activated in Dll3pu/pu mutant PSMs.
Figure 4. Changes in Notch activity in Lfng and Dll3 mutants are not directly caused by alterations in the levels of the signaling molecules.

Western blot analysis was performed on pooled tissue lysates from 4 whole PSMs or 4 caudal PSMs (posterior 2/3) In all western blots each lane represents a biologically independent pool that contains 4 genotyped PSMs taken from between 2 and 4 independent litters (n=6 independent wildype pools in 4A and n=3 independent pools in all other analyses). Relative protein levels were normalized to Tubulin expression for quantification. (A,B) Western blot analysis for NOTCH1(p120) or NICD on pooled whole PSMs. Quantification indicates that the protein levels of NOTCH1(p120) are significantly increased in Lfng−/− mutants, but unchanged in Dll3 mutants compared to wild-type. The ratio of NICD to NOTCH1(p120) demonstrates that Notch activation is significantly reduced in Dll3pu/pu PSMs compared to wild-type or Lfng−/− PSMs. (C,D) Western blot analysis for DLL1 on pooled whole PSMs. Quantification indicates that the protein levels of DLL are significantly increased in Dll3pu/pu mutants, but unchanged in Lfng−/− mutants compared to wild-type. Samples used in C and D are biologically independent from those used in A and B. (E,F) Western blot analysis for NOTCH1(p120) or NICD pooled posterior PSM. Quantification indicates that the protein levels of NOTCH1(p120) are not significantly different among the three genotypes. The ratio of NICD to NOTCH1(p120) demonstrates that Notch activation is significantly reduced in Dll3pu/pu posterior PSMs compared to wild-type or Lfng−/−. (G,H) Western blot analysis for DLL1 on pooled posterior PSM sample. Blots from E were stripped and re-probed. Quantification indicates that the protein levels of DLL1 are significantly increased in Dll3pu/pu posterior PSMs, but unchanged in Lfng−/− mutants compared to wild-type. (I) Semi-quantitative RT-PCR performed on pooled RNA isolated from the caudal half of 6 PSMs/lane confirms similar expression of Dll1 and Notch1 in three separate pools of wild-type, Lfng−/−, and Dll3pu/pu caudal PSM cDNA. Hprt was used as a control. (J) qRT-PCR analysis (n=3 biologically independent pools of PSMs of each genotype) confirms that the transcript levels of Dll and Notch1 are not altered in the mutants compared to wild-type. Statistical analysis throughout included one way ANOVA followed by Tukey post-hoc with p<0.05 indicating significance (*). Error bars indicate SD for Western blot analysis and propagated log SEM for qRT PCR analysis.
We then compared the overall levels of NOTCH1 and DLL1when comparing wild-type and mutant PSMs (normalized to tubulin). We find a significant increase in NOTCH1(p120) when comparing Lfng−/− to wild-type PSMs, though we do not observe statistically significant differences in NOTCH1(p120) levels when wildtype or Lfng−/− PSMs are compared to Dll3pu/pu PSMs (Fig. 4B). In contrast, when we quantify DLL1 protein we find that DLL1 levels are significantly higher in Dll3pu/pu PSMs than observed in wild-type or Lfng−/− (Fig. 4C, D).
Because of the role of Notch signaling in rostral/caudal presomite patterning, we were concerned that inclusion of anterior PSM cells in our tissue extracts might confound our ability to interpret the effects of loss of Dll3 or Lfng on clock function, thus we repeated these assays using pools of dissected PSMs containing only the posterior 2/3 of the PSM. Though it was difficult to detect NICD in these pools, we again observe a drastic reduction in the NICD:NOTCH1(p120) ratio in Dll3pu/pu PSMs (Fig. 4E,F). We additionally observe that in contrast to findings in the full PSM, in the caudal PSM we do not observe significant changes in NOTCH1(p120) protein levels in any of the three genotypes (Fig.4E,F). However, the observation of increased DLL1 levels in Dll3pu/pu full PSMs is replicated in posterior PSMs (Fig.4G,H). Taken together, these data confirm our findings that Notch activity is significantly reduced in Dll3pu/pu PSMs, especially in the caudal region where the clock is active. This reduction is not due to a change in the overall levels of signaling molecules because NOTCH1 levels are unchanged in Dll3 mutant PSMs, and the expression levels of the DLL1 ligand are actually increased in the Dll3 mutant background. While we observe a slight increase in NOTCH1 levels in Lfng mutant PSMs, this is only observed when the anterior PSM regions are included, suggesting that this change reflects altered NOTCH1 expression during pre-somite patterning.
Measurement of the levels of Notch1 and Dll1 RNA expression in the caudal PSM by RT-PCR indicates that levels of Notch1 and Dll1 are similar in Lfng−/−and Dll3pu/pu caudal PSMs, suggesting that the increases in DLL1 protein levels in Dll3pu/pu PSMs do not result from changes in transcription (Fig. I,J). Taken together, our data do not support a model where the loss of Lfng and/or Dll3 affect Notch signaling in the PSM via alterations in the RNA or protein expression levels of the ligand or receptor: thus, the loss of NICD in Dll3 null mice must occur downstream of the production of ligand and receptor proteins.
EGF repeats 2 and 5 of DLL3 are direct targets of LFNG glycosylation.
One way that LFNG and DLL3 might cooperate during somite formation would be if LFNG-mediated glycosylation of DLL3 was required for clock function. The DLL3 ligand contains two EGF repeats with potential sites for modification by POFUT1: EGF2 (S290, consensus sequence C2ANGGSC3) and EGF5 (T407, consensus sequence C2ANGGTC3) (Fig.5A). We confirmed O-linked fucosylation of these sites, using a fucose analog (6-alkynyl fucose or 6AF) that is biologically active and can be specifically and covalently tagged with biotin through “Click Chemistry” (Al-Shareffi et al., 2013). When EGF repeats 2–5 of DLL3 are expressed in HEK293 cells (which express endogenous POFUT1) we observe incorporation of 6AF into the expressed protein (Fig.5B). Mutation of either the modified serine of EGF2 or threonine of EGF5 to alanine still permits incorporation of fucose into the protein (Fig. 5B), but when both residues are mutated to alanine, (DLL3 S290A/T407A) the resulting protein does not incorporate 6AF, confirming the presence of O-linked fucose on both EGF repeats 2 and 5 (Fig. 5B). These observations reinforce published work that used tritiated fucose to produce similar results (Serth et al., 2015).
Figure 5. Select EGF repeats of DLL3 and DLL1 are targets for extension by LFNG.

(A) Schematic representation of the DLL3 protein extracellular domain (DLL3 ECD), (labeled boxes indicate protein domains including EGF-like repeats 1–6). O-fucosylation consensus sequences and point mutations are indicated for EGF repeats 2 and 5. (B) Immunoblot analysis and click chemistry of secreted protein from HEK293 cells expressing indicated pSecTag-Dll3 constructs cultured in the presence of 6AF. Anti-Myc signal (top) detects protein and Streptavidin (bottom) detects incorporated fucose. Light gray spots denote signal saturation, which does not alter the interpretation of the data. (C) Mass spectra for the peptide from EGF repeat 2 of DLL3 produced in the absence of LFNG. Top panel, MS spectra, where red diamond shows ion chosen for fragmentation (parent ion). The m/z of this ion matches the mass of the peptide from EGF2 (shown at top) modified with O-fucose. Other ions in the MS spectra are from co-eluting material. Bottom panel shows MS2 spectra resulting from fragmentation of parent ions. Blue diamonds in MS2 spectra indicate the position of the parent ion. The major product ion corresponds to the m/z of the peptide without fucose. Several y-ions confirming the identity of the peptide are also shown. (D) Mass spectra for the peptide from EGF repeat 2 of DLL3 produced in the presence of LFNG. Annotated as in panel C. Red triangle, Fucose; blue square, GlcNAc; yellow circle, Galactose; purple diamond, Sialic acid. Spectra for EGF 5 are found in Supplemental Figure S2A. (E) Extracted Ion Chromatographs (EIC) for the peptides containing the O-fucose consensus sequences from DLL3 EGF 2 (right) and EGF 5 (left) were generated to evaluate the relative amounts of each glycoform present in each sample in the absence or presence of LFNG. Code for each glycan shown across the bottom with black= naked peptide, red = O-linked fucose monosaccharide glycoform; blue=disaccharide glycoform; green=tri-saccharide glycoform; and pink=tetra-saccharide glycoform. Key for the masses used to generate the EICs is shown for EGF2. Those for EGF5 are shown in Fig. S2A. LFNG is able to add GlcNAc to almost all of O-fucose on the peptides, and most O-fucose is then extended to the tri- or tetra-saccharide. (F) Schematic representation of the DLL1 protein extracellular domain (DLL1 ECD), with labeled boxes indicating protein domains including EGF-like repeats 1–8 (1–8). The O-fucosylation consensus sequence C2XXXX(S/T)C3 is indicated (orange) for EGF repeats 3, 4, 7, and 8, while the non-fucosylated C2XXX(S/T)C3 sequence in EGF2 is indicted by red coloration. (G) Extracted Ion Chromatographs (EIC) for DLL1 EGFs 3, 4, 7, and 8 evaluate the relative amounts of each glycoform present in each sample in the absence (left) and presence (right) of LFNG. Spectra can be found in Supplemental Figure S2. (H) Consensus schematic indicating the most prevalent glycosylation forms of DLL1 and DLL3 in the presence of LFNG. Red rectangles are EGF repeats with O-fucose consensus sequences. Glycan code as described in D.
Previous work indicates that at least one of the O-linked fucose moieties on DLL3 can be extended by LFNG (Serth et al., 2015). To confirm and extend this observation, we assessed glycan status on DLL3 by mass spectrometry. We expressed and purified DLL3 EGF2-5 from HEK293 cells (which exhibit no endogenous fringe activity (Kakuda and Haltiwanger, 2017)) in the presence or absence of LFNG expression. Peptides were generated via in-gel tryptic or V8 digestion, and analyzed by nano-LC-MS/MS to identify their glycosylation states (Kakuda and Haltiwanger, 2017). In the absence of LFNG expression, the major glycoform of peptides containing the O-fucose consensus sequence from EGF2 or EGF5 is the fucose monosaccharide (Fig.5C–E and S2A), confirming that these sites are efficiently modified with O-fucose. In the presence of LFNG, the major glycoform on both peptides is the tetrasaccharide, indicating that O-fucose in both EGFs is efficiently modified by LFNG and subsequently extended by the endogenous β1,4-galactosyltransferase and α2,6-sialyltransferase enzymes expressed in these cells (Fig.5D,E and S2A). These results confirm that both EGF2 and EGF5 of DLL3 are robust targets of POFUT1 and of LFNG, and the Extracted Ion Chromatogram (EIC) analysis (Fig. 5E) indicates that the major glycoform on both in the presence of LFNG is the tetrasaccharide.
LFNG extends specific O-fucose residues on DLL1
The relevant trans-activating ligand in the context of the segmentation clock is DLL1. Previous work has demonstrated that DLL1 is fucosylated on EGF3 (consensus sequence C2RNGATC3), EGF4 (consensus sequence C2KNGASC3), EGF7 (consensus sequence C2ANGGTC3), and EGF8 (consensus sequence C2HNGATC3) (Fig. 5F), and that at least one of these EGF repeats is a substrate for extension by LFNG (Muller et al., 2014; Panin et al., 2002). To examine LFNG modification of DLL1, the extracellular domain of the ligand was expressed in HEK293 cells, purified from the culture medium, and analyzed by nano-LC-MS/MS as described above. In the presence of LFNG, EGF repeats 4, 7, and 8 are predominantly elongated to the tri-saccharide glycan, confirming extension of the O-linked fucose on these repeats by LFNG (Fig. 5G, and Fig. S2B–F), though varying amounts of mono-, di-, and tetra-saccharide glycans are also detected, suggesting more variable glycosylation states for DLL1 than for DLL3. In contrast, the fucose residue on DLL1 EGF repeat 3 was not extended by LFNG (Fig. 5G, and Fig. S2C). Thus, our results map for the first time specific sites of LFNG modification on Notch ligands DLL1 and DLL3 (Fig 5H), and demonstrate that, as seen in Notch receptor glycosylation, LFNG only modifies O-fucose on a subset of EGF repeats (Kakuda and Haltiwanger, 2017).
DLL3 expression in cells co-expressing NOTCH1 and DLL1 increases their signal sending activity, but this effect is inhibited by LFNG.
Several lines of evidence suggest that DLL3 influences signal sending ligands including findings that LFNG can inhibit Notch activity in trans in a DLL3-dependent mechanism (Okubo et al., 2012) and findings that DLL3 can relocalize DLL1 to intracellular puncta in cultured cells (Serth et al., 2015). Given the oscillatory expression of Notch1 and Dll1 in the mouse PSM, and the fact that mouse phenotypes represent the outcome of complete, long-term loss of function, the effects of alterations in DLL3 and LFNG on Notch signaling in the PSM are difficult to interpret. To better understand the effects of DLL3 and LFNG activity on Notch protein expression and activation, we generated stable HEK293 Flp-In TREx cell lines that robustly express endogenous NOTCH1 and contain a doxycycline inducible HA-tagged DLL3 cassette. We subsequently produced derivative cell lines that additionally express stable Cerulean-tagged DLL1 protein (Fig.6A). To examine the effects of DLL3 expression on DLL1-dependent trans-activation of NOTCH1, we used these cells as signal sending cells in co-culture assays with NIH3T3 cells transiently transfected with NOTCH1 expression constructs and a Notch-responsive luciferase reporter. We found that the DLL1 expressing line does not significantly increase NOTCH activation in signal receiving cells when compared to the original HEK293 Flp-in TREx cell line. However, after treatment with doxycycline to induce DLL3 expression, the DLL1 expressing cells exhibit a 3-fold increase in trans-activation ability (Fig. 6B). This effect is inhibited by simultaneous expression of LFNG in the signal sending cells, consistent with a role for DLL3 in promoting signal sending activity in some contexts, and with a reported role for LFNG in trans-inhibition of Notch signaling.
Figure 6. Expression of DLL3 alters NOTCH1 protein levels and signal sending activity in cells that also express DLL1.

(A) Cell lines were produced in HEK293 Flp-in TRex cells that express endogenous NOTCH1, stable DLL1-Cerulean, and Doxycycline inducible DLL3-HA. Western blot analysis confirms expected expression patterns in the parental cell line and two independent DLL1/DLL3 cell lines. The levels of NOTCH1(p120) are reduced when DLL3 is induced in the DLL1/DLL3 cell lines. (B) Luciferase co-culture assays were performed using HEX293 TREx parental cells or a cell line with inducible DLL3 and stable DLL1 expression as signal sending cells and NIH3T3 cells transfected with NOTCH1, a Notch-responsive Luciferase reporter and a Renilla transfection control as signal receiving cells. Doxycycline was added to induce DLL3 expression, and an LFNG-HA expression vector was introduced into signal sending cells by transient transfection as indicated. Fold activation of luciferase by DLL1/DLL3 cells compared to parental HEK TRex cells was calculated after normalization to Renilla expression. Despite robust expression of DLL1, DLL1/DLL3 cells do not induce significant Notch pathway activity in receiving cells. Induction of DLL3 in these cells significantly increases their signal-sending ability approximately 3 fold. Expression of LFNG abrogates this effect. In A and B, separate blots were used to quantify DLL1-Cer, NOTCH1 (p120) and DLL3-HA or LFNG-HA. Tubulin signals for each representative gel are shown beneath the experimental panel and these tubulin values were used for normalization (n=4). (C,D) Cell lines with inducible DLL3 (iDLL3) or inducible DLL3 and stable DLL1 (iDLL3/DLL1) were grown in the presence or absence of doxycycline and with or without transfection of an LFNG-HA expression vector. Levels of NOTCH1(p120) are significantly reduced in DLL3 expressing cells only if they also express DLL1, and this is confirmed by quantification of multiple biologically independent experiments (n=7 for all conditions except n= 6 +DLL1 and DLL3 and LFNG, where one value was excluded due to a gel abnormality). (E,F) iDLL3/DLL1 cells were grown in the presence or absence of doxycycline and the levels of NOTCH1(p300) and NOTCH1(p120) were assessed. By western blot quantification, NOTCH1(p120) is significantly reduced in the presence of DLL3, while the levels of NOTCH1(p300) are unaffected (n=3). (G,H) iDLL3/DLL1 cells were grown in the presence or absence of doxycycline (to induce DLL3 expression) and in the presence or absence of DAPT (to block Notch activation) and the levels of NOTCH1(p120) were assessed. By western blot quantification, NOTCH1(p120) is significantly reduced in the presence of DLL3, and this effect is abrogated in the presence of DAPT (n=3). Statistical analysis throughout included one way ANOVA followed by Tukey post-hoc with p<0.05 indicating significance (*). Each symbol represents an independent experiment, and NOTCH(p120) values were set to one for each cell line in the “- Doxycycline” condition for comparison across blots. (I) Immunofluorescence on unpermeabilized cells was used to assess cell surface presentation of DLL1. Parental cells (HEK TRex, panel a) or iDLL3/DLL1 cells grown in the absence (panel b) or presence (panel c) of doxycycline were incubated with DLL1 antibodies specific to the DLL1-ECD. Cell surface DLL1 signal is brighter in isolated cells that co-express DLL1 and DLL3. Brightness levels in panels a and b were increased to demonstrate background fluorescence levels. (J) Fluorescence levels were quantified in isolated cells (to reduce concerns about ligand internalization after signaling) and show that cell-surface levels of DLL1 are significantly higher in cells that co-express DLL1 and DLL3. Each symbol represents an individual cell (n= 38 HEK TRex parental cells, n=35 iDLL3/DLL1 cells without doxycycline, n=24 iDLL3/DLL1 cells with doxycycline), and the mean value +/− SD is shown.
DLL3 expression in cells co-expressing NOTCH1 and DLL1 causes a reduction in NOTCH1 protein levels that is dependent on active Notch pathway signaling.
In western blot analysis of cells expressing endogenous NOTCH1 and stable DLL1-Cerulean, we noted that doxycycline-induced expression of DLL3 led to a decrease in endogenous NOTCH1 protein levels in several independent lines of cells expressing DLL1 (Fig. 6A). To quantify these effects we examined NOTCH1(p120) protein levels in the presence and absence of DLL3 in cells either with or without DLL1 expression. We observe a strong and significant reduction in endogenous NOTCH1 when DLL3 expression is induced in cells that also express DLL1, but this reduction is not observed in cells that do not express DLL1 (Fig.6 C,D). To examine whether LFNG expression affected this outcome, cells were transiently transfected with an LFNG expression construct, but no significant LFNG-dependent changes in NOTCH1 protein levels were identified (Fig. 6 C,D). The antibody used in this experiment can detect both the S1-cleaved NOTCH1(p120) and a p300 isoform that has not been cleaved by furin proteases in the Golgi. Using Western blot conditions that allow detection of both p300 and p120 NOTCH1, we observed that the DLL1/DLL3 dependent reduction in NOTCH is specific to the p120 fragment, supporting the idea that this loss is post-translational (Fig. 6 E,F).
One possible explanation for the reduction in NOTCH1 only in cells co-expressing DLL1 and DLL3 would be that increases in trans-activation potential as described in Fig. 6B lead to NOTCH1 turnover due to increased pathway activation in the cell culture pool. To test for this, we repeated these experiments in the presence of DAPT, preventing NOTCH1 S3 cleavage in response to trans-activation. DAPT treatment prevents the reduction of NOTCH1 when DLL3 expression is activated (Fig. 6 G,H), thus the reduction in NOTCH1 protein is likely to be a result of increased NOTCH pathway activation in the cellular pool after DLL3 expression.
Expression of DLL3 in cells that co-express DLL1 and NOTCH1 promotes increased cell surface presentation of DLL1.
Taken together these data are consistent with a model that expression of DLL3 in cells that co-express DLL1 and NOTCH1 promotes the presentation of DLL1 on the cell surface, increasing the signal-sending ability of these cells. To address this question, we examined the levels of DLL1 on the surface of unpermeabilized cells, using an antibody specific for the extracellular domain of DLL1. Fluorescence levels were quantified in individual, isolated cells to abrogate concerns regarding ligand internalization into signal sending cells following Notch signaling. We found that the DLL1 expressing line does not exhibit significantly higher levels of DLL1 on the cell surface when compared to the original HEK293 Flp-in TREx cell line, consistent with the prior observation that these cells have similar signal sending activity (Fig. 6I,J). However, after treatment with doxycycline to induce DLL3 expression, the DLL1 expressing cells exhibit a significant increase in DLL1 on the cell surface, which appears as a characteristic punctate pattern (Kawaguchi et al., 2013; Koo et al., 2005) supporting the model that DLL3 expression promotes DLL1 presentation on the cell surface in this context.
Discussion
Both Lfng and Dll3 are required for normal segmentation clock function and somitogenesis in mice. The observation that the loss of function of either or both genes leads to similar skeletal defects suggests that these proteins cooperate during mouse segmentation. To better appreciate the genetic interactions of Lfng and Dll3 in somitogenesis, we quantified the differences in the rib and vertebrae deformities of loss of function embryos. In the thoracic region our data supports the idea that LFNG and DLL3 act in a single pathway during somitogenesis with both single mutants and the double knockout exhibiting indistinguishable phenotypes as suggested previously (Serth et al., 2015).
Our observation that the sacral vertebrae of Dll3 mutant embryos are more severely affected than those of Lfng mutants draws attention to a previously unappreciated distinction in the two phenotypes. We and others have observed that Lfng null mice produce 2–4 relatively normal sacral vertebrae (Shifley et al., 2008; Stauber et al., 2009; Williams et al., 2016). The biological basis for this temporary restoration of more normal skeletal morphology is not known, but may be related to the switch from primary to secondary body formation, which occurs at the lumbar-sacral junction (Holmdahl, 1925; Wilson and Beddington, 1996). During this transition, the tailbud is formed, and during subsequent tail production, the PSM is populated largely by cells arising in the tailbud, rather than cells involuting through the primitive steak. Data from our work and others indicates that, in contrast to the thoracic and lumbar skeleton, formation of the skeletal elements caudal to the anus can be relatively normal in the presence of weak oscillations of Lfng (Williams et al., 2014) or hypomorphic HES7 activity (Stauber et al., 2009). The finding of relatively normal sacral formation even in the complete absence of Lfng remains unexplained. It is interesting to note that several Notch mutants form the first 7–9 somites relatively normally (Huppert et al., 2005; Oka et al., 1995; van Eeden et al., 1996). This may be due to gradual loss of synchronous Hes/her oscillation in the absence of Notch-based cell-cell coupling of the clock (Jiang et al., 2000). It is interesting to speculate that the shift to secondary body formation might represent a chance to “reset” synchronous oscillations, and that in the absence of Lfng expression, it again takes several cycles of the clock for synchrony to be sufficiently perturbed to disrupt somite patterning and vertebral formation.
It is clear that some aspect of Notch signaling or clock function is required for the normal development of the sacral skeleton and for production of the caudal tail skeleton. Embryos with loss of Hes7 (Bessho et al., 2001) or Dll3 (Fig. 1) or strong Dll1 hypomorphic mutations (Schuster-Gossler et al., 2016) exhibit abnormal sacral vertebrae and tail truncation. Thus, these proteins may play a functional role in the transition between primary and secondary body formation, while LFNG activity is dispensable for this stage. A careful comparison of the tailbud region and the cells of the chordoneural hinge, which are suggested to contain stem-like cells that contribute to the caudal mesoderm and neural tube (Cambray and Wilson, 2002), may provide hints about the mechanisms that underlie the differential requirement for Dll3 and Lfng in the sacrum.
When we focus on Notch activity in the segmentation clock, we observe that the pattern of Notch activation and the expression of Notch targets are altered differently in Lfng and Dll3 mutants. The fact that the loss of Dll3 appears to be epistatic to the loss Lfng in the clock supports the idea that the two work together in the PSM to coordinate oscillatory Notch activation, and that LFNG requires DLL3 for its function. Given that DLL3 has been described as an inhibitory Notch ligand, the strong reduction in NICD in Dll3pu/pu PSMs was surprising. When we examined the expression of NOTCH1 and DLL1 quantitatively, we find that the changes in Notch activity in the mutants are not consistent with the changes in expression of the signaling proteins. The observation of decreased Notch activation but increased DLL1 levels in Dll3 mutant embryos suggests that the loss of Dll3 is affecting Notch signaling by altering the activity or cell surface presentation of the ligand or receptor. Taken altogether, these observations, along with the epistasis analysis of Dll3 and Lfng, suggest that the two are working together to influence ligand activity at the cell surface. It has been shown that Lfng can function in a sending cell to inhibit Notch activation in a receiving cell, however the mechanism underlying this phenomenon is unclear (Okubo et al., 2012). This trans-inhibition of Notch signaling may be a mechanism to help maintain synchronized oscillations of clock genes in the posterior PSM, and suggests that LFNG can somehow influence ligand activity or presentation. Indeed, consistent with this idea, recent work has revealed that Radical fringe influences the surface presentation of DLL1 and DLL4 in the Paneth cells of the intestinal crypt (Kadur Lakshminarasimha Murthy et al., 2018).
Our finding that LFNG can modify the extracellular domains of both DLL1 and DLL3 could provide a mechanism for LFNG to modulate the signal-sending ability of cells in the PSM. Both DLL1 and NOTCH1 exhibit oscillatory expression in the PSM (Bone et al., 2014; Shimojo et al., 2016), and it is possible that the coordinated activity of LFNG and DLL3 fine-tunes the availability of DLL1 to interact in trans with NOTCH1, providing increased synchrony of Notch activity between neighboring cells in the PSM. The findings that LFNG can modulate DLL3 cis- inhibition of NOTCH1 (Ladi et al., 2005), and that unglycosylatable DLL3 does not relocalize DLL1 in tissue culture cells (Serth et al., 2015) may offer hints to the regulatory mechanisms underlying these interactions.
To examine possible mechanistic interactions of Lfng and Dll3 that might be relevant in the segmentation clock, we provide direct and specific evidence that the Notch ligand DLL3 is glycosylated by LFNG at two predicted O-fucosylation sites. This modification is robust, and in the presence of LFNG, the predominant form of DLL3 contains tetrasaccharide glycans on EGF repeats 2 and 5 (Fig. 4C). The glycosylation of DLL1 is more nuanced. On DLL1 the O-linked fucose moieties on EGFs 4, 7, and 8 are extended by LFNG, but the site in EGF 3 is not. In the presence of LFNG, the predominant form of DLL1 contains tri-saccharides at EGFs 4, 7, and 8 (Fig. 4C).
Our findings reinforce reports that the presence and specific sequence of a fucosylation consensus sequence cannot accurately predict extension by fringe proteins (Harvey et al., 2016; Kakuda and Haltiwanger, 2017). It has been suggested that the determinant of robust LFNG modification may be structural rather than sequence based. For instance, some of the most efficiently extended EGFs in the Drosophila Notch receptor were adjacent to well conserved non-calcium binding EGFs, perhaps indicating that local protein flexibility may influence glycosylation (Harvey et al., 2016). However, the pattern of calcium and non-calcium binding EGF repeats in DLL1 does not suggest an obvious correlation between protein rigidity and glycosylation efficiency in this context. Prior work on Fringe modification on EGF repeats from coagulation factors 7 and 9 suggest that individual EGF repeats contain the information necessary to direct or inhibit modification by Fringe (Rampal et al., 2005). Future experiments will be required to determine how these EGF repeats are selected for glycosylation, if there is a functional requirement for ligand glycosylation by LFNG, and what role that glycosylation requirement could play in the segmentation clock.
Examining the mechanistic functions of LFNG and DLL3 in somitogenesis is difficult due to the spatial and temporal complexity of segmentation clock regulation. At the tissue level, cells in the PSM express an activating ligand (DLL1) and receptor (NOTCH1) and an inhibitory ligand (DLL3). Notch1 and Dll1 expression in the PSM oscillate out of phase (Bone et al., 2014), which could provide a mechanism to temporally separate cell surface presentation of NOTCH1 and DLL1 allowing periodic activation of Notch signaling. However, there are significant periods of times where the two proteins are co-expressed in cells, and might be anticipated to cis-inhibit one another, reducing the amount of signaling ligand and receptor that are functional at the cell surface (Fig. 7). Further, non-oscillatory expression of Dll3 suggests the constant presence of a ligand that can inhibit Notch activation. We propose that LFNG and/or DLL3 might function to block the NOTCH1:DLL1 interaction, increasing cell surface presentation of the receptor or ligand and promoting robust, synchronized Notch activation. To further examine this model we developed cell lines that co-express NOTCH1 and DLL1 with inducible expression of DLL3. Data from our cell lines suggest that DLL3 can promote DLL1 cell surface presentation and subsequent signal sending activity in a cell that co-expresses DLL1 and NOTCH1, consistent with it playing a role to either decoy NOTCH1 from binding DLL1 in cis, permitting robust delivery of DLL1 to the surface, or with it playing a role as a co-ligand for DLL1, promoting its signal sending activity. Further, the loss of this effect in the presence of LFNG suggests that this function of DLL3 is modulated by the glycosylation of Notch pathway receptors and/or ligands. Our data can not determine which specific LFNG-mediated glycosylation events might influence protein interactions among NOTCH1, DLL1, and DLL3 in cis, and these questions will likely need to be addressed via mutation of glycosylation consensus sequences in vivo.
Figure 7.
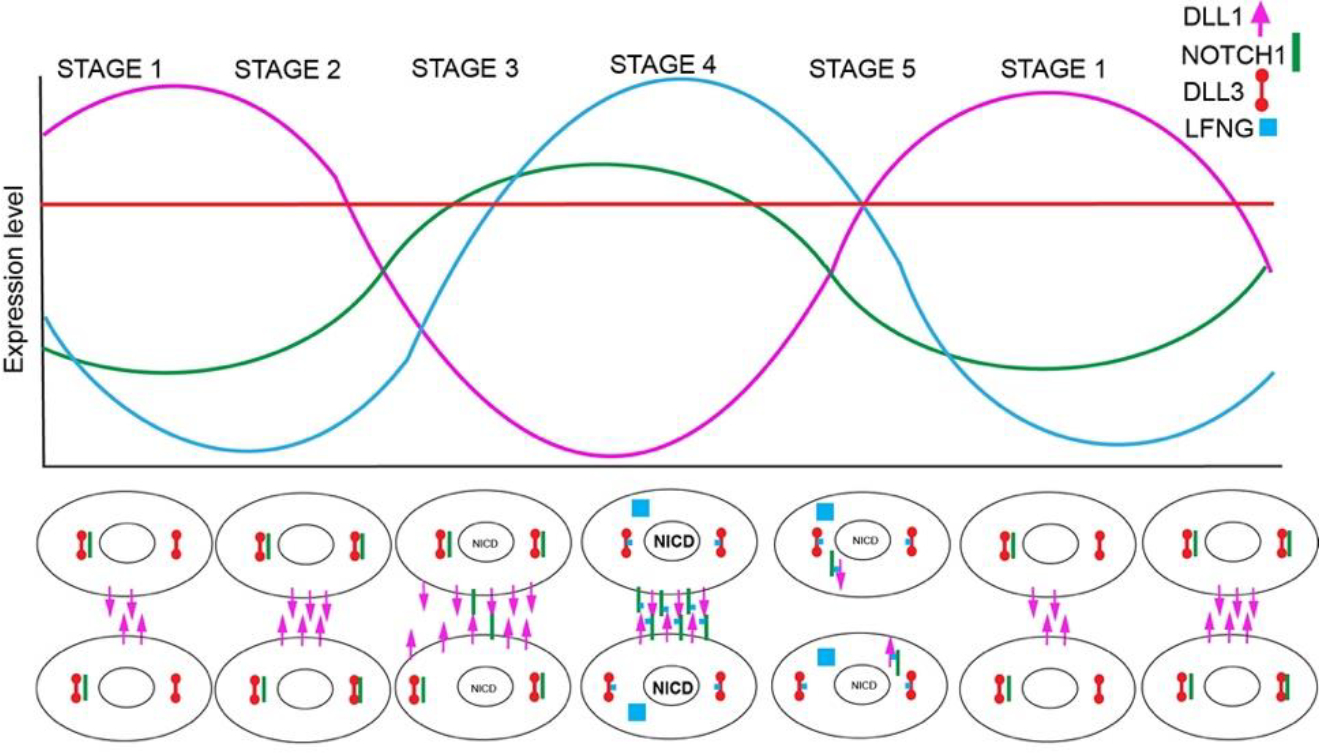
Schematic of clock coordination by LFNG and DLL3. At the top a schematic of RNA expression levels of critical clock components. Dll1 (pink) and Notch1 (green) oscillate out of phase. Lfng (blue) transcription is triggered by NOTCH1 activation and thus Lfng oscillates in phase with Notch but is slightly delayed. Dll3 expression levels (red) do not appreciably change over time. At the bottom, schematics of neighboring cells and proposed protein expression. Details in text.
Taken together our data are consistent with a model where oscillatory expression of LFNG cyclically alters the function of DLL3, such that during some phases of the oscillation DLL3 promotes DLL1 trans-activation activity while at others it does not, dependent on the glycosylation status of the ligands and/or receptors (Fig. 7). This coordination of glycosylation and protein interactions in cis could increase the amplitude of NICD oscillations, promoting synchronous clock function in the PSM as suggested by others (Matsuda et al., 2020; Yoshioka-Kobayashi et al., 2020). In the absence of DLL3, cis-interactions between DLL1 and NOTCH1 would interfere with the ability of both the ligand and receptor to participate in trans-activation, consistent with the reduction in NICD observed in Dll3 mutant embryos despite the robust expression of both NOTCH1 and DLL1. This model is consistent with several previous observations in the literature. These include the finding that LFNG expression inhibits NOTCH1:DLL3 interactions in cis (Ladi et al., 2005), and findings that DLL3 glycosylation is required for its in vivo functions in the PSM (Serth et al., 2015). The observation that wild-type DLL3 can relocalize DLL1 into intracellular puncta, and that this ability is lost in unglycosylatable DLL3 is also consistent with our model.
In this model, oscillatory expression of LFNG would lead to periodic glycosylation of NOTCH ligands and the receptor at specific stages of the clock (Fig. 7). During stage 1 DLL1 expression is high and NOTCH1 expression is low. NOTCH1 binds to DLL3 allowing DLL1 protein to be presented on the cell surface. While all cells in a region could potentially act to send signal, they are unable to receive signal. In stage 2 additional DLL1 is trafficked to the cell surface, and as NOTCH1 expression rises, more NOTCH1:DLL3 complexes are formed. During stage 3, as NOTCH1 levels continue to increase, some NOTCH1 receptor escapes to the cell surface where it is activated by DLL1 that was presented on neighboring cells during Stages 1 and 2. This creates a small amount of NICD that activates production of LFNG. During Stage 4 LFNG glycosylates newly expressed NOTCH components. This prevents newly translated NOTCH1 from being bound to DLL3, and the receptor traffics to the cell surface where it is efficiently transactivated by remaining DLL1 from Stages 1 and 2, producing high levels of NICD. In stage 5, production of NOTCH1 falls and production of DLL1 begins to rise. Residual LFNG glycosylates pathway components, promoting strong cis-inhibitory interactions between NOTCH1 and DLL1, preventing transactivation and leading to a reduction in NICD and a reduction in LFNG expression. As the expression level of NOTCH1 continues to fall and DLL1 expression begins to rise, the clock cycle is re-initiated. Hes7 is a central driver of the mammalian clock, and is expressed in response to Notch activation (stages 2–4 above), and subsequently acts to inhibit its own transcription and that of Lfng, reinforcing the reduction of LFNG activity during “stage 5” above. This links the coordinated activation of Notch signaling to high-amplitude cycles of HES7 expression which in turn influence Notch activity modulation via repression of Lfng expression. This model could explain how LFNG can trans-inhibit Notch signaling, but our data do not address which components require glycosylation. Future analyses of the interactions between Notch ligands and receptors may shed light on this question.
Finally, our data raise interesting questions about the evolutionary conservation of the segmentation clock. In mammals, we propose that stable expression of DLL3 and oscillatory expression of LFNG coordinates periodic changes in the function of DLL3 that play a role in synchronization of the clock. However, many organisms, including zebrafish (Prince et al., 2001) and anole (Eckalbar et al., 2012) do not appear to exhibit oscillations of Lfng expression in the PSM at all. In this context, it is interesting to note that in those species, the expression of the ortholog of Dll3 (Dlc in zebrafish (Holley et al., 2002) or X-Delta-2 in Xenopus (Jen et al., 1999)) is, in fact, oscillatory. This raises the intriguing possibility that oscillations of a cell autonomous, cis activity of a DLL3/Dlc protein is required for synchronized clock function in the PSM. Identification of a DLL3 ortholog in avian species which exhibit oscillatory LFNG expression similar to mammals, would shed light on this evolutionary question.
Methods
Mouse care and genotyping
Mice carrying LfngtmRjo1 (Evrard et al., 1998) and Dll3pu (Kusumi et al., 1998) alleles were intercrossed and maintained on a mixed C57/Bl6J × 129/Sv × FVB/J background, under supervision of the Ohio State University Institutional Animal Care and Use Committee, and in accordance with AVMA regulations and the Public Health Service Policy on Humane Care and Use of Laboratory Animals. To minimize background effects, embryo analyses were performed on littermates collected from crosses of Dll3+/pu;Lfng+/− × Dll3+/pu;Lfng+/− or Dll3+/pu;Lfng+/− × Dll3pu/pu;Lfng+/−. Genomic DNA was prepared from tissue fragments via proteinase K salt-out or from yolk sac fragments via the HOTSHOT procedure (Truett et al., 2000). PCR-based genotyping for LfngtmRjo1 used primers 5’-GAGCACCAGGAGACAAGCC, 5’-AGAGTTCCTGAAGCGAGAG and 5’-CTTGTGTAGCGCCAAGTGC amplifying a 170 bp wild-type product and a 200 bp mutant product. Dll3pu genotyping used primers 5’-GCCTCTTCTTCAGGGTCTGC and 5’-ACTCACCGGCCAAGCATC followed by digestion with HaeIII resulting in a 103 bp wild-type band or 175 bp mutant band, after digestion with HaeIII. Lack of amplification by primers 5’-CCTCTCTGTCCCAGGCACT and 5’-GCACACGTACGAGGCCAT which can amplify only a 276 bp wild-type band were used to confirm the genotype of Dll3pu/pu embryos.
Wholemount in situ Hybridization and Immunohistochemistry
Embryos were collected at 10.5 d.p.c. from timed pregnancies, designating noon of the day of plug detection as 0.5 d.p.c. RNA in situ hybridization was performed on embryos essentially as described (Williams et al., 2014) with Nrarp, Hes7, and Hes7 intron (Shifley et al., 2008), and Hes5 (Akazawa et al., 1992) mRNA probes. NICD immunohistochemistry was performed using a monoclonal rabbit anti- Cleaved Notch1 (Val1744) antibody (Cell Signaling Technology, Cat# 4147S) at a 1:250 dilution, followed by an AP-conjugated anti-mouse secondary antibody (Cell Signaling Technology, Cat#7054) essentially as described (Williams et al., 2014). Expression profiles were visualized using FIJI image processing software to convert each IHC image into a heat map. Images were inverted and a plot profile generated for one half of the PSM from the most recently formed somite boundary to the tip of the PSM directly beneath the end of the neural tube. The profile was pseudo-colored such that maximum signal intensity is red and the minimum intensity is dark blue. Each column from the expression profile data represents an individual embryo.
Skeletal Preparations
Skeletal preparations on 17.5 and 18.5 d.p.c. embryos were performed as previously described (McLeod, 1980). Rib abnormalities are defined as bifurcations, fusions between two individual ribs, and un-attached “floating” ribs. Statistical analysis using the Kruskal-Wallis test with the Dunn post hoc was used to compare individual genotypes. Nonparametric tests were used as several of the comparisons included groups that did not exhibit normal distributions or equal standard deviations. P values of <0.05 were considered significant and are indicated in the table and figure.
RT-PCR and qRT-PCR
Embryos were dissected at 10.5 d.p.c. in cold PBS and posterior PSM fragments were stored at −80C. After genotyping, RNA from pools of six PSM fragments was extracted using the Quick-RNA Miniprep kit (Zymo) followed by first-strand cDNA synthesis with the Superscript III kit (Invitrogen) with random hexamer primers. Dll1 cDNA was amplified using primers 5’-GGTTGCTCTGTGTTCTGCCG and 5’-GTATCCATGTTGGTCATCACACCC. Notch1 cDNA was amplified using primers 5’-GGGAGGTGGATGCTGACTGC- and 5’-TCTTCTTCACTGTTGCCTGTCTCAA. Hprt was amplified using primers 5’-AGCTACTGTAATGATCAGTCAACG and 5’-AGAGGTCCTTTTCACCAGCA. For Figure 5I, standard PCR was performed for 30 cycles and products were run on a gel to confirm amplification. qRT-PCR was performed on three biologically independent pooled samples of each genotype in triplicate using SYBR Green Master Mix (Applied Biosystems) in a Step-One Plus machine with 200nM primers and the following conditions: 50°C for 2 min, 95°C for 10 min, and 40 cycles at 95°C for 15 secs and 60°C for 1 min; followed by a melt curve cycle of 95°C for 15 secs, 60°C for 1 min, 95°C for 15 secs, and 60°C for 15 secs. One way Anova followed by Tukey post hoc was calculated with GraphPad Prism
Plasmids
The Dll3 EGF-like repeats 2–5 expression construct was generated as essentially as described (Shao et al., 2003). Rat Dll3 was amplified using primers 5’-TTAAGCTTctgggcctggaccctgtgatg and 5’-TTCTCGAGcccgacagtcgcgcccgc (restriction sites in capital letters), and cloned into the pSecTag2 Hygro C vector (Thermo Fisher). The S290A mutation was created by site-directed mutagenesis using primers 5’-ggggcGCCtgtagtgaaacc and 5’-cactacaGGCgcccccatt (mutated sequences in capital letters). The T407A mutation was similarly created using primers 5’-gcggcGCGtgcgtgga and 5’-cgcaCGCgccgccgtt. Mutations were confirmed by sequencing. The construct for mouse Notch 1 EGF-like repeats 1–5 is previously described (Al-Shareffi et al., 2013). The Tet repressor expression construct was a pcDNA6/TR regulatory plasmid (ThermoFisher Scientific). The Tet-responsive rat DLL3-HA construct was made by sub-cloning rDll3-HA from pEF-BOS-rDll3-HA (provided by Dr. Gerry Weinmaster, (Ladi et al., 2005)) into the pcDNA5/FRT/TO expression vector. The Dll1-Cerulean expression construct, pcDNA3.1 Zeo(+)-Kozak-hDll1-Cerulean, was made by sub-cloning the ‘kozak-hDll1-Cerulean’ region of pcDNA5-TO-Kozak-hDll1-Cerulean (provided by Dr. Michael Elowitz (LeBon et al., 2014)) into the pcDNA3.1Zeo(+) vector.
Tissue culture and cell line development
All cells were plated and grown in full DMEM (Corning) supplemented with 10% FBS and L-glutamine and drugs for selection as noted. HEK293 Flp-in TRex cells (Gibco) were grown in the presence of 15ug/mL blasticidin and 100ug/mL zeocin to maintain stable integration of the pcDNA6/TR regulatory plasmid and the FRT integration site and were used as the parental cell line. To make the Tet-responsive DLL3-HA stable cell lines (HEK293 Flp-TOD3HA cells), 80,000 HEK293 Flp-in TRex cells were plated in a 6-well plate and co-transfected with 0.5ug of pOG44 Flp Recombinase and pTO-Dll3-HA plasmid DNA, at a 9:1 ratio, using JetPRIME transfection reagent. 24 hours post transfection, cells were re-plated in a 60mm plate and selected with 15ug/mL blasticidin and 100ug/mL hygromycin. Stable lines were tested for zeocin sensitivity and for Tet-inducible DLL3-HA expression. The clonal line HEK293 TO-D3HA-1 was selected for further experiments.
To generate cell lines expressing Tet-inducible DLL3 and stable expression of Cerulean-tagged DLL1, HEK293 TOD3HA1 cells were transfected as above with 1ug of linearized pcDNA3.1Zeo(+)-Kozak-hDll1-Cerulean followed by selection with 15ug/mL blasticidin, 100ug/mL hygromycin, and 100ug/mL zeocin. Individual clones were isolated and screened for Cerulean fluorescence by confocal microscopy.
Metabolic labeling and protein purification for click chemistry
HEK293-T cells were plated at 200,000 cells/well in a 6-well plate. Transfections with pSecTag mNotch 1 EGF 1–5 or pSecTag Dll3 EGF 2–5 or pSecTag Dll3 EGF 2–5 mutants, were performed essentially as described (Al-Shareffi et al., 2013) using JetPRIME transfection reagent followed by 72hr growth in Opti-MEM Reduced Serum medium (Gibco) with 2% FBS, L-Glutamine, and 200 μM 6-akynyl fucose (6AF). Media was collected and the Click-iT Protein Reaction Buffers Kit (Thermo Fisher) was used to tag 6AF-containing proteins with biotin. Tagged proteins were analyzed by immunoblot, probing with Mouse Anti-Myc (1:5,000 Sigma Cat# M4439) followed by AlexaFluor-680 Goat Anti-Mouse IgG (Invitrogen). Biotinylated glycoproteins were detected using a Streptavidin-IRDye800 conjugate (1:25,000 Rockland Cat#S000-32). Blots were visualized using an Odyssey-CLx Imager (LI-COR).
Protein purification for mass spectrometry
1.5×10⁶ HEK293 cells were transfected as above with a 2:1 ratio of pSecTag-Dll3-EGFs2-5 or pEF-BOS-mDll1-Fc and either pcDNA3HA empty vector (-fringe) or pcDNA3-Lfng-HA (+LFNG). Proteins were purified from 10 ml Opti-MEM + 2% FBS after 72 hours of culture and LFNG expression was confirmed by western blot. DLL3 protein was purified as described (Al-Shareffi et al., 2013) using Ni2+ beads (Profinity IMAC Ni-charged resin, BioRad) and prepared Poly-prep columns (BioRad). DLL1 protein was purified using Agarose Protein A beads (Pierce-Thermo Scientific) after dialyzing collected media against IP Binding Buffer (25mM Tris-Cl pH 7.2, 150mM NaCl), and incubating beads with media overnight at 4°C. Samples were eluted in 1mL of 0.1M Glycine-Cl pH 3.0, followed by neutralizing sample pH with 50uL of 1M Tris-Cl pH 8.0. Purity and concentration of purified proteins were determined by SDS-PAGE and Coomassie staining.
Glycoproteomic analysis of DLL3-EGFs 2–5 and DLL1-Fc
Purified DLL3 and DLL1 proteins were reduced, alkylated and subjected to in-gel digestion with trypsin or V8 protease as described (Kakuda and Haltiwanger, 2014; Rana and Haltiwanger, 2011). The resulting peptides were analyzed by nano LC-MS/MS using Agilent nano HPLC-CHIP system coupled to a model 6430 Ion Trap mass spectrometer as described (Kakuda and Haltiwanger, 2014; Rana and Haltiwanger, 2011). O-Fucosylated peptides were identified by neutral loss searches, and semi-quantitative Extracted Ion Chromatograms (EIC) of selected ions were generated to compare relative amounts of unfucosylated and O-fucose glycoforms of each peptide. The most abundant ion for each peptide from an EGF repeat was chosen for generation of EICs. Raw data for the EICs was smoothed using a gauss algorithm.
Coculture assays
Sending cells were prepared by transfecting 600,000 cells with 2ug of empty vector (pcDNA3) or Lfng-HA. After 4 hr, media was replaced with DMEM containing either DMSO or 0.1 ug/mL doxycycline. Cells were used in co-culture assays 24 hours after DMSO/DOX addition. Receiving cells were prepared by plating 50,000 NIH3T3 cells in a 24-well plate and transfecting with 225 ng of pBOS-Notch1HA, 225 ng pGA981-6 (TP-1 luciferase a gift from Dr. Lothar Strobl (Minoguchi et al., 1997)), and 50 ng of a Renilla luciferase vector. After 4 hr, media was replaced with DMEM media containing the sending cells. Luciferase assays were conducted 24 hours later according to manufacturer’s instructions (Promega, Cat No: E1960).
Immunoblotting
For PSM samples, 10.5 d.p.c. embryos were dissected in cold PBS and whole or caudal (2/3) PSMs were boiled in Laemmli sample buffer with 4% beta-Mercaptoethanol for 10 minutes, prior to storage at −80C. After genotyping, three to four PSM lysates were pooled and run on a 10% SDS-PAGE gel.
For cell line analysis 200,000 cells were plated and transfected with either an LFNG-HA expression vector or an empty vector as a control as indicated using Jetprime. Cells were treated with or without 0.1ug/mL of doxycycline for 24 hours prior to harvesting. In DAPT experiments, DMSO or 5uM DAPT was added along with doxycycline. Harvested cells were resuspended in RIPA cell lysis buffer and incubated on ice for 30 minutes. 10uL of protein samples was mixed with an equal volume of 2X laemmli sample buffer containing 8% beta-mercaptoethanol and boiled for 10 minutes prior to being run on a 10% SDS-PAGE gel. NOTCH1 p120 Western blots were run on 8% SDS-PAGE gels for 1.25 hours, and transferred at 30V for 14 hrs. Detection of NOTCH1 p300 required longer run times (1.5 hours) and transfer times (16.5 hours).
Primary antibodies were Rat anti-NOTCH1 (Cell Signaling Technologies, 5B5) (1:500), which detects both the unprocessed Notch1 p300 and the furin-processed Notch p120; Mouse anti-alpha-Tubulin (Sigma-Aldrich, T5168) (1:5000); and Rat anti-Dll1 (Millipore, 1F9) (1:200) in PBST, Rabbit anti-NICD (Cell Signaling Technologies, D3B8) (1:200), rabbit anti-GFP N-term (Sigma) (1:2000), and rabbit anti-HA (Cell Signaling Technologies, C29F4) (1:5000. diluted in PBST with 5% milk. Secondary antibody detection with Alexa Fluor 680 Goat Anti-Mouse IgG (Invitrogen (Life Technologies)) (1:20,000), IRDye 680RD Goat Anti-Rat IgG (LI-COR) (1:20,000), IRDye 800CW Donkey Anti-Mouse IgG (LI-COR) (1:20,000), and IRDye 800CW Donkey Anti-Rabbit IgG (LI-COR) (1:20,000) was visualized using an Odyssey Imager (LI-COR) and band intensities were quantified using ImageStudio software provided by LI-COR. Protein levels in each sample were normalized to tubulin to control for loading. For comparison across different experiments, the tubulin-normalized value in the parental cell line (HEK 293 TRex or iDLL3/DLL1 grown in the absence of doxycicline) was set to 1. For cell line analysis dots on graphs represent biologically independent replicates run on different blots. In some cases samples were divided into technical replicates and values of replicates were averaged to produce a mean for a biological replicate. For PSM cultures, individual lanes represent independent pools, but since all samples were run on a single gel, values were only normalized to tubulin, and not further normalized to control samples. Statistical analyses were performed in GraphPad Prism (ANOVA followed by Tukey post hoc). P values of <0.05 were considered significant and are indicated in figures.
Immunofluorescence and cell surface presentation
For immunofluorescence analysis of unpermeabilized cells, 30,000 cells were plated in 24-well plates containing coverslips, and then treated with or without 0.1ug/mL doxycycline for 24 hours. Immunofluorescence was preformed essentially as described (Chapman et al., 2011), cells were incubated on ice for 20 min, followed by 1 hour incubation with Hamster anti-DLL1 antibody (Genetex HMD1-5) diluted 1:100 in DMEM. After 3 washes with DMEM, cells were fixed in in 5% PFA + 1M MgCl2 for 20 min, and washed in 10% PBS with 1M MgCl2 and 0.1% triton X-100. Coverslips were blocked for one hour in 5% FBS, 0.1% triton X100, 0.2M glycine, and 10% PBS. Coverslips were then incubated in secondary antibody (Goat anti-Hamster Alexa Fluor 488 Thermo Fisher A-21110) diluted 1:2000 in blocking buffer for 1 hour at room temperature. Cells were visualized on a spinning-disk confocal system (UltraVIEW Vox CSUX1 system; PerkinElmer, Waltham, MA) with 488- solid-state lasers and back thinned electron-multiplying charge-coupled device (EMCCD) cameras (C9100-13 or C9100-23B; Hamamatsu Photonics, Bridgewater, NJ) on a Nikon Ti-E microscope with a 100x/1.4 numerical aperture (NA) Plan-Apo objective lens (Nikon, Melville, NY). under 60x oil immersion with 6 slices of 0.3um step size taken of each region of interest (ROI). A mean gray value of background was taken in a space not containing any cells in each image, multiplied by the area of the measured cell and subtracted from the cell’s integrated fluorescence intensity to calculate corrected total cell fluorescence (CTCF). Image analysis was performed in Fiji (NIH). Statistical analyses were performed in GraphPad Prism (ANOVA followed by Tukey post hoc) P values of <0.05 were considered significant and are indicated in figures.
Supplementary Material
KEY RESOURCES TABLE.
| Reagent or resource | Source | Identifier |
|---|---|---|
| Antibodies | ||
| Hamster anti-DLL1 | Genetex | HMD1-5 RRID:AB_11176107 |
| Mouse anti-alpha-Tubulin | Sigma-Aldrich | T5168 RRID:AB_477579 |
| Rat anti-Dll1 | Millipore Sigma | PGPM-1F9 MABN2284 |
| Rat anti-Notch1 | Cell Signaling Technologies | 5B5 mAb #3447 RRID:AB_2153498 |
| Rabbit anti-NICD | Cell Signaling Technologies | D3B8 # 4147 RRID:AB_2153348 |
| Alexa Fluor 680 Goat Anti-Mouse IgG | Thermo Fisher | A28183 RRID:AB_2536167 |
| IRDye 680RD Goat Anti-Rat IgG | LI-COR | RRID:AB_10956590 |
| IRDye 800CW Donkey Anti-Mouse IgG | LI-COR | RRID:AB_621847 |
| IRDye 800CW Donkey Anti-Rabbit IgG | LI-COR | RRID:AB_621848 |
| Mouse Anti-Myc | Sigma | M4439 RRID:AB_439694 |
| AP-conjugated anti-rabbit secondary antibody | Cell Signaling Technologies | 7054 RRID:AB_2099235 |
| rabbit anti-HA | Cell Signaling Technologies | C29F4 RRID:AB_10693385 |
| rabbit anti-GFP N-term | Sigma |
G1544 RRID:AB_439690 |
| Goat anti-Hamster Alexa Fluor 488 | Thermo Fisher | A-21110 RRID:AB_2535759 |
| Bacterial and Virus Strains | ||
| Biological Samples | ||
| Chemicals, Peptides, and Recombinant Proteins | ||
| Streptavidin-IRDye800 conjugate | Rockland | S000-32 |
| Critical Commercial Assays | ||
| Click-iT Protein Reaction Buffers Kit | Thermo Fisher | C10276 |
| Dual Luciferase assay | Promega | E1960 |
| Click-IT™ Fucose Alkyne | Thermo Fisher | C10264 |
| Deposited Data | ||
| Experimental Models: Cell Lines | ||
| HEK293-T cells | ATCC | RRID:CVCL_0063 |
| Flp-in TRex 293 Cell Line | ThermoFisher | R78007 |
| NIH3T3 cells | ATCC | RRID:CVCL_0594 |
| Experimental Models: Organisms/Strains | ||
| Dll3pu Mus musculus | Jackson Laboratories | MGI:2173255 |
| Lfngtm1Rjo Mus musculus | Randy Johnson | MGI:3777244 |
| Oligonucleotides | ||
| Recombinant DNA | ||
| pSecTag2 Hygro C | ThermoFisher | |
| pcDNA6/TR | ThermoFisher | |
| pEF-BOS-rDll3-HA | Ladi et al. 2005 | |
| pcDNA5-TO-Kozak-hDll1-Cerulean | LeBon et al. 2014 | |
| pcDNA3.1Zeo(+) | ThermoFisher | |
| pcDNA3-Lfng-HA | Shifley and Cole 2008 | |
| pGA981-6 | Minoguchi et al., 1997 | |
| Nrarp probe | Shifley et el. 2008 | |
| Hes7 cDNA probe | Shifley et el. 2008 | |
| Hes7 intron probe | Shifley et el. 2008 | |
| Hes5 probe | Akazawa et al. 1992 | |
| Software and Algorithms | ||
| GraphPad Prism | GraphPad | |
| Other | ||
Axial skeletal phenotypes after loss of DLL3 or LFNG are similar except in the sacrum
Loss of DLL3 in the mouse PSM counterintuitively leads to a reduction in Notch signaling
Both EGF repeats 2 and 5 of DLL3 are efficiently modified by LFNG
When cells co-express NOTCH1 and DLL1, induction of DLL3 expression potentiates signal-sending activities
LFNG activity prevents this potentiation of signal-sending activity, providing a mechanism for cyclic cis-interactions in the segmentation clock
Acknowledgements:
We thank member of the Cole and Amacher labs for comments. This work was supported by NSF Grant IOS-0919649 and NIH grant HD095150 to SEC, NIH grant GM061126 to RSH, and a Pelotonia Foundation Undergraduate Fellowship (RD). DNA sequencing (Genomics Shared Resource) was subsidized by the OSUCCC support grant (NIH P30 CA016058).
Footnotes
Publisher's Disclaimer: This is a PDF file of an unedited manuscript that has been accepted for publication. As a service to our customers we are providing this early version of the manuscript. The manuscript will undergo copyediting, typesetting, and review of the resulting proof before it is published in its final form. Please note that during the production process errors may be discovered which could affect the content, and all legal disclaimers that apply to the journal pertain.
REFERENCES CITED
- Akazawa C, Sasai Y, Nakanishi S, Kageyama R, 1992. Molecular characterization of a rat negative regulator with a basic helix-loop-helix structure predominantly expressed in the developing nervous system. J Biol Chem 267, 21879–21885. [PubMed] [Google Scholar]
- Al-Shareffi E, Chaubard JL, Leonhard-Melief C, Wang SK, Wong CH, Haltiwanger RS, 2013. 6-alkynyl fucose is a bioorthogonal analog for O-fucosylation of epidermal growth factor-like repeats and thrombospondin type-1 repeats by protein O-fucosyltransferases 1 and 2. Glycobiology 23, 188–198. 10.1093/glycob/cws140 [doi] [DOI] [PMC free article] [PubMed] [Google Scholar]
- Benazeraf B, Pourquie O, 2013. Formation and segmentation of the vertebrate body axis. Annu. Rev. Cell Dev. Biol. 29, 1–26. 10.1146/annurev-cellbio-101011-155703 [doi] [DOI] [PubMed] [Google Scholar]
- Bessho Y, Sakata R, Komatsu S, Shiota K, Yamada S, Kageyama R, 2001. Dynamic expression and essential functions of Hes7 in somite segmentation. Genes Dev 15, 2642–2647. [DOI] [PMC free article] [PubMed] [Google Scholar]
- Bone RA, Bailey CS, Wiedermann G, Ferjentsik Z, Appleton PL, Murray PJ, Maroto M, Dale JK, 2014. Spatiotemporal oscillations of Notch1, Dll1 and NICD are coordinated across the mouse PSM. Development 141, 4806–4816. 10.1242/dev.115535 [doi] [DOI] [PMC free article] [PubMed] [Google Scholar]
- Bray S, Bernard F, 2010. Notch targets and their regulation. Curr. Top. Dev. Biol. 92, 253–275. 10.1016/S0070-2153(10)92008-5 [doi] [DOI] [PubMed] [Google Scholar]
- Cambray N, Wilson V, 2002. Axial progenitors with extensive potency are localised to the mouse chordoneural hinge. Development 129, 4855–4866. [DOI] [PubMed] [Google Scholar]
- Carrieri FA, Dale JK, 2017. Turn It Down a Notch. Front. cell Dev. Biol. 4, 151. 10.3389/fcell.2016.00151 [doi] [DOI] [PMC free article] [PubMed] [Google Scholar]
- Chapman G, Sparrow DB, Kremmer E, Dunwoodie SL, 2011. Notch inhibition by the ligand DELTA-LIKE 3 defines the mechanism of abnormal vertebral segmentation in spondylocostal dysostosis. Hum. Mol. Genet. 20, 905–916. 10.1093/hmg/ddq529 [doi] [DOI] [PubMed] [Google Scholar]
- Dale JK, Maroto M, Dequeant ML, Malapert P, McGrew M, Pourquie O, 2003. Periodic notch inhibition by lunatic fringe underlies the chick segmentation clock. Nature 421, 275–278. [DOI] [PubMed] [Google Scholar]
- de Angelis MH 2nd, J.M., Gossler A, 1997. Maintenance of somite borders in mice requires the Delta homologue DII1. Nature 386, 717–721. [DOI] [PubMed] [Google Scholar]
- Dequeant ML, Glynn E, Gaudenz K, Wahl M, Chen J, Mushegian A, Pourquie O, 2006. A complex oscillating network of signaling genes underlies the mouse segmentation clock. Science (80-. ). 314, 1595–1598. [DOI] [PubMed] [Google Scholar]
- Dunwoodie SL, Clements M, Sparrow DB, Sa X, Conlon RA, Beddington RS, 2002. Axial skeletal defects caused by mutation in the spondylocostal dysplasia/pudgy gene Dll3 are associated with disruption of the segmentation clock within the presomitic mesoderm. Development 129, 1795–1806. [DOI] [PubMed] [Google Scholar]
- Dunwoodie SL, Henrique D, Harrison SM, Beddington RS, 1997. Mouse Dll3: a novel divergent Delta gene which may complement the function of other Delta homologues during early pattern formation in the mouse embryo. Development 124, 3065–3076. [DOI] [PubMed] [Google Scholar]
- Eckalbar WL, Lasku E, Infante CR, Elsey RM, Markov GJ, Allen AN, Corneveaux JJ, Losos JB, DeNardo DF, Huentelman MJ, Wilson-Rawls J, Rawls A, Kusumi K, 2012. Somitogenesis in the anole lizard and alligator reveals evolutionary convergence and divergence in the amniote segmentation clock. Dev. Biol. 363, 308–319. 10.1016/j.ydbio.2011.11.021 [DOI] [PubMed] [Google Scholar]
- Evrard YA, Lun Y, Aulehla A, Gan L, Johnson RL, 1998. Lunatic Fringe is an Essential Mediator of Somite Segmentation and Patterning. Nature 394, 377–381. 10.1038/28632 [DOI] [PubMed] [Google Scholar]
- Feller J, Schneider A, Schuster-Gossler K, Gossler A, 2008. Noncyclic Notch activity in the presomitic mesoderm demonstrates uncoupling of somite compartmentalization and boundary formation. Genes Dev 22, 2166–2171. 10.1101/gad.480408 [DOI] [PMC free article] [PubMed] [Google Scholar]
- Gossler A, de Angelis MH, 1998. Somitogenesis. Curr Top Dev Biol 38, 225–287. [PubMed] [Google Scholar]
- Harvey BM, Rana NA, Moss H, Leonardi J, Jafar-Nejad H, Haltiwanger RS, 2016. Mapping Sites of O-Glycosylation and Fringe Elongation on Drosophila Notch. J. Biol. Chem. 291, 16348–16360. 10.1074/jbc.M116.732537 [doi] [DOI] [PMC free article] [PubMed] [Google Scholar]
- Hicks C, Johnston SH, diSibio G, Collazo A, Vogt TF, Weinmaster G, 2000. Fringe differentially modulates Jagged1 and Delta1 signalling through Notch1 and Notch2. Nat Cell Biol 2, 515–520. [DOI] [PubMed] [Google Scholar]
- Holley SA, Julich D, Rauch GJ, Geisler R, Nusslein-Volhard C, 2002. her1 and the notch pathway function within the oscillator mechanism that regulates zebrafish somitogenesis. Development 129, 1175–1183. [DOI] [PubMed] [Google Scholar]
- Holmdahl DE, 1925. Experimentelle Untersuchungen uber die Lage der Grenze zwischen primarer und sekundarere Korperentwicklung beim Huhn. Anatomsicher Anzeiger 59, 393–396. [Google Scholar]
- Hori K, Sen A, Artavanis-Tsakonas S, 2013. Notch signaling at a glance. J. Cell Sci. 126, 2135–2140. 10.1242/jcs.127308 [doi] [DOI] [PMC free article] [PubMed] [Google Scholar]
- Huppert SS, Ilagan MX, Strooper B. De, Kopan R, 2005. Analysis of Notch Function in Presomitic Mesoderm Suggests a gamma-Secretase-Independent Role for Presenilins in Somite Differentiation. Dev Cell 8, 677–688. [DOI] [PubMed] [Google Scholar]
- Jen WC, Gawantka V, Pollet N, Niehrs C, Kintner C, 1999. Periodic repression of Notch pathway genes governs the segmentation of Xenopus embryos. Genes Dev 13, 1486–1499. [DOI] [PMC free article] [PubMed] [Google Scholar]
- Jiang YJ, Aerne BL, Smithers L, Haddon C, Ish-Horowicz D, Lewis J, 2000. Notch signalling and the synchronization of the somite segmentation clock [In Process Citation]. Nature 408, 475–479. [DOI] [PubMed] [Google Scholar]
- Johnston SH, Rauskolb C, Wilson R, Prabhakaran B, Irvine KD, Vogt TF, 1997. A family of mammalian Fringe genes implicated in boundary determination and the Notch pathway. Development 124, 2245–2254. [DOI] [PubMed] [Google Scholar]
- Kadur Lakshminarasimha Murthy P, Srinivasan T, Bochter MS, Xi R, Varanko AK, Tung K-L, Semerci F, Xu K, Maletic-Savatic M, Cole SE, Shen X, 2018. Radical and lunatic fringes modulate notch ligands to support mammalian intestinal homeostasis. Elife 7. 10.7554/eLife.35710 [DOI] [PMC free article] [PubMed] [Google Scholar]
- Kakuda S, Haltiwanger RS, 2017. Deciphering the Fringe-Mediated Notch Code: Identification of Activating and Inhibiting Sites Allowing Discrimination between Ligands. Dev. Cell 40, 193–201. https://doi.org/S1534-5807(16)30877-2 [pii] [DOI] [PMC free article] [PubMed] [Google Scholar]
- Kakuda S, Haltiwanger RS, 2014. Analyzing the posttranslational modification status of Notch using mass spectrometry. Methods Mol. Biol. 1187, 209–221. 10.1007/978-1-4939-1139-4_16 [doi] [DOI] [PubMed] [Google Scholar]
- Kato TM, Kawaguchi A, Kosodo Y, Niwa H, Matsuzaki F, 2010. Lunatic fringe potentiates Notch signaling in the developing brain. Mol. Cell. Neurosci. 45, 12–25. 10.1016/j.mcn.2010.05.004; 10.1016/j.mcn.2010.05.004 [DOI] [PubMed] [Google Scholar]
- Kawaguchi D, Furutachi S, Kawai H, Hozumi K, Gotoh Y, 2013. Dll1 maintains quiescence of adult neural stem cells and segregates asymmetrically during mitosis. Nat. Commun. 4, 1880. 10.1038/ncomms2895 [DOI] [PMC free article] [PubMed] [Google Scholar]
- Koo B-K, Lim H-S, Song R, Yoon M-J, Yoon K-J, Moon J-S, Kim Y-W, Kwon M, Yoo K-W, Kong M-P, Lee J, Chitnis AB, Kim C-H, Kong Y-Y, 2005. Mind bomb 1 is essential for generating functional Notch ligands to activate Notch. Development 132, 3459–3470. 10.1242/dev.01922 [DOI] [PubMed] [Google Scholar]
- Kopan R, Ilagan MX, 2009. The canonical Notch signaling pathway: unfolding the activation mechanism. Cell 137, 216–233. 10.1016/j.cell.2009.03.045 [DOI] [PMC free article] [PubMed] [Google Scholar]
- Kusumi K, Sun ES, Kerrebrock AW, Bronson RT, Chi DC, Bulotsky MS, Spencer JB, Birren BW, Frankel WN, Lander ES, 1998. The mouse pudgy mutation disrupts Delta homologue Dll3 and initiation of early somite boundaries. Nat Genet 19, 274–278. [DOI] [PubMed] [Google Scholar]
- Ladi E, Nichols JT, Ge W, Miyamoto A, Yao C, Yang LT, Boulter J, Sun YE, Kintner C, Weinmaster G, 2005. The divergent DSL ligand Dll3 does not activate Notch signaling but cell autonomously attenuates signaling induced by other DSL ligands. J. Cell Biol. 170, 983–992. https://doi.org/jcb.200503113 [pii] [DOI] [PMC free article] [PubMed] [Google Scholar]
- LeBon L, Lee TV, Sprinzak D, Jafar-Nejad H, Elowitz MB, 2014. Fringe proteins modulate Notch-ligand cis and trans interactions to specify signaling states. Elife 3, e02950. 10.7554/eLife.02950 [doi] [DOI] [PMC free article] [PubMed] [Google Scholar]
- Matsuda M, Yamanaka Y, Uemura M, Osawa M, Saito MK, Nagahashi A, Nishio M, Guo L, Ikegawa S, Sakurai S, Kihara S, Maurissen TL, Nakamura M, Matsumoto T, Yoshitomi H, Ikeya M, Kawakami N, Yamamoto T, Woltjen K, Ebisuya M, Toguchida J, Alev C, 2020. Recapitulating the human segmentation clock with pluripotent stem cells. Nature 580, 124–129. 10.1038/s41586-020-2144-9 [DOI] [PubMed] [Google Scholar]
- McLeod MJ, 1980. Differential staining of cartilage and bone in whole mouse fetuses by alcian blue and alizarin red S. Teratology 22, 299–301. 10.1002/tera.1420220306 [DOI] [PubMed] [Google Scholar]
- Minoguchi S, Taniguchi Y, Kato H, Okazaki T, Strobl LJ, Zimber-Strobl U, Bornkamm GW, Honjo T, 1997. RBP-L, a transcription factor related to RBP-Jkappa. Mol. Cell. Biol. 17, 2679–87. 10.1128/MCB.17.5.2679 [DOI] [PMC free article] [PubMed] [Google Scholar]
- Moloney DJ, Panin VM, Johnston SH, Chen J, Shao L, Wilson R, Wang Y, Stanley P, Irvine KD, Haltiwanger RS, Vogt TF, 2000. Fringe is a glycosyltransferase that modifies Notch. Nature 406, 369–375. 10.1038/35019000 [DOI] [PubMed] [Google Scholar]
- Morimoto M, Takahashi Y, Endo M, Saga Y, 2005. The Mesp2 transcription factor establishes segmental borders by suppressing Notch activity. Nature 435, 354–359. [DOI] [PubMed] [Google Scholar]
- Muller J, Rana NA, Serth K, Kakuda S, Haltiwanger RS, Gossler A, 2014. O-fucosylation of the notch ligand mDLL1 by POFUT1 is dispensable for ligand function. PLoS One 9, e88571. 10.1371/journal.pone.0088571 [doi] [DOI] [PMC free article] [PubMed] [Google Scholar]
- Nitanda Y, Matsui T, Matta T, Higami A, Kohno K, Nakahata Y, Bessho Y, 2014. 3’-UTR-dependent regulation of mRNA turnover is critical for differential distribution patterns of cyclic gene mRNAs. FEBS J. 281, 146–156. 10.1111/febs.12582; 10.1111/febs.12582 [DOI] [PubMed] [Google Scholar]
- Niwa Y, Shimojo H, Isomura A, Gonzalez A, Miyachi H, Kageyama R, 2011. Different types of oscillations in Notch and Fgf signaling regulate the spatiotemporal periodicity of somitogenesis. Genes Dev. 25, 1115–1120. 10.1101/gad.2035311.; 10.1101/gad.2035311 [DOI] [PMC free article] [PubMed] [Google Scholar]
- Oginuma M, Takahashi Y, Kitajima S, Kiso M, Kanno J, Kimura A, Saga Y, 2010. The oscillation of Notch activation, but not its boundary, is required for somite border formation and rostral-caudal patterning within a somite. Development 137, 1515–1522. [DOI] [PubMed] [Google Scholar]
- Oka C, Nakano T, Wakeham A, de la Pompa JL, Mori C, Sakai T, Okazaki S, Kawaichi M, Shiota K, Mak TW, Honjo T, 1995. Disruption of the mouse RBP-J kappa gene results in early embryonic death. Development 121, 3291–3301. [DOI] [PubMed] [Google Scholar]
- Okajima T, Irvine KD, 2002. Regulation of notch signaling by o-linked fucose. Cell 111, 893–904. https://doi.org/S0092867402011145 [pii] [DOI] [PubMed] [Google Scholar]
- Okubo Y, Sugawara T, Abe-Koduka N, Kanno J, Kimura A, Saga Y, 2012. Lfng regulates the synchronized oscillation of the mouse segmentation clock via trans-repression of Notch signalling. Nat. Commun. 3, 1141. 10.1038/ncomms2133; 10.1038/ncomms2133 [DOI] [PubMed] [Google Scholar]
- Ozbudak EM, Pourquie O, 2008. The vertebrate segmentation clock: the tip of the iceberg. Curr Opin Genet Dev 18, 317–323. [DOI] [PubMed] [Google Scholar]
- Panin VM, Papayannopoulos V, Wilson R, Irvine KD, 1997. Fringe modulates Notch-ligand interactions. Nature 387, 908–912. [DOI] [PubMed] [Google Scholar]
- Panin VM, Shao L, Lei L, Moloney DJ, Irvine KD, Haltiwanger RS, 2002. Notch ligands are substrates for protein O-fucosyltransferase-1 and Fringe. J Biol Chem 277, 29945–29952. [DOI] [PubMed] [Google Scholar]
- Prince VE, Holley SA, Bally-Cuif L, Prabhakaran B, Oates AC, Ho RK, Vogt TF, 2001. Zebrafish lunatic fringe demarcates segmental boundaries. Mech Dev 105, 175–80. [DOI] [PubMed] [Google Scholar]
- Rampal R, Li AS, Moloney DJ, Georgiou SA, Luther KB, Nita-Lazar A, Haltiwanger RS, 2005. Lunatic fringe, manic fringe, and radical fringe recognize similar specificity determinants in O-fucosylated epidermal growth factor-like repeats. J. Biol. Chem. 280, 42454–42463. 10.1074/jbc.M509552200 [DOI] [PubMed] [Google Scholar]
- Rana NA, Haltiwanger RS, 2011. Fringe benefits: functional and structural impacts of O-glycosylation on the extracellular domain of Notch receptors. Curr. Opin. Struct. Biol. 21, 583–589. 10.1016/j.sbi.2011.08.008 [doi] [DOI] [PMC free article] [PubMed] [Google Scholar]
- Resende TP, Andrade RP, Palmeirim I, 2014. Timing embryo segmentation: dynamics and regulatory mechanisms of the vertebrate segmentation clock. Biomed Res. Int. 2014, 718683. 10.1155/2014/718683 [doi] [DOI] [PMC free article] [PubMed] [Google Scholar]
- Sasamura T, Sasaki N, Miyashita F, Nakao S, Ishikawa HO, Ito M, Kitagawa M, Harigaya K, Spana E, Bilder D, Perrimon N, Matsuno K, 2003. neurotic, a novel maternal neurogenic gene, encodes an O-fucosyltransferase that is essential for Notch-Delta interactions. Development 130, 4785–4795. 10.1242/dev.00679 [doi] [DOI] [PubMed] [Google Scholar]
- Schuster-Gossler K, Cordes R, Muller J, Geffers I, Delany-Heiken P, Taft M, Preller M, Gossler A, 2016. Context-Dependent Sensitivity to Mutations Disrupting the Structural Integrity of Individual EGF Repeats in the Mouse Notch Ligand DLL1. Genetics 202, 1119–1133. 10.1534/genetics.115.184515 [doi] [DOI] [PMC free article] [PubMed] [Google Scholar]
- Serth K, Schuster-Gossler K, Cordes R, Gossler A, 2003. Transcriptional oscillation of lunatic fringe is essential for somitogenesis. Genes Dev 17, 912–925. [DOI] [PMC free article] [PubMed] [Google Scholar]
- Serth K, Schuster-Gossler K, Kremmer E, Hansen B, Marohn-Kohn B, Gossler A, 2015. O-fucosylation of DLL3 is required for its function during somitogenesis. PLoS One 10, e0123776. 10.1371/journal.pone.0123776 [doi] [DOI] [PMC free article] [PubMed] [Google Scholar]
- Sewell W, Sparrow DB, Smith AJ, Gonzalez DM, Rappaport EF, Dunwoodie SL, Kusumi K, 2009. Cyclical expression of the Notch/Wnt regulator Nrarp requires modulation by Dll3 in somitogenesis. Dev. Biol. 329, 400–409. 10.1016/j.ydbio.2009.02.023 [doi] [DOI] [PMC free article] [PubMed] [Google Scholar]
- Shao L, Moloney DJ, Haltiwanger R, 2003. Fringe modifies O-fucose on mouse Notch1 at epidermal growth factor-like repeats within the ligand-binding site and the Abruptex region. J. Biol. Chem. 278, 7775–7782. 10.1074/jbc.M212221200 [doi] [DOI] [PubMed] [Google Scholar]
- Shi S, Stanley P, 2003. Protein O-fucosyltransferase 1 is an essential component of Notch signaling pathways. Proc. Natl. Acad. Sci. U. S. A. 100, 5234–5239. 10.1073/pnas.0831126100 [doi] [DOI] [PMC free article] [PubMed] [Google Scholar]
- Shifley ET, Vanhorn KM, Perez-Balaguer A, Franklin JD, Weinstein M, Cole SE, 2008. Oscillatory lunatic fringe activity is crucial for segmentation of the anterior but not posterior skeleton. Development 135, 899–908. 10.1242/dev.006742 [DOI] [PubMed] [Google Scholar]
- Shimojo H, Isomura A, Ohtsuka T, Kori H, Miyachi H, Kageyama R, 2016. Oscillatory control of Delta-like1 in cell interactions regulates dynamic gene expression and tissue morphogenesis. Genes Dev. 30, 102–116. 10.1101/gad.270785.115 [doi] [DOI] [PMC free article] [PubMed] [Google Scholar]
- Sparrow DB, Chapman G, Wouters MA, Whittock NV, Ellard S, Fatkin D, Turnpenny PD, Kusumi K, Sillence D, Dunwoodie SL, 2006. Mutation of the LUNATIC FRINGE gene in humans causes spondylocostal dysostosis with a severe vertebral phenotype. Am J Hum Genet 78, 28–37. [DOI] [PMC free article] [PubMed] [Google Scholar]
- Sprinzak D, Lakhanpal A, Lebon L, Santat LA, Fontes ME, Anderson GA, Garcia-Ojalvo J, Elowitz MB, 2010. Cis-interactions between Notch and Delta generate mutually exclusive signalling states. Nature 465, 86–90. 10.1038/nature08959 [doi] [DOI] [PMC free article] [PubMed] [Google Scholar]
- Stauber M, Sachidanandan C, Morgenstern C, Ish-Horowicz D, 2009. Differential axial requirements for lunatic fringe and Hes7 transcription during mouse somitogenesis. PLoS One 4, e7996. [DOI] [PMC free article] [PubMed] [Google Scholar]
- Truett GE, Heeger P, Mynatt RL, Truett AA, Walker JA, Warman ML, 2000. Preparation of PCR-quality mouse genomic DNA with hot sodium hydroxide and tris (HotSHOT). Biotechniques 29, 52,54. [DOI] [PubMed] [Google Scholar]
- Turnpenny PD, Whittock N, Duncan J, Dunwoodie S, Kusumi K, Ellard S, 2003. Novel mutations in DLL3, a somitogenesis gene encoding a ligand for the Notch signalling pathway, cause a consistent pattern of abnormal vertebral segmentation in spondylocostal dysostosis. J Med Genet 40, 333–339. [DOI] [PMC free article] [PubMed] [Google Scholar]
- van Eeden FJ, Granato M, Schach U, Brand M, Furutani-Seiki M, Haffter P, Hammerschmidt M, Heisenberg CP, Jiang YJ, Kane DA, Kelsh RN, Mullins MC, Odenthal J, Warga RM, Allende ML, Weinberg ES, Nusslein-Volhard C, 1996. Mutations affecting somite formation and patterning in the zebrafish, Danio rerio. Development 123, 153–164. [DOI] [PubMed] [Google Scholar]
- Wahi K, Bochter MS, Cole SE, 2016. The many roles of Notch signaling during vertebrate somitogenesis. Semin. Cell Dev. Biol. 49, 68–75. https://doi.org/S1084-9521(14)00320-6 [pii] [DOI] [PubMed] [Google Scholar]
- Williams DR, Shifley ET, Braunreiter KM, Cole SE, 2016. Disruption of somitogenesis by a novel dominant allele of Lfng suggests important roles for protein processing and secretion. Development 143, 822–830. 10.1242/dev.128538 [doi] [DOI] [PubMed] [Google Scholar]
- Williams DR, Shifley ET, Lather JD, Cole SE, 2014. Posterior skeletal development and the segmentation clock period are sensitive to Lfng dosage during somitogenesis. Dev. Biol. 388, 159–169. 10.1016/j.ydbio.2014.02.006; 10.1016/j.ydbio.2014.02.006 [DOI] [PubMed] [Google Scholar]
- Wilson V, Beddington RS, 1996. Cell fate and morphogenetic movement in the late mouse primitive streak. Mech Dev 55, 79–89. [DOI] [PubMed] [Google Scholar]
- Xu K, Nieuwenhuis E, Cohen BL, Wang W, Canty AJ, Danska JS, Coultas L, Rossant J, Wu MY, Piscione TD, Nagy A, Gossler A, Hicks GG, Hui CC, Henkelman RM, Yu LX, Sled JG, Gridley T, Egan SE, 2010. Lunatic Fringe-mediated Notch signaling is required for lung alveogenesis. Am. J. Physiol. Cell. Mol. Physiol. 298, L45–56. 10.1152/ajplung.90550.2008 [DOI] [PMC free article] [PubMed] [Google Scholar]
- Yang LT, Nichols JT, Yao C, Manilay JO, Robey EA, Weinmaster G, 2005. Fringe glycosyltransferases differentially modulate Notch1 proteolysis induced by Delta1 and Jagged1. Mol. Biol. Cell 16, 927–942. 10.1091/mbc.E04-07-0614 [DOI] [PMC free article] [PubMed] [Google Scholar]
- Yoshioka-Kobayashi K, Matsumiya M, Niino Y, Isomura A, Kori H, Miyawaki A, Kageyama R, 2020. Coupling delay controls synchronized oscillation in the segmentation clock. Nature 580, 119–123. 10.1038/s41586-019-1882-z [DOI] [PubMed] [Google Scholar]
- Zhang N, Martin GV, Kelley MW, Gridley T, 2000. A mutation in the Lunatic fringe gene suppresses the effects of a Jagged2 mutation on inner hair cell development in the cochlea. Curr Biol 10, 659–662. [DOI] [PubMed] [Google Scholar]
- Zhang N, Norton CR, Gridley T, 2002. Segmentation defects of Notch pathway mutants and absence of a synergistic phenotype in lunatic fringe/radical fringe double mutant mice. Genes. (New York, N.Y. 2000) 33, 21–28. 10.1002/gene.10081 [DOI] [PubMed] [Google Scholar]
Associated Data
This section collects any data citations, data availability statements, or supplementary materials included in this article.