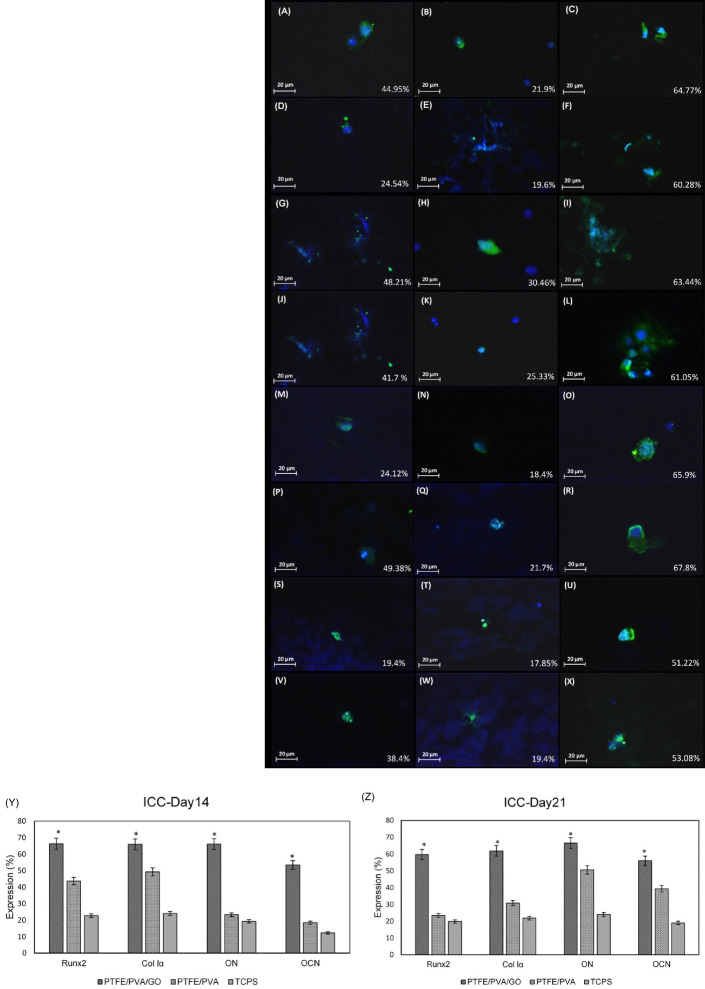
Fig. 6.
Immunocytochemistry analysis(A-X, scale bar: 20 μm). Based on the images, expression of RUNX2 by ADSCs at day 14 of culture (A, B, C) was 44.95% at PTFE/PVA (A), 21.9% at TCPS (B), and 64.77% at PTFE/PVA/GO (C) while its expression at day 21 of culture (D, E, F) was 24,54% at PTFE/PVA (D), 19.6% at TCPS (E), and 60.28% at PTFE/PVA/GO (F). Expression of Col 1α by ADSCs at day 14 of culture (G, H, I) was 48.21% at PTFE/PVA (G), 30.46% at TCPS (H), and 63.44% at PTFE/PVA/GO (I) while its expression at day 21 of culture (J, K, L) was 41.7% at PTFE/PVA (J), 25.33% at TCPS (K), and 61.05% at PTFE/PVA/GO (L). Expression of ON by ADSCs at day 14 of culture (M, N, O) was 24.12% at PTFE/PVA (P), 18.4% at TCPS (Q), and 65.9% at PTFE/PVA/GO (R) while its expression at day 21 of culture (P, Q, R) was 49.38% at PTFE/PVA (S), 21.7% at TCPS (T), and 67.8% at PTFE/PVA/GO (U). Expression of OCN by ADSCs at day 14 of culture (S, T, U) was 19.4% at PTFE/PVA (S), 17.85% at TCPS (T), and 51.22% at PTFE/PVA/GO (U) while its expression at day 21 of culture (V, W, X) was 38.4% at PTFE/PVA (S), 19.4% at TCPS (T), and 53.08% at PTFE/PVA/GO (U). Green colour showed detected proteins using specific antibodies, while blue color showed the cells nuclei detected using DAPI staining. Semi-quantifying immunocytochemistry analysis using ImageJ software (Y, Z). The results confirm that the expression of mentioned osteogenic protein markers were significantly higher at ADSCs seeded on PTFE/PVA/GO scaffolds compared with ADSCs seeded on PTFE/PVA scaffolds and TCPS (*P<0.05).

