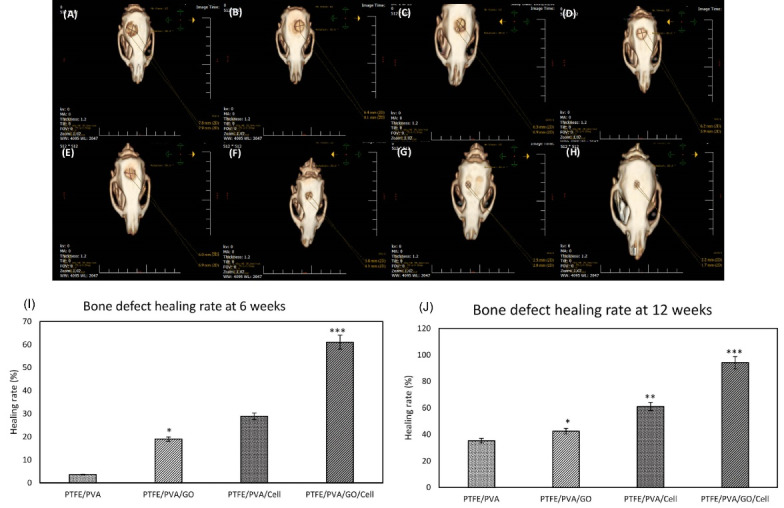
Fig. 7.

CT scan images at weeks 6 (Upper row, A, B, C, D) and 12 (lower row, E, F, G, H) after implantation in experimental groups. As shown in the images, the defects dimeter that filled by PTFE/PVA/Cell (C, G) and PTFE/PVA/GO/Cell (D, H) were obviously decreased compared to PTFE/PVA scaffold (A, E) and PTFE/PVA/GO (B, F). Healing rate analysis based on CT scan images at 6 (I) and 12 weeks (J). The results showed that healing rate at defects were filled by GO containing scaffolds were significantly higher than defects were filled by PTFE/PVA at weeks 6 and 12 (** P < 0.01). Defects were filled by PTFE/PVA/GO/Cell showed higher healing rate as compared to other groups at weeks 6 and 12 (*** P < 0.005). As well as, healing rate at defects were filled by cell containing scaffolds were significantly higher than defects were filled by scaffolds without cells (**P < 0.05).
