

Abstract
Equilibrium between excitation and inhibition (E/I balance) is key to healthy brain function. Conversely, disruption of normal E/I balance has been implicated in a range of central neurological pathologies. Magnetic resonance spectroscopy (MRS) provides a non-invasive means of quantifying in vivo concentrations of excitatory and inhibitory neurotransmitters, which could be used as diagnostic biomarkers. Using the ratio of excitatory and inhibitory neurotransmitters as an index of E/I balance is common practice in MRS work, but recent studies have shown inconsistent evidence for the validity of this proxy. This is underscored by the fact that different measures are often used in calculating E/I balance such as glutamate and Glx (glutamate and glutamine). Here we used a large MRS dataset obtained at ultra-high field (7 T) measured from 193 healthy young adults and focused on two brain regions - prefrontal and occipital cortex - to resolve this inconsistency. We find evidence that there is an inter-individual common ratio between GABA+ (γ-aminobutyric acid and macromolecules) and Glx in occipital, but not prefrontal cortex. We further replicate the prefrontal result in a legacy dataset (n=78) measured at high-field (3 T) strength. By contrast, with ultra-high field MRS data, we find extreme evidence that there is a common ratio between GABA+ and glutamate in both prefrontal and occipital cortices, which cannot be explained by participant demographics, signal quality, fractional tissue volume, or other metabolite concentrations. These results are consistent with previous electrophysiological and theoretical work supporting E/I balance. Our findings indicate that MRS-detected GABA+ and glutamate (but not Glx), are a reliable measure of E/I balance.
Keywords: E/I balance, MRS, glutamate, GABA, 7T, ultra-high field
INTRODUCTION
Balanced excitatory and inhibitory activity (i.e., E/I balance) is a key feature of healthy brain function, as supported by a large body of theoretical (Marín, 2012; Shadlen & Newsome, 1994; Van Vreeswijk & Sompolinsky, 1996; Vogels & Abbott, 2009) and empirical evidence (Anderson et al., 2000; Poo & Isaacson, 2009; Wehr & Zador, 2003; Wilent & Contreras, 2005). E/I balance sharpens neural tuning (Higley & Contreras, 2006; Wilent & Contreras, 2005) in response to external stimulation and maintains equilibrium throughout the brain during periods of spontaneous activity (Okun & Lampl, 2008). By contrast, E/I imbalance is thought to underlie central pathologies such as epilepsy (Bradford, 1995; Olsen & Avoli, 1997), autism spectrum disorder (Chao et al., 2010; Markram & Markram, 2010; Rubenstein & Merzenich, 2003; Vattikuti & Chow, 2010), and schizophrenia (Kehrer et al., 2008) (for a review see (Sohal & Rubenstein, 2019)).
Magnetic resonance spectroscopy (MRS) can be used to measure in vivo concentrations of primary excitatory (glutamate, Glu) and inhibitory (γ-aminobutyric acid, GABA) neurotransmitters within the brain. While empirical evidence supporting E/I balance is based on electrophysiological work, it is common practice in MRS studies to report the ratio of these neurotransmitters as an index of this phenomenon. The ratio of GABA+ (GABA and macromolecules) and Glu or Glx (a complex comprising Glu and glutamine (Gln)) has been used to study a range of healthy brain functions including decision-making (Bezalel et al., 2019), visual learning (Shibata et al., 2017), volitional control (Koizumi et al., 2018), memory (Bang et al., 2018; Takei et al., 2016), and visual contrast sensitivity (Betina Ip et al., 2019). It has also been used to investigate other neuroimaging signals, such as default mode network activity (Gu et al., 2019; Kapogiannis et al., 2013), and the effectiveness of non-invasive brain stimulation (Filmer et al., 2019). In the context of theories relating neuropsychiatric conditions to E/I imbalance, these neurotransmitters have been identified as potential biomarkers for autism spectrum disorder and schizophrenia (Brown et al., 2013; Egerton et al., 2012; Horder et al., 2013; Smesny et al., 2015).
Steel et al. (2020) found a positive correlation between inter-individual measurements of GABA+ and Glx measured from a voxel targeting posterior cingulate cortex. This result suggests there may be a common ratio between these neurotransmitters and provides support for the validity of interpreting their relative concentrations as an indicator of E/I balance. That is, the relationship between GABA+ and Glx may reflect the concurrent excitatory and inhibitory activity observed electrophysiologically, e.g., in response to external stimulation (Anderson et al., 2000; Wilent & Contreras, 2005). By contrast, Rideaux (2021) found strong evidence against a positive correlation between GABA+ and Glx in both visual and motor cortices, suggesting that the results of Steel et al. (2020) may be region specific and that the ratio between MRS-detected GABA+ and Glx is unrelated to the E/I balance measured in electrophysiological work.
The discrepancy between these findings may be explained by differences in information processing between medial parietal cortex and visual and motor cortices. The function of the visual and motor cortices targeted by Rideaux (2021) is relatively specialised; these regions primarily support processing of visual input (Hubel & Wiesel, 1959, 1968) and voluntary hand movement (Hluštík et al., 2001; Penfield & Boldrey, 1937), respectively. By contrast, the medial parietal lobe is functionally complex; it is associated with a diverse range of perceptual and cognitive operations, including (but not limited to) visual scene perception (Epstein et al., 2007; Silson et al., 2019), memory recall (Wagner et al., 2005), future prediction (Szpunar et al., 2007), and heading direction (Baumann & Mattingley, 2010). As such, it may benefit from the maintenance of E/I balance at a temporal and/or spatial scale that is detectable with MRS measurements averaged over a ~10 min period.
Alternatively, it is possible that a brain-wide common ratio of GABA and Glu exists, but its presence is obscured by the influence of Gln in the Glx signal. The previous studies by (Rideaux, 2021) and (Steel et al., 2020) reported the relationship between Glx and GABA+ because the Glu signal cannot be effectively isolated from the Gln signal at the MRI field strength (3 T) used in these experiments. If Gln is negatively correlated with GABA, this could mask a positive relationship between GABA and Glu.
To test these possibilities, here we obtained ultra-high field (7 T) MRS data with two sequences, MEGA-semi-LASER (MEGA-sLASER) followed by semi-LASER (sLASER), to measure the relationship between GABA+ and both Glx and Glu from a voxel targeting (functionally complex) prefrontal cortex in a large sample of participants (n=193) using a pre-registered analytic plan. To preview the results, in line with Rideaux (2021), we found strong evidence that there is no positive relationship between GABA+ and Glx in prefrontal cortex. Further, we replicated this finding using a large sample (n=78) of high field strength (3 T) MRS legacy data targeting the same region. By contrast, we found extreme evidence indicating there is a positive correlation between GABA+ and Glu at 7 T. Our control analyses show that this relationship cannot be explained by participant demographics, voxel tissue composition, signal quality, or other metabolites. Finally, we find extreme evidence that both Glx and Glu are positively correlated with GABA+ in occipital cortex. However, consistent with the results from prefrontal cortex, the relationship between GABA+ and Glu is significantly stronger than that with Glx. These findings indicate that there is a brain-wide common ratio between inhibitory and excitatory neurotransmitters detected with MRS, consistent with electrophysiological work. In order to reliably measure this index of E/I balance, however, it is recommended to measure Glu directly, without the influence of Gln.
METHODS
Participants.
One hundred and ninety-three healthy participants (128 women) were included in the MRS experiment. The mean age was 23.1 yr (range, 18–40 yr). In line with recent expert consensus recommendations (Near et al., 2021), data from 22 participants were omitted from analyses due to the presence of severe spurious echoes in the MRS spectra. Participants were screened for contraindications to MRI before the experiment. All participants gave informed written consent, and the experiment was approved by The University of Queensland Human Research Ethics Committee.
Legacy data.
Legacy data from previous studies (doi.org/10.14264/uql.2019.12; (Filmer et al., 2019; Rideaux et al., 2021) were combined. In these studies, male and female human participants underwent MR spectroscopic acquisition targeting prefrontal cortex (n=78; 42 women; mean age=22 yr).
Data Acquisition.
Magnetic resonance scanning was conducted on a Magnetom 7 T research whole-body MRI scanner (Siemens Healthcare, Erlangen, Germany) equipped with a 32-channel head coil (Nova Medical, USA). Anatomical T1-weighted images were acquired for voxel placement with an MP2-RAGE sequence. For detection of GABA+ and Glx, spectra were acquired using a MEGA-sLASER sequence (Andreychenko et al., 2012): TE=74 ms, TR=7800 ms, bandwidth=4000 Hz; 64 transients of 4096 data points were acquired, 2 water-unsuppressed transients were additionally acquired; a 23.6 ms Gaussian editing pulse was applied at 1.90 (ON) and 7.46 (OFF) ppm. Water suppression was achieved using variable power with optimized relaxation delays (VAPOR; Tkáč & Gruetter, 2005) and outer volume suppression. For detection of Glu, spectra were acquired using a sLASER sequence (Scheenen et al., 2008): TE=42 ms, TR=7790 ms, spectral width=4000 Hz; 32 transients of 4096 data points were acquired. Additionally, in line with recent expert consensus (Cudalbu et al., 2021), a single inversion recovery metabolite nulling in sLASER (TI=1135 ms) was performed in two subjects to estimate macromolecule contribution; these results were used to constrain metabolite quantification. Automated shimming with 3D GRE brain, followed by FAST(EST)MAP shimming were run in succession. All MRS data were analysed from their Siemens TWIX format. During the MRS acquisition, participants passively viewed a naturalistic film. The acquisition window for the MRS sequences was 1000 ms; however, the signal-to-noise of the free induction decay after 250 ms is very low, so we only used the first 250 ms of the data for each acquisition.
Spectra were acquired from a location targeting prefrontal cortex (Fig. 1a). The voxel (40×26×26 mm3) was positioned on a slice 1.5 mm above the superior margin of the lateral ventricles, with the centre of the volume placed one third of the total anterior/posterior distance, centred halfway between the left lateral border and the midline. The coordinates of the voxel location were used to draw a mask on the anatomical T1-weighted image to calculate the fractional volume of grey matter, white matter, and cerebrospinal fluid within each voxel. Tissue segmentation was performed using the Statistical Parametric Mapping toolbox for MATLAB (SPM12, www.fil.ion.ucl.ac.uk/spm; Ashburner & Friston, 2005).
Figure 1. Prefrontal cortex voxel location and spectra.
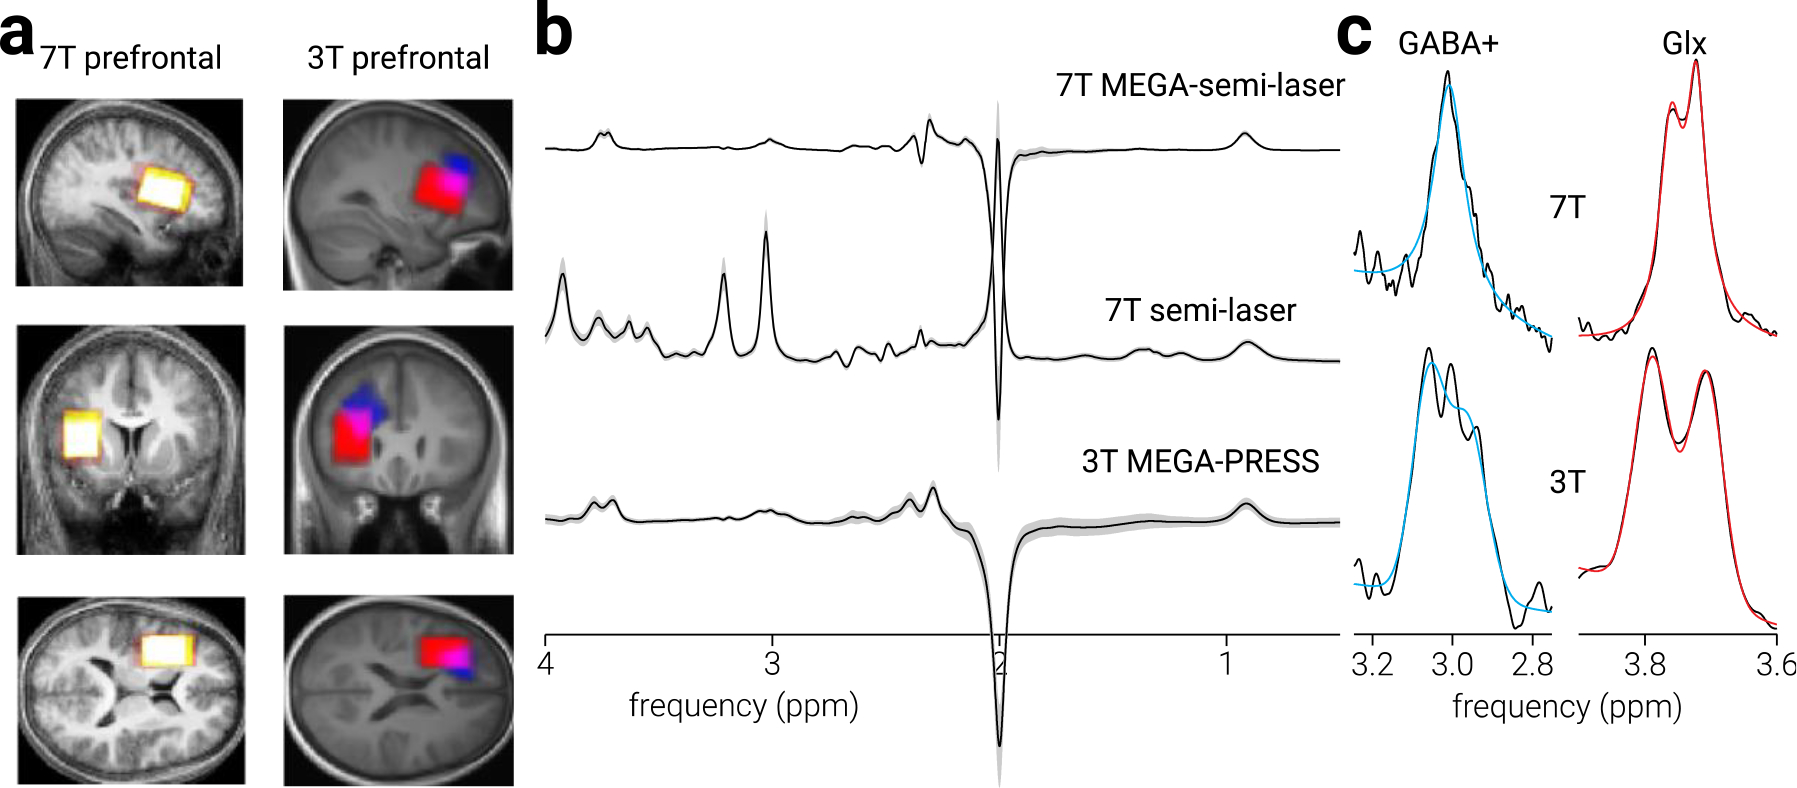
a) Sagittal, coronal, and axial views of prefrontal cortex MRS voxel placement in the current (7 T) experiment and the legacy experiments, on the average T1-weighted structural image in Montreal Neurological Institute (MNI) space. Colour intensity indicates voxel placement overlap across participants; for the 3 T data, red indicates voxels from Filmer et al. (2019) and blue indicates voxels from Rideaux et al. (2021). b) Average sLASER, MEGA-sLASER and MEGA-PRESS spectra for all participants. Shaded regions indicate ±1 standard deviation. c) Examples of GABA+ and Glx model fit to the difference-spectra for 7 T and 3 T data.
We also analysed legacy MRS data from two previous studies (Filmer et al., 2019; Rideaux et al., 2021). These data were collected at different sites, using a 3 T Magnetom Prisma (Siemens Healthcare, Erlangen, Germany) equipped with either a 32- or a 64-channel receive-only head coil (Nova Medical, USA). For detection of GABA+ and Glx, all data were collected using a MEGA-PRESS sequence (Mescher et al., 1998). The data from Rideaux et al. (2021) were collected using the following parameters: TE=68 ms, TR=3000 ms, spectral width=2400 Hz; 256 transients of 2048 data points were acquired. The data from Filmer et al. (2019) were collected using the following parameters: TE=68 ms, TR=2000 ms, spectral width=2400 Hz; 144 transients of 2080 data points were acquired. For both datasets, a 14.28 ms Gaussian editing pulse was applied at 1.9 (ON) and 7.5 (OFF) ppm and water-unsuppressed transients were additionally acquired. The voxel size (40×25×30 mm3) and positioning used by Filmer et al. (2019) were similar to those used in the current experiment, whereas Rideaux et al. (2021) used a smaller voxel (25×25×25 mm3) with similar positioning (left hemisphere, above the superior margin of the lateral ventricles; Fig. 1a).
To test the regional specificity of the results obtained from prefrontal cortex data, we analysed MRS data collected from a voxel targeting occipital cortex (Fig. 2a). These data were collected in the same scanning session as the primary dataset, using the same sequences, from a voxel (40×26×26 mm3) positioned centrally across the bilateral midline, above and aligned to the calcarine fissure.
Figure 2. Occipital cortex voxel location and spectra.
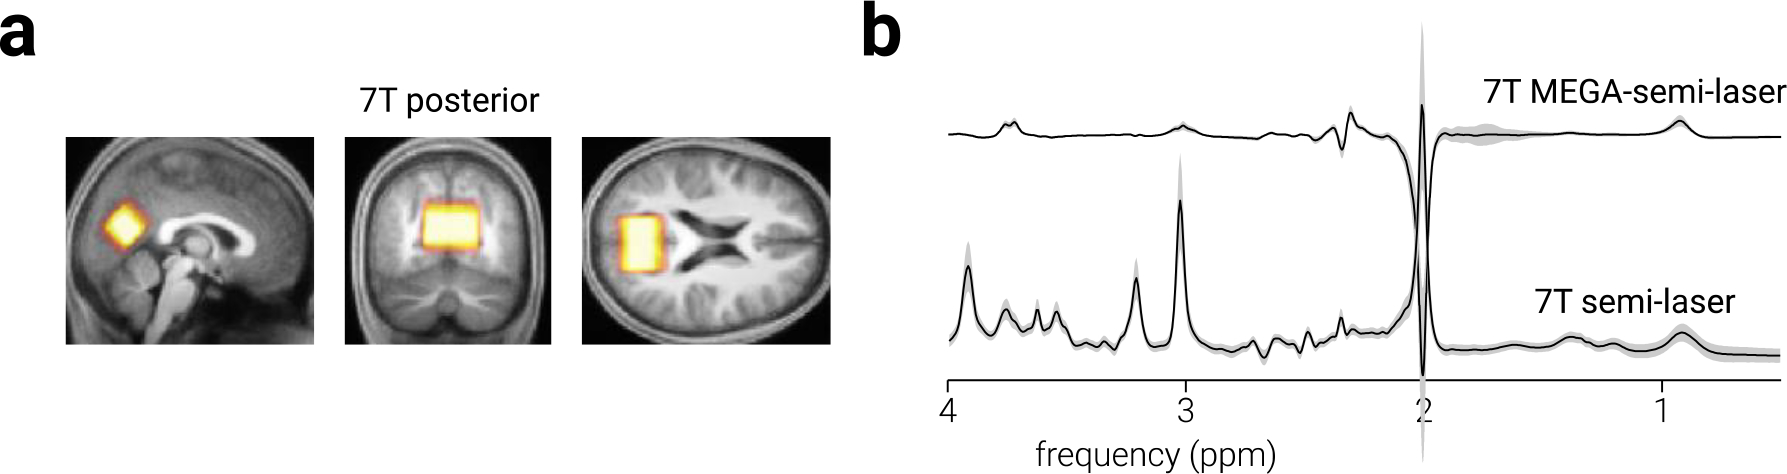
a) Sagittal, coronal, and axial views of occipital cortex MRS voxel placement on the average T1-weighted structural image in MNI space. Colour intensity indicates voxel placement overlap across participants. b) Average sLASER and MEGA-sLASER spectra for all participants. Shaded regions indicate ±1 standard deviation.
Data processing.
Spectral pre-processing and quantification were conducted in MATLAB (The MathWorks, Inc., Matick, MA) using in-house scripts. Prior to alignment, for consistency with previous work (Rideaux, 2021; Steel et al., 2020) and to improve frequency/phase estimation, all edited (MEGA) subspectra were 3-Hz exponential line-broadened zero-filled to a spectral resolution of 0.061 Hz/point. Unedited (sLASER) data were not line-broadened or zero-filled due to constraints imposed by LCModel (Provencher, 1993). Frequency and phase parameter estimates were obtained by modelling the total creatine (tCr; creatine and phosphocreatine) signal, then these parameters were used to align subspectra to a common frequency and phase, as previous work has shown this is the most effective method of alignment for GABA+ quantification (Rideaux et al., 2021). Estimates of signal area and full width at half maximum (FWHM) were also obtained, and subspectra (and their corresponding ON/OFF subspectra) with parameter estimates >2.5 standard deviations (s.d.) from the mean within a scan were omitted from further analysis. Spectra with standard deviation >.15 between frequencies 3.2–3.6 were omitted due to contamination by spurious echoes (n=22; (Near et al., 2021); note, however, we found the same pattern of results when these spectra were included in the analyses.
For edited data, tCr, tNAA, and total choline (tCho) signal intensity were determined by fitting a Lorentzian model to the average OFF spectra at 3.0 ppm and 2.0 ppm, respectively. The average ON and OFF spectra were subtracted to produce the edited spectrum (Fig. 1b, 2b), from which GABA+ (3 ppm) and Glx (3.8 ppm) signal intensity were modelled. For 7 T data, GABA+ and Glx were fit using singlet and doublet Lorentzian models, respectively. For consistency with our previous work analysing high field data (Rideaux, 2021), doublet Gaussian models were used to fit GABA+ and Glx signals for the 3 T data. Lorentzian and Gaussian models were used to fit the 7 T and 3 T data, respectively, to account for differences in spectral linewidth (Fig. 1c). Water signal intensity was determined by fitting a Lorentzian model to the average water-unsuppressed spectra at 4.9 ppm. The unedited (sLaser) data, in addition to the macromolecule spectra, were analysed using LCModel (Provencher, 1993) to estimate Glu and Gln signal intensity.
Neurochemical signal intensities were calculated as the area of the fitted peak(s) and expressed in institutional units (i.u.) using the unsuppressed water signal as an internal concentration reference. To ensure relationships between metabolites were not introduced or masked by differences in water quantification, the water estimates described above were also used to scale the Glu signal. Due to differences in metabolite quantification between LCModel and our in-house methods, interpretation of the absolute water-scaled Glu values is limited to the current study. We further applied a tissue-correction method that accounts for differences in relaxation times across the tissue types within a voxel (Gasparovic et al., 2006). The assumed longitudinal relaxation times of water, GABA+, Glx, Glu, Gln, tCr, tNAA, and tCho at 7 T were 1.78 s, 1.33 s, 1.69 s, 1.68 s, 1.69 s, 1.76 s, 1.87 s, and 1.76 s, respectively (Andreychenko et al., 2012; Xin et al., 2013). The assumed transverse relaxation times of these metabolites were 0.05 s, 0.09 s, 0.09 s, 0.09 s, 0.09 s, 0.10 s, 0.09 s, 0.15 s, respectively (Andreychenko et al., 2012; Marjańska et al., 2012). The assumed longitudinal relaxation times of water, GABA+ and Glx at 3 T were 1.10 s, 1.31 s, 1.29 s, respectively (Posse et al., 2007; Puts et al., 2013; Wansapura et al., 1999). The assumed transverse relaxation times of these metabolites were 0.10 s, 0.09 s, 0.18 s, respectively (Edden et al., 2012; Ganji et al., 2012; Wansapura et al., 1999). The assumed relative densities of MR-visible water in grey matter, white matter and cerebral spinal fluid were 0.78, 0.65, and 0.97, respectively (Ernst et al., 1993).
Statistical analyses.
Statistical analyses were conducted in MATLAB. We sought to determine whether the concentration of GABA+ and Glx or Glu were positively correlated across participants. To test this, we computed the Pearson correlation between GABA+ and either Glx or Glu for all spectra. Next, as described in our preregistration (https://osf.io/s3kzy/?view_only=519f07b8ada148fd830aeba5c9a4df08), to test whether the relationship between GABA+ and Glu could be explained by confounding factors, we systematically regressed out the influence of variables that could potentially account for observed relationships using a linear mixed effects model. We then computed the Pearson correlation between the residuals after controlling for the confounding factors. We reasoned that if the residual values remained correlated, the relationship between metabolites would hold when controlling for these confounding variables. To establish the influence of confounding factors, we considered each factor separately and calculated the (two-tailed) significance of the change in correlation by comparing z-scored correlation coefficients. Correlations were conducted using the Robust Correlations MATLAB toolbox (Pernet et al., 2013), with the (default) box-plot rule used to omit bivariate outliers. This led to differing numbers of exclusions per analysis denoted as a subscript in the reported statistics and the figure keys. Bayesian analyses were conducted in JASP (www.jasp-stats.org; Wagenmakers et al., 2018). Bayes factors were interpreted according to standard convention (Jeffreys, 1961; Table 1).
Table 1.
Evidence categories of Bayes Factors
| Bayes factor, BF 10 | Interpretation |
|---|---|
|
| |
| >100 | Extreme evidence for H1 |
| 30 – 100 | Very strong evidence for H1 |
| 10 – 30 | Strong evidence for H1 |
| 3 – 10 | Substantial evidence for H1 |
| 1 – 3 | Anecdotal evidence for H1 |
| 1 | No evidence |
| 1/3 – 1 | Anecdotal evidence for H0 |
| 1/10 – 1/3 | Substantial evidence for H0 |
| 1/30 – 1/10 | Strong evidence for H0 |
| 1/100 – 1/30 | Very strong evidence for H0 |
| <1/100 | Extreme evidence for H0 |
During data collection, there was an update to the 7T scanner, which enabled subject-specific B1 calibration, whereas before the upgrade we had used a constant reference voltage of 275V (appropriate for an average subject). We found that this change resulted in different average metabolite values before and after the upgrade. Thus, to control for the associated changes, all 7T metabolite values were first corrected for scanner version prior to analyses, using the linear mixed effects method described above. Similarly, for the 3T legacy data, we used linear mixed effects modelling to control for differences between studies, prior to conducting analyses.
RESULTS
We found strong evidence against a positive relationship between GABA+ and Glx in prefrontal cortex measured at 7 T (r185=.05, BF+0=0.18; Fig. 3a). We found a positive correlation between these metabolites measured at 3 T; however, as evidenced by the bimodal distribution of estimates from the two legacy datasets, this was likely due to differences between acquisition parameters. After controlling for differences between datasets, we found anecdotal evidence against a positive relationship between prefrontal GABA+ and Glx measured at 3T (r70=.15, BF+0=0.71; Fig. 3b). By contrast, we found extreme evidence for a positive relationship between GABA+ and Glu (r174=.43, BF+0=9.71e6; Fig. 3c).
Figure 3. Common ratio between GABA+ and Glu, but not Glx, in prefrontal cortex.
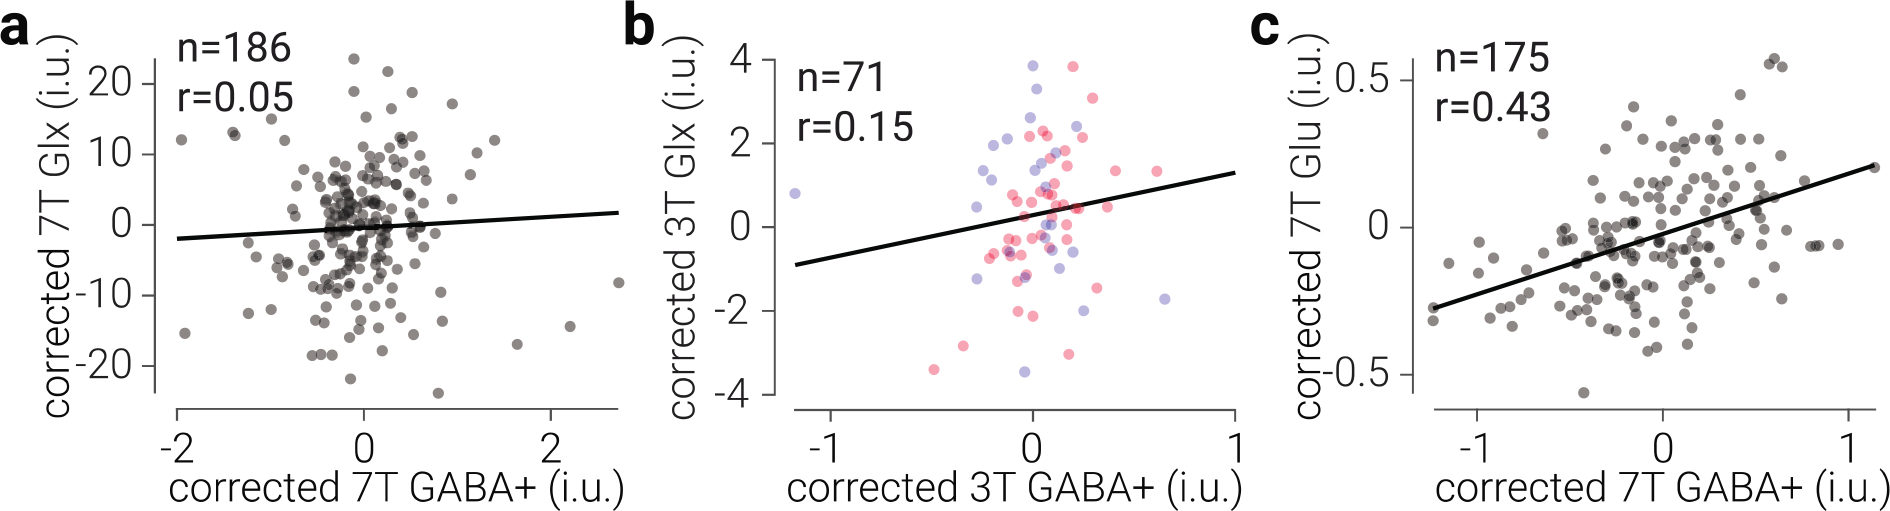
a) Glx concentration as a function of GABA+ concentration in prefrontal cortex, measured at 7 T. b) The same as (a), but measured at 3 T. d) Glu concentration as a function of GABA+ concentration in prefrontal cortex, measured at 7 T. Glx, Glu, and GABA+ values are tissue-corrected, referenced to water, expressed in institutional units (i.u.), and corrected for changes associated with different scanner software (7T) or studies (3T). Black lines indicate best linear fit; datapoints are semi-transparent, thus darker regions indicate overlap. Note, differences between quantification methods produced differential scaling of GABA+ and Glx relative to Glu concentration.
There are multiple factors that may influence the quantification of GABA+ and/or Glu with MRS. It is possible that the correlation between these neurotransmitters was produced by an additional moderating factor. To test this possibility, we assessed the relationship between GABA+ and Glu after systematically regressing out a range of possible confounding factors.
Age and gender.
The concentrations of GABA+ and Glx tends to be higher in adult males than females (O’Gorman et al., 2011), and decrease with age (Cassady et al., 2019; Gao et al., 2013; Sailasuta et al., 2008). However, we found no significant difference in the relationship between GABA+ and Glu after controlling for age and gender (z176=0.09, p=.928).
Spectral quality.
Although GABA+ and Glu signals were quantified from different spectra, signal quality is likely to be correlated between scans, e.g., due to participants’ propensity for head movement. This correlated signal quality may explain the relationship between GABA+ and Glu. That is, low signal quality could result in systematic misestimation of both GABA+ and Glu, producing a spurious positive correlation.
To assess this possibility, we regressed out the differences in four direct measures of signal quality (MEGA-sLASER and sLASER frequency drift, tNAA linewidth, and water linewidth) before re-testing the relationship between GABA+ and Glu. Frequency drift can occur from participant head motion or field gradient heating/cooling and can impact quantification of GABA+ by altering the efficiency with which its signal is edited (Harris et al., 2014; Hui et al., 2021). The editing efficiency of GABA+ decreases (modestly) with frequency drift in either direction (Harris et al., 2014; Hui et al., 2021). Similarly, if not properly corrected for, frequency drift can reduce the amplitude of the Glu signal by blurring the averaged spectra. Thus, frequency drift in both scans could produce a positive correlation between GABA+ and Glu. However, we found no significant difference in the relationship between GABA+ and Glu after controlling for frequency drift in either MEGA-sLASER (z175=0.08 p=.939) or semi-LASER scans (z175=0.31, p=.756). The linewidth of metabolite signals provides an indication of signal quality, as larger linewidths are associated with poorer spectral acquisition, e.g., due to participant head motion/geometry or inefficient shimming (Harris et al., 2014). However, we found no significant change in the correlation between GABA+ and Glu after controlling for either water (z175=0.02, p=.982) or tNAA linewidth (z175=0.15, p=.878).
Another (indirect) measure of spectral quality is the residual error associated with fitting models to metabolite signals, i.e., fit error. If the fit error is high, this suggests that the model is poorly fitting the signal and can indicate poor signal quality. Thus, we also included the fit error associated with GABA+ and Glu in our regression analysis. However, we found no significant difference in the correlation between GABA+ and Glu after controlling for either GABA+ (z180=0.66, p=.510) or Glu fit error (z175=0.19, p=.850).
Tissue composition.
GABA is approximately twice as highly concentrated in grey matter relative to white matter (Petroff et al., 1988), and negligible in cerebrospinal fluid. Although we corrected for voxel tissue composition (Gasparovic et al., 2006), it is possible that inter-individual differences in the fractional tissue composition within the MRS voxel may still have contributed to the relationship observed between GABA+ and Glu. However, we found no significant change in the correlation between these neurotransmitters after controlling for the proportion of grey matter (z175<0.01, p=.998).
Other neurochemicals.
Previous work reported that the relationship between GABA+ and Glx is moderated by the concentration of other neurochemicals (Rideaux, 2021; Steel et al., 2020). We found no significant change in the relationship between GABA+ and Glu after controlling for tCr (z179=0.13, p=.899), tNAA (z179=0.20, p=.841), or tCho (z177=0.14, p=.887). Similarly, we found no difference in the relationship between GABA+ and Glu after controlling for the concentration of water (z178=0.12, p=.903).
Regional specificity.
To test the regional specificity of these results, we ran the same analyses on a dataset collected from the same participants from a voxel targeting occipital cortex (Fig. 2). We had not planned to include this dataset in the current study, because the voxel location was approximately midway between those used by Steel et al. (2020) and Rideaux (2021), who found evidence for and against a relationship between GABA+ and Glx, respectively, and thus we considered the data were unlikely to be diagnostic in relation to the original study aims. However, considering the results found for data collected from prefrontal cortex – namely, no relationship between GABA+ and Glx but a significant relationship between GABA+ and Glu – we reasoned that repeating the same analyses on a dataset collected from a different cortical region would provide a test of the regional specificity of the findings.
In contrast to the results from prefrontal cortex, in occipital cortex we found extreme evidence for a positive relationship between both GABA+ and Glx (r183=.48, BF+0=3.50e9; Fig. 4a), and GABA+ and Glu (r176=.79, BF+0=4.83e36; Fig. 4b); however, the strength of the relationship between GABA+ and Glu was significantly stronger than that with Glx (z176=5.26, p=1.46e−7). We found stronger evidence for a positive correlation between GABA+ and Glu in occipital than prefrontal cortices (z174=5.75, p=8.68e−9). This may be due to a difference in the strength of the coupling between these neurometabolites in prefrontal and occipital regions; however, it may also be due to reduced signal quality in the data from prefrontal cortex, e.g., due to differences in voxel location relative to the receiver coils. Consistent with this, we found that NAA linewidth was broader (t192=5.93, p=1.39e−8) and GABA+ fit error was higher for the prefrontal than the occipital cortex data (t192=7.72, p=3.77e−12).
Figure 4. Common ratio between GABA+ and Glu and Glx in occipital cortex.
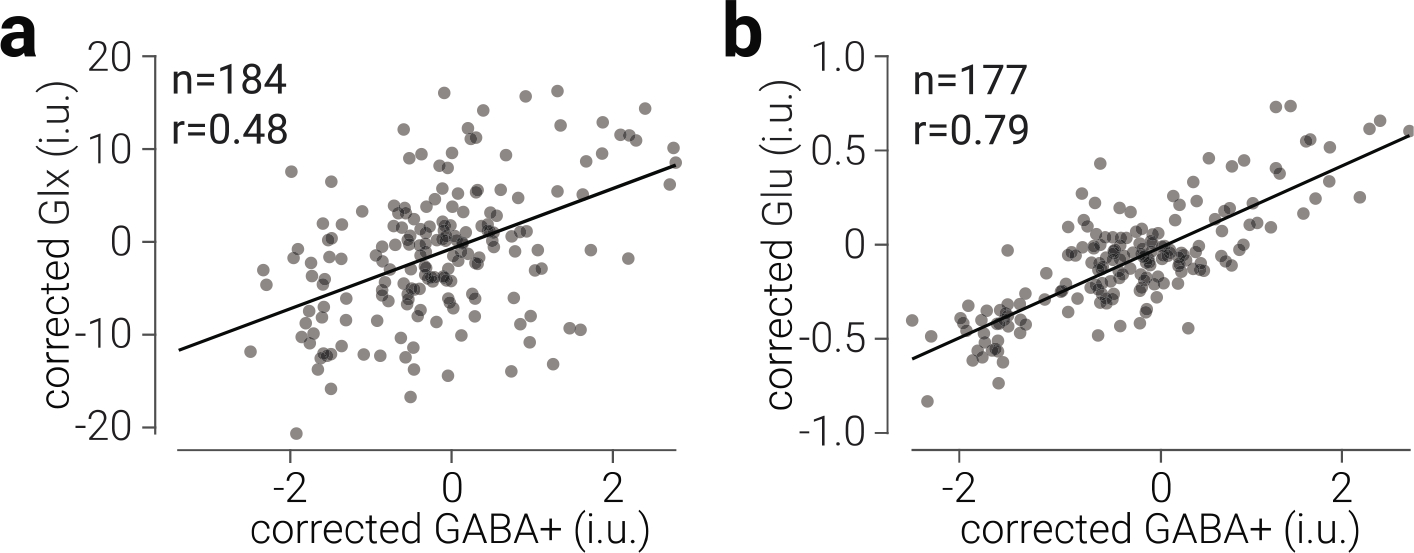
a) Glx concentration as a function of GABA+ concentration in occipital cortex. b) The same as (a), for Glu and GABA+. Glx, Glu, and GABA+ values are tissue-corrected, referenced to water, expressed in institutional units (i.u.), and corrected for changes associated with different scanner software. Black lines indicate best linear fit; datapoints are semi-transparent, thus darker regions indicate overlap.
We next measured the relationship between GABA+ and Glx and Glu, after controlling for potential confounding factors (Table 2). This analysis revealed that the factor that reduced the correlation between GABA+ and Glx and Glu in occipital cortex the most was the concentration of water (Glx: z181=1.68, p=.092; Glu: z177=2.571, p=.01). Importantly, however, evidence for the relationship between GABA+ and Glx and Glu remained extreme even after controlling for all confounding factors.
Table 2.
Probability of positive correlation between GABA+ and Glu and Glx in occipital cortex
| Confounding factor | Coefficient (r) (Glx | Glu) | Bayes factor BF+0 (Glx | Glu) |
|---|---|---|
|
| ||
| none | .48 | .79 | 3.50e9 | 4.83e36 |
| age and sex | .46 | .82 | 3.07e8 | 6.80e40 |
| GABA+ frequency drift | .46 | .80 | 3.00e8 | 1.06e38 |
| Glu frequency drift | .49 | .83 | 1.92e10 | 5.85e42 |
| water linewidth | .50 | .80 | 2.67e10 | 8.84e37 |
| tNAA linewidth | .46 | .80 | 2.90e8 | 2.48e37 |
| GABA+ fit error | .40 | .84 | 1.07e6 | 2.61e43 |
| Glx/Glu fit error | .54 | .81 | 4.53e12 | 4.92e39 |
| grey matter | .47 | .76 | 2.36e9 | 3.69e331 |
| tCr concentration | .37 | .82 | 7.56e3 | 2.83e40 |
| tNAA concentration | .51 | .83 | 2.50e10 | 9.69e41 |
| Cho concentration | .45 | .82 | 1.13e8 | 3.20e39 |
| water concentration | .33 | .67 | 6.63e2 | 4.04e21 |
Note: BF+0 denotes p(H1)/p(H0), where the alternate hypothesis (H1) is that there is a positive correlation between GABA+ and Glu; all Bayes factors indicate extreme evidence for the alternative hypothesis (Jeffreys, 1961).
Glutamate and Glutamine.
The Glx complex comprises Glu and Gln signals, so given that we found a relationship between GABA+ and Glu, we would expect to find a similar relationship between GABA+ and Glx. A possible explanation for why we did not find this in prefrontal cortex is that the relationship between GABA+ and Glu is obscured by the Gln signal, which may be either negatively correlated or uncorrelated with GABA+. In agreement with this, we found that while in occipital cortex GABA+ and Gln were positively correlated (r178=.25, BF±0=47.95), in prefrontal cortex these metabolites are not (r174=−.07, BF±0=0.51). Further, we found that while Glu was positively correlated with Glx in both frontal and occipital cortices, Gln was only positively correlated with Glx in prefrontal cortex (prefrontal, r162=.14, BF±0=0.47; occipital, r187=.05, BF±0=0.11) anecdotal and substantial evidence that there is no correlation between GABA+ and Gln in either prefrontal or occipital cortices, respectively (prefrontal, r162=.14, BF±0=0.47; occipital, r187=.05, BF±0=0.11).
DISCUSSION
Balanced excitatory and inhibitory activity is considered a canonical feature of healthy brain function (Shadlen & Newsome, 1994; Van Vreeswijk & Sompolinsky, 1996). The ratio between MRS-detected excitatory and inhibitory neurotransmitters is frequently used as an index of this balance. However, previous work testing whether there is a common ratio between these neurotransmitters across individuals has provided conflicting evidence (Rideaux, 2021; Steel et al., 2020), challenging the validity of this ratio as a proxy for E/I balance. To resolve these conflicting findings and test the validity of MRS-detected neurotransmitters as a proxy for E/I balance, here we used a large dataset of ultra-high field (7 T) MRS data from two brain regions to address whether i) a correlation between GABA+ and Glx is observed in other functionally complex cortices and ii) the presence of Gln in the Glx signal obscures a positive relationship between GABA and Glu. We found mixed evidence for a positive correlation between GABA+ and Glx. In prefrontal cortex, we found evidence against a positive relationship and replicated this result in a separate dataset tested at 3 T field strength, while in occipital cortex we found evidence for a positive relationship. By contrast, we found extreme evidence in favour of a positive correlation between GABA+ and Glu in both prefrontal and occipital cortices.
Previous work yielded inconsistent evidence for a common inter-individual ratio between GABA+ and Glx (Rideaux, 2020, 2021; Rideaux et al., 2019; Steel et al., 2020). Steel et al. (2020) found a positive relationship between GABA+ and Glx in the posterior cingulate gyrus, whereas Rideaux (2021) found evidence against a positive correlation in both visual and motor cortices. The discrepancy might be explained by differences in information processing between parietal, and visual and motor cortices. Visual and motor cortices are functionally specialised; early visual cortex supports processing of visual input from the retina via the lateral geniculate nucleus (Hubel & Wiesel, 1959, 1968) and the targeted motor area 1 (M1) hosts the representation of hand and fingers and supports voluntary hand movement (Hluštík et al., 2001; Penfield & Boldrey, 1937). By contrast, the medial parietal lobe behaves as an information processing hub; it is associated with a variety of perceptual and cognitive functions, including visual scene perception (Epstein et al., 2007; Silson et al., 2019), memory recall (Wagner et al., 2005), future prediction (Szpunar et al., 2007), and heading direction (Baumann & Mattingley, 2010). It is possible that a common ratio between GABA+ and Glx can be detected in functionally diverse, but not sensorimotor, cortices. However, we found evidence against a positive correlation between GABA+ and Glx in a region of prefrontal cortex associated with a diverse range of higher cognitive function.
The majority of published MRS work to date has been performed on high field (3 T) MRI scanners, due in part to hardware availability. As a result, MRS studies assessing E/I balance often use the ratio of GABA+ and Glx as an index, because both can be estimated from 3 T spectra produced by difference-edited sequences such as MEGA-PRESS. The Glx complex contains Glu signal, however, it also comprises Gln and GSH signal. Glu is the primary excitatory neurotransmitter in the central nervous system, whereas Gln and GSH have a variety of metabolic functions, including involvement in the synthesis of other metabolites. Previous (inconsistent) evidence on the validity of MRS-detected E/I balance relied on GABA+ and Glx (Rideaux, 2021; Steel et al., 2020). If there is a relationship between MRS-detected GABA and Glu, this relationship may be obscured when testing GABA and Glx, due to the additional metabolite signals that contribute to the Glx complex. Consistent with this, while we found evidence against a positive relationship between GABA+ and Glx in prefrontal cortex, we found extreme evidence for a common ratio between GABA+ and Glu in both prefrontal and occipital cortices. Further, the relationship between GABA+ and Glx in occipital cortex was significantly weaker than that with Glu. A related explanation is that the Glx signal estimated from MEGA edited sequences does not produce a sufficiently precise measurement of Glu to reliably detect a relationship with GABA+. These sequences have longer TEs (68–80 ms), which are optimized for GABA acquisition, whereas unedited sequences such as sLASER and PRESS use shorter TEs (30–42 ms), which are optimized for Glu or Glx acquisition.
It is possible that unlike GABA+ and Glu, the relationship between GABA+ and Glx is regionally specific. However, given we found a stronger positive correlation between GABA+ and Glu than Glx in occipital cortex, and the relationship between GABA+ and Glu in occipital cortex was also stronger than that the same relationship in prefrontal cortex, this suggests that the signal of the prefrontal data was not sufficiently strong to detect a putative relationship between GABA+ and Glx. Indeed, we found evidence that the linewidth and modelling residuals were both poorer for the prefrontal data. This would explain previous inconsistent findings; that is, if the relationship between GABA+ and Glx is significantly weaker that GABA+ and Glu, for the abovementioned reasons, it may not be a reliable marker of E/I balance.
Previous MRS work on the existence of a common ratio between inhibitory and excitatory neurotransmitters has produced conflicting evidence (Rideaux, 2021; Steel et al., 2020). Here we resolved this issue by demonstrating the existence of a regionally non-specific common ratio between GABA+ and Glu. By contrast and in line with previous inconsistent evidence (Rideaux, 2021; Steel et al., 2020), we found mixed and weaker evidence for a common ratio between GABA+ and Glx across individuals. These results are consistent with previous empirical (electrophysiological) (Anderson et al., 2000; Poo & Isaacson, 2009; Wehr & Zador, 2003; Wilent & Contreras, 2005) and theoretical work (Marín, 2012; Shadlen & Newsome, 1994; Van Vreeswijk & Sompolinsky, 1996; Vogels & Abbott, 2009) supporting E/I balance. Our findings indicate that MRS-detected GABA+ and Glu (but not Glx), can be used as a reliable indicator of E/I balance.
Acknowledgements:
This work was supported by grants from the Australian Research Council to PED and JBM (DP180101885), RR (DE210100790) and HLF (DE190100299) and from the Australian Department of Defence (Human Performance Research (HPR) Network Partnership) to PED, HLF, and JBM. JBM was supported by a National Health and Medical Research Council (Australia) Leadership (L3) Investigator Grant (GNT2010141). SE & YW acknowledge support through an Australian Government Research Training Program Scholarship. DKD and MM acknowledge the support of the National Institutes of Health grants BTRC P41 EB027061 and P30 NS076408. We thank Dr Muhammad Salah, Dr Steve C.N Hui, Dr Helge J. Zöllner and Dr Tonima Ali for helping to set up the protocol. We thank research radiographers, Nicole Atcheson and Aiman Al-Najjar, and Zoie Nott and Kali Chidley for assisting in data collection.
Footnotes
Conflict of interest statement: The authors declare no competing interests.
REFERENCES
- Anderson JS, Carandini M, & Ferster D (2000). Orientation tuning of input conductance, excitation, and inhibition in cat primary visual cortex. Journal of Neurophysiology, 84(2), 909–926. 10.1152/jn.2000.84.2.909 [DOI] [PubMed] [Google Scholar]
- Andreychenko A, Boer VO, Castro C. S. A. de, Luijten PR, & Klomp DWJ (2012). Efficient spectral editing at 7 T: GABA detection with MEGA-sLASER. Magnetic Resonance in Medicine, 68(4), 1018–1025. 10.1002/mrm.24131 [DOI] [PubMed] [Google Scholar]
- Ashburner J, & Friston KJ (2005). Unified segmentation. NeuroImage, 26(3), 839–851. 10.1016/j.neuroimage.2005.02.018 [DOI] [PubMed] [Google Scholar]
- Bang JW, Shibata K, Frank SM, Walsh EG, Greenlee MW, Watanabe T, & Sasaki Y (2018). Consolidation and reconsolidation share behavioural and neurochemical mechanisms. Nature Human Behaviour, 2(7), 507–513. 10.1038/s41562-018-0366-8 [DOI] [PMC free article] [PubMed] [Google Scholar]
- Baumann O, & Mattingley JB (2010). Medial parietal cortex encodes perceived heading direction in humans. Journal of Neuroscience, 30(39), 12897–12901. 10.1523/JNEUROSCI.3077-10.2010 [DOI] [PMC free article] [PubMed] [Google Scholar]
- Betina Ip I, Emir UE, Parker AJ, Campbell J, & Bridge H (2019). Comparison of neurochemical and BOLD signal contrast response functions in the human visual cortex. Journal of Neuroscience, 39(40), 7968–7975. 10.1523/JNEUROSCI.3021-18.2019 [DOI] [PMC free article] [PubMed] [Google Scholar]
- Bezalel V, Paz R, & Tal A (2019). Inhibitory and excitatory mechanisms in the human cingulate-cortex support reinforcement learning: A functional Proton Magnetic Resonance Spectroscopy study. NeuroImage, 184, 25–35. 10.1016/j.neuroimage.2018.09.016 [DOI] [PubMed] [Google Scholar]
- Bradford HF (1995). Glutamate, GABA and epilepsy. Progress in Neurobiology, 47(6), 477–511. 10.1016/0301-0082(95)00030-5 [DOI] [PubMed] [Google Scholar]
- Brown MS, Singel D, Hepburn S, & Rojas DC (2013). Increased glutamate concentration in the auditory cortex of persons with autism and first-degree relatives: A 1H-MRS study. Autism Research, 6(1), 1–10. 10.1002/aur.1260 [DOI] [PMC free article] [PubMed] [Google Scholar]
- Cassady K, Gagnon H, Lalwani P, Simmonite M, Foerster B, Park D, Peltier SJ, Petrou M, Taylor SF, Weissman DH, Seidler RD, & Polk TA (2019). Sensorimotor network segregation declines with age and is linked to GABA and to sensorimotor performance. NeuroImage, 186, 234–244. 10.1016/j.neuroimage.2018.11.008 [DOI] [PMC free article] [PubMed] [Google Scholar]
- Chao HT, Chen H, Samaco RC, Xue M, Chahrour M, Yoo J, Neul JL, Gong S, Lu HC, Heintz N, Ekker M, Rubenstein JLR, Noebels JL, Rosenmund C, & Zoghbi HY (2010). Dysfunction in GABA signalling mediates autism-like stereotypies and Rett syndrome phenotypes. Nature, 468(7321), 263–269. 10.1038/nature09582 [DOI] [PMC free article] [PubMed] [Google Scholar]
- Cudalbu C, Behar KL, Bhattacharyya PK, Bogner W, Borbath T, de Graaf RA, Gruetter R, Henning A, Juchem C, Kreis R, Lee P, Lei H, Marjańska M, Mekle R, Murali-Manohar S, Považan M, Rackayová V, Simicic D, Slotboom J, … Mlynárik V (2021). Contribution of macromolecules to brain 1H MR spectra: Experts’ consensus recommendations. NMR in Biomedicine, 34(5), e4393. 10.1002/nbm.4393 [DOI] [PMC free article] [PubMed] [Google Scholar]
- Edden RAE, Intrapiromkul J, Zhu H, Cheng Y, & Barker PB (2012). Measuring T2 in vivo with J-difference editing: Application to GABA at 3 tesla. Journal of Magnetic Resonance Imaging, 35(1), 229–234. 10.1002/jmri.22865 [DOI] [PMC free article] [PubMed] [Google Scholar]
- Egerton A, Brugger S, Raffin M, Barker GJ, Lythgoe DJ, Mcguire PK, & Stone JM (2012). Anterior Cingulate Glutamate Levels Related to Clinical Status Following Treatment in First-Episode Schizophrenia. Neuropsychopharmacology, 37, 2515–2521. 10.1038/npp.2012.113 [DOI] [PMC free article] [PubMed] [Google Scholar]
- Epstein RA, Parker WE, & Feiler AM (2007). Where am i now? Distinct roles for parahippocampal and retrosplenial cortices in place recognition. Journal of Neuroscience, 27(23), 6141–6149. 10.1523/JNEUROSCI.0799-07.2007 [DOI] [PMC free article] [PubMed] [Google Scholar]
- Ernst T, Kreis R, & Ross BD (1993). Absolute Quantitation of Water and Metabolites in the Human Brain. I. Compartments and Water. Journal of Magnetic Resonance, Series B, 102(1), 1–8. 10.1006/jmrb.1993.1055 [DOI] [Google Scholar]
- Filmer HL, Ehrhardt SE, Bollmann S, Mattingley JB, & Dux PE (2019). Accounting for individual differences in the response to tDCS with baseline levels of neurochemical excitability. Cortex, 115, 324–334. 10.1016/j.cortex.2019.02.012 [DOI] [PubMed] [Google Scholar]
- Ganji SK, Banerjee A, Patel AM, Zhao YD, Dimitrov IE, Browning JD, Sherwood Brown E, Maher EA, & Choi C (2012). T 2 measurement of J-coupled metabolites in the human brain at 3T: T 2 OF J-COUPLED METABOLITES AT 3T. NMR in Biomedicine, 25(4), 523–529. 10.1002/nbm.1767 [DOI] [PMC free article] [PubMed] [Google Scholar]
- Gao F, Edden RAE, Li M, Puts NAJ, Wang G, Liu C, Zhao B, Wang H, Bai X, Zhao C, Wang X, & Barker PB (2013). Edited magnetic resonance spectroscopy detects an age-related decline in brain GABA levels. NeuroImage, 78, 75–82. 10.1016/j.neuroimage.2013.04.012 [DOI] [PMC free article] [PubMed] [Google Scholar]
- Gasparovic C, Song T, Devier D, Bockholt HJ, Caprihan A, Mullins PG, Posse S, Jung RE, & Morrison LA (2006). Use of tissue water as a concentration reference for proton spectroscopic imaging. Magnetic Resonance in Medicine, 55(6), 1219–1226. 10.1002/mrm.20901 [DOI] [PubMed] [Google Scholar]
- Gu H, Hu Y, Chen X, He Y, & Yang Y (2019). Regional excitation-inhibition balance predicts default-mode network deactivation via functional connectivity. NeuroImage, 185, 388–397. 10.1016/j.neuroimage.2018.10.055 [DOI] [PMC free article] [PubMed] [Google Scholar]
- Harris AD, Glaubitz B, Near J, John Evans C, Puts NAJ, Schmidt-Wilcke T, Tegenthoff M, Barker PB, & Edden RAE (2014). Impact of frequency drift on gamma-aminobutyric acid-edited MR spectroscopy. Magnetic Resonance in Medicine, 72(4), 941–948. 10.1002/mrm.25009 [DOI] [PMC free article] [PubMed] [Google Scholar]
- Higley MJ, & Contreras D (2006). Balanced excitation and inhibition determine spike timing during frequency adaptation. Journal of Neuroscience, 26(2), 448–457. 10.1523/JNEUROSCI.3506-05.2006 [DOI] [PMC free article] [PubMed] [Google Scholar]
- Hluštík P, Solodkin A, Gullapalli RP, Noll DC, & Small SL (2001). Somatotopy in human primary motor and somatosensory hand representations revisited. Cerebral Cortex, 11(4), 312–321. 10.1093/cercor/11.4.312 [DOI] [PubMed] [Google Scholar]
- Horder J, Lavender T, Mendez MA, O’Gorman R, Daly E, Craig MC, Lythgoe DJ, Barker GJ, & Murphy DG (2013). Reduced subcortical glutamate/glutamine in adults with autism spectrum disorders: A [1H]MRS study. Translational Psychiatry, 3(April), 7–9. 10.1038/tp.2013.53 [DOI] [PMC free article] [PubMed] [Google Scholar]
- Hubel DH, & Wiesel TN (1959). Receptive fields of single neurones in the cat’s striate cortex. The Journal of Physiology, 148(3), 574–591. 10.1113/jphysiol.1959.sp006308 [DOI] [PMC free article] [PubMed] [Google Scholar]
- Hubel DH, & Wiesel TN (1968). Receptive fields and functional architecture of monkey striate cortex. The Journal of Physiology, 195(1), 215–243. 10.1113/jphysiol.1968.sp008455 [DOI] [PMC free article] [PubMed] [Google Scholar]
- Hui SCN, Mikkelsen M, Zöllner HJ, Ahluwalia V, Alcauter S, Baltusis L, Barany DA, Barlow LR, Becker R, Berman JI, Berrington A, Bhattacharyya PK, Blicher JU, Bogner W, Brown MS, Calhoun VD, Castillo R, Cecil KM, Choi YB, … Edden RAE (2021). Frequency drift in MR spectroscopy at 3T. NeuroImage, 241, 118430. 10.1016/j.neuroimage.2021.118430 [DOI] [PMC free article] [PubMed] [Google Scholar]
- Jeffreys H (1961). Theory of probability (3rd ed.). Oxford University Press, New York, NY. [Google Scholar]
- Kapogiannis D, Reiter DA, Willette AA, & Mattson MP (2013). Posteromedial cortex glutamate and GABA predict intrinsic functional connectivity of the default mode network. NeuroImage, 64(1), 112–119. 10.1016/j.neuroimage.2012.09.029 [DOI] [PMC free article] [PubMed] [Google Scholar]
- Kehrer C, Maziashvili N, Dugladze T, & Gloveli T (2008). Altered excitatory-inhibitory balance in the NMDA-hypofunction model of schizophrenia. Frontiers in Molecular Neuroscience, 1(APR). 10.3389/neuro.02/006.2008 [DOI] [PMC free article] [PubMed] [Google Scholar]
- Koizumi A, Lau H, Shimada Y, & Kondo HM (2018). The effects of neurochemical balance in the anterior cingulate cortex and dorsolateral prefrontal cortex on volitional control under irrelevant distraction. Consciousness and Cognition, 59(February), 104–111. 10.1016/j.concog.2018.01.001 [DOI] [PubMed] [Google Scholar]
- Marín O (2012). Interneuron dysfunction. 10.1038/nrn3155 [DOI] [PubMed]
- Marjańska M, Auerbach EJ, Valabrègue R, Van de Moortele P-F, Adriany G, & Garwood M (2012). Localized 1H NMR spectroscopy in different regions of human brain in vivo at 7 T: T2 relaxation times and concentrations of cerebral metabolites. NMR in Biomedicine, 25(2), 332–339. 10.1002/nbm.1754 [DOI] [PMC free article] [PubMed] [Google Scholar]
- Markram K, & Markram H (2010). The intense world theory—A unifying theory of the neurobiology of autism. Frontiers in Human Neuroscience, 4(December), 1–29. 10.3389/fnhum.2010.00224 [DOI] [PMC free article] [PubMed] [Google Scholar]
- Mescher M, Merkle H, Kirsch J, Garwood M, & Gruetter R (1998). Simultaneous in vivo spectral editing and water suppression. NMR in Biomedicine, 11(6), 266–272. [DOI] [PubMed] [Google Scholar]
- Near J, Harris AD, Juchem C, Kreis R, Marjańska M, Öz G, Slotboom J, Wilson M, & Gasparovic C (2021). Preprocessing, analysis and quantification in single-voxel magnetic resonance spectroscopy: Experts’ consensus recommendations. NMR in Biomedicine, 34(5). 10.1002/nbm.4257 [DOI] [PMC free article] [PubMed] [Google Scholar]
- O’Gorman RL, Michels L, Edden RAE, Murdoch JB, & Martin E (2011). In vivo detection of GABA and glutamate with MEGA-PRESS: Reproducibility and gender effects. Journal of Magnetic Resonance Imaging, 33(5), 1262–1267. 10.1002/jmri.22520 [DOI] [PMC free article] [PubMed] [Google Scholar]
- Okun M, & Lampl I (2008). Instantaneous correlation of excitation and inhibition during ongoing and sensory-evoked activities. NATURE NEUROSCIENCE VOLUME, 11(5). 10.1038/nn.2105 [DOI] [PubMed] [Google Scholar]
- Olsen RW, & Avoli M (1997). GABA and Epileptogenesis. Epilepsia, 38(4), 399–407. 10.1111/j.1528-1157.1997.tb01728.x [DOI] [PubMed] [Google Scholar]
- Penfield W, & Boldrey E (1937). Somatic Motor and Sensory Representation in Man. Brain, 389–443. [Google Scholar]
- Pernet CR, Wilcox R, & Rousselet GA (2013). Robust Correlation Analyses: False Positive and Power Validation Using a New Open Source Matlab Toolbox. Frontiers in Psychology, 3. 10.3389/fpsyg.2012.00606 [DOI] [PMC free article] [PubMed] [Google Scholar]
- Petroff OAC, Ogino T, & Alger JR (1988). High-Resolution Proton Magnetic Resonance Spectroscopy of Rabbit Brain: Regional Metabolite Levels and Postmortem Changes. Journal of Neurochemistry, 51(1), 163–171. 10.1111/j.1471-4159.1988.tb04850.x [DOI] [PubMed] [Google Scholar]
- Poo C, & Isaacson JS (2009). Odor Representations in Olfactory Cortex: “Sparse” Coding, Global Inhibition, and Oscillations. Neuron, 62(6), 850–861. 10.1016/j.neuron.2009.05.022 [DOI] [PMC free article] [PubMed] [Google Scholar]
- Posse S, Otazo R, Caprihan A, Bustillo J, Chen H, Henry P-G, Marjanska M, Gasparovic C, Zuo C, Magnotta V, Mueller B, Mullins P, Renshaw P, Ugurbil K, Lim KO, & Alger JR (2007). Proton echo-planar spectroscopic imaging ofJ-coupled resonances in human brain at 3 and 4 Tesla. Magnetic Resonance in Medicine, 58(2), 236–244. 10.1002/mrm.21287 [DOI] [PubMed] [Google Scholar]
- Provencher SW (1993). Estimation of metabolite concentrations from localized in vivo proton NMR spectra. Magnetic Resonance in Medicine, 30(6), 672–679. 10.1002/mrm.1910300604 [DOI] [PubMed] [Google Scholar]
- Puts NAJ, Barker PB, & Edden RAE (2013). Measuring the longitudinal relaxation time of GABA in vivo at 3 tesla. Journal of Magnetic Resonance Imaging, 37(4), 999–1003. 10.1002/jmri.23817 [DOI] [PMC free article] [PubMed] [Google Scholar]
- Rideaux R (2020). Temporal dynamics of GABA and Glx in the visual cortex. ENeuro, 7(4). 10.1523/ENEURO.0082-20.2020 [DOI] [PMC free article] [PubMed] [Google Scholar]
- Rideaux R (2021). No balance between glutamate+glutamine and GABA+ in visual or motor cortices of the human brain: A magnetic resonance spectroscopy study. NeuroImage, 237, 118191. 10.1016/j.neuroimage.2021.118191 [DOI] [PubMed] [Google Scholar]
- Rideaux R, Goncalves NR, & Welchman AE (2019). Mixed-polarity random-dot stereograms alter GABA and Glx concentration in the early visual cortex. Journal of Neurophysiology, 122(2), 888–896. 10.1152/jn.00208.2019 [DOI] [PMC free article] [PubMed] [Google Scholar]
- Rideaux R, Mikkelsen M, & Edden RAE (2021). Comparison of methods for spectral alignment and signal modelling of GABA-edited MR spectroscopy data. NeuroImage, 232, 117900. 10.1016/j.neuroimage.2021.117900 [DOI] [PMC free article] [PubMed] [Google Scholar]
- Rubenstein JLR, & Merzenich MM (2003). Model of autism: Increased ratio of excitation/inhibition in key neural systems. Genes Brain & Behavior, 2(5), 255–267. 10.1046/j.1601-183X.2003.00037.x [DOI] [PMC free article] [PubMed] [Google Scholar]
- Sailasuta N, Ernst T, & Chang L (2008). Regional variations and the effects of age and gender on glutamate concentrations in the human brain. Magnetic Resonance Imaging, 26(5), 667–675. 10.1016/j.mri.2007.06.007 [DOI] [PMC free article] [PubMed] [Google Scholar]
- Scheenen TWJ, Heerschap A, & Klomp DWJ (2008). Towards 1H-MRSI of the human brain at 7T with slice-selective adiabatic refocusing pulses. Magnetic Resonance Materials in Physics, Biology and Medicine, 21(1), 95. 10.1007/s10334-007-0094-y [DOI] [PMC free article] [PubMed] [Google Scholar]
- Shadlen MN, & Newsome WT (1994). Noise, neural codes and cortical organization. In Current Opinion in Neurobiology (Vol. 4). [DOI] [PubMed] [Google Scholar]
- Shibata K, Sasaki Y, Bang JW, Walsh EG, Machizawa MG, Tamaki M, Chang LH, & Watanabe T (2017). Overlearning hyperstabilizes a skill by rapidly making neurochemical processing inhibitory-dominant. Nature Neuroscience, 20(3), 470–475. 10.1038/nn.4490 [DOI] [PMC free article] [PubMed] [Google Scholar]
- Silson EH, Steel A, Kidder A, Gilmore AW, & Baker CI (2019). Distinct subdivisions of human medial parietal cortex support recollection of people and places. ELife, 8. 10.7554/eLife.47391 [DOI] [PMC free article] [PubMed] [Google Scholar]
- Smesny S, Gussew A, Biesel NJ, Schack S, Walther M, Rzanny R, Milleit B, Gaser C, Sobanski T, Schultz CC, Amminger P, Hipler UC, Sauer H, & Reichenbach JR (2015). Glutamatergic dysfunction linked to energy and membrane lipid metabolism in frontal and anterior cingulate cortices of never treated first-episode schizophrenia patients. Schizophrenia Research, 168(1–2), 322–329. 10.1016/j.schres.2015.07.013 [DOI] [PubMed] [Google Scholar]
- Sohal VS, & Rubenstein JLR (2019). Excitation-inhibition balance as a framework for investigating mechanisms in neuropsychiatric disorders. Molecular Psychiatry, 24(9), 1248–1257. 10.1038/s41380-019-0426-0 [DOI] [PMC free article] [PubMed] [Google Scholar]
- Steel A, Mikkelsen M, Edden RAE, & Robertson CE (2020). Regional balance between glutamate+glutamine and GABA+ in the resting human brain. NeuroImage, 220, 117112. 10.1016/j.neuroimage.2020.117112 [DOI] [PMC free article] [PubMed] [Google Scholar]
- Szpunar KK, Watson JM, & McDermott KB (2007). Neural substrates of envisioning the future. In Proceedings of the National Academy of Sciences of the United States of America (Vol. 104, Issue 2). 10.1073/pnas.0610082104 [DOI] [PMC free article] [PubMed] [Google Scholar]
- Takei Y, Fujihara K, Tagawa M, Hironaga N, Near J, Kasagi M, Takahashi Y, Motegi T, Suzuki Y, Aoyama Y, Sakurai N, Yamaguchi M, Tobimatsu S, Ujita K, Tsushima Y, Narita K, & Fukuda M (2016). The inhibition/excitation ratio related to task-induced oscillatory modulations during a working memory task: A multtimodal-imaging study using MEG and MRS. NeuroImage, 128, 302–315. 10.1016/j.neuroimage.2015.12.057 [DOI] [PubMed] [Google Scholar]
- Tkáč I, & Gruetter R (2005). Methodology of 1H NMR spectroscopy of the human brain at very high magnetic fields. Applied Magnetic Resonance, 29(1), 139–157. 10.1007/BF03166960 [DOI] [PMC free article] [PubMed] [Google Scholar]
- Van Vreeswijk C, & Sompolinsky H (1996). Chaos in neuronal networks with balanced excitatory and inhibitory activity. Science, 274(5293), 1724–1726. 10.1126/science.274.5293.1724 [DOI] [PubMed] [Google Scholar]
- Vattikuti S, & Chow CC (2010). A Computational Model for Cerebral Cortical Dysfunction in Autism Spectrum Disorders. Biological Psychiatry, 67(7), 672–678. 10.1016/j.biopsych.2009.09.008 [DOI] [PMC free article] [PubMed] [Google Scholar]
- Vogels TP, & Abbott LF (2009). Gating multiple signals through detailed balance of excitation and inhibition in spiking networks. NATURE NEUROSCIENCE VOLUME, 12(4). 10.1038/nn.2276 [DOI] [PMC free article] [PubMed] [Google Scholar]
- Wagenmakers E-J, Love J, Marsman M, Jamil Tahira, ·, Ly Alexander, Verhagen J, Selker Ravi, Gronau QF, Dropmann D, Boutin Bruno, Meerhoff F, Knight Patrick, Raj A, Van Kesteren E-J, Van Doorn J, Smíra Martiň, Epskamp S, Etz Alexander, Matzke D, … Morey D (2018). Bayesian inference for psychology. Part II: Example applications with JASP. Psychon Bull Rev, 25, 58–76. 10.3758/s13423-017-1323-7 [DOI] [PMC free article] [PubMed] [Google Scholar]
- Wagner AD, Shannon BJ, Kahn I, & Buckner RL (2005). Parietal lobe contributions to episodic memory retrieval. Trends in Cognitive Sciences, 9(9), 445–453. 10.1016/j.tics.2005.07.001 [DOI] [PubMed] [Google Scholar]
- Wansapura JP, Holland SK, Dunn RS, & Ball WS (1999). NMR relaxation times in the human brain at 3.0 tesla. Journal of Magnetic Resonance Imaging, 9, 531–538. [DOI] [PubMed] [Google Scholar]
- Wehr M, & Zador AM (2003). Balanced inhibition underlies tuning and sharpens spike timing in auditory cortex. In Nature (Vol. 426). [DOI] [PubMed] [Google Scholar]
- Wilent WB, & Contreras D (2005). Dynamics of excitation and inhibition underlying stimulus selectivity in rat somatosensory cortex. Nature Neuroscience, 8(10), 1364–1370. 10.1038/nn1545 [DOI] [PubMed] [Google Scholar]
- Xin L, Schaller B, Mlynarik V, Lu H, & Gruetter R (2013). Proton T1 relaxation times of metabolites in human occipital white and gray matter at 7 T. Magnetic Resonance in Medicine, 69(4), 931–936. 10.1002/mrm.24352 [DOI] [PubMed] [Google Scholar]