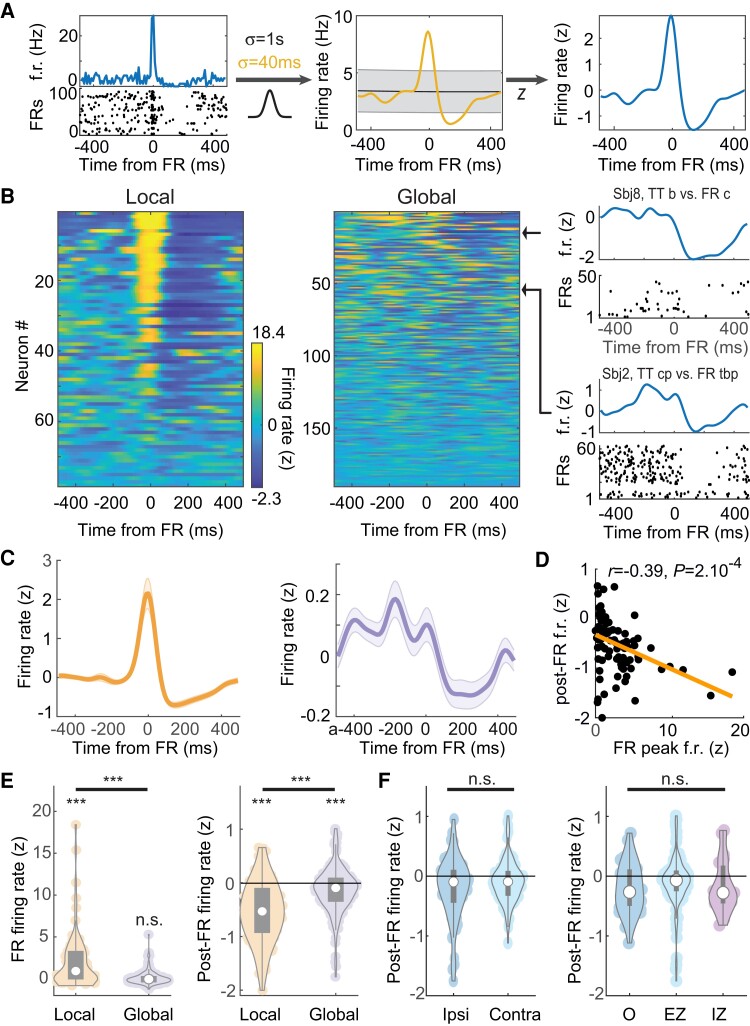
Figure 3.
Local and global modulation of neuronal activity with FRs. (A) Normalization of a sample single unit cross-correlogram relative to time of FRs. Time 0 corresponds to the occurrence of FRs. Left, Mean firing rate (f.r.) of the neuron relative to FR occurrence time (top) and raster plot of FR-by-FR spiking activity (bottom); middle, the cross-correlogram is convolved with two Gaussian filters of different width; right, the Z-scored normalized firing rate (see ‘Materials and methods’ section). (B) Normalized cross-correlograms of each single unit recorded at the local (same hybrid as FR) and global scale (different hybrid) relative to FRs. Colours display Z-scored firing rates. Cross-correlograms are sorted by their overall variance, from maximum (top) to minimum (bottom). Right, Two sample single units at the global range (titles indicate location of hybrids from which neuron and FRs were recorded). (C) Average local (left) and the global (right) cross-correlograms. (D) Post-FR firing rates as a function of FR peak firing rates in local networks. (E) Left, FR local and global peak firing rates; right, same for post-FR firing rates. (F) Left, Post-FR global firing rates for ipsi- and contralaterally located hybrid electrodes (i.e. hybrids on which FRs and neurons were monitored). Right, Same for the different statuses of the neuron-recording hybrid electrodes (O, healthy tissue). In E and F, white circles indicate the median, and grey rectangles the distribution of the first two quartiles around the median.

