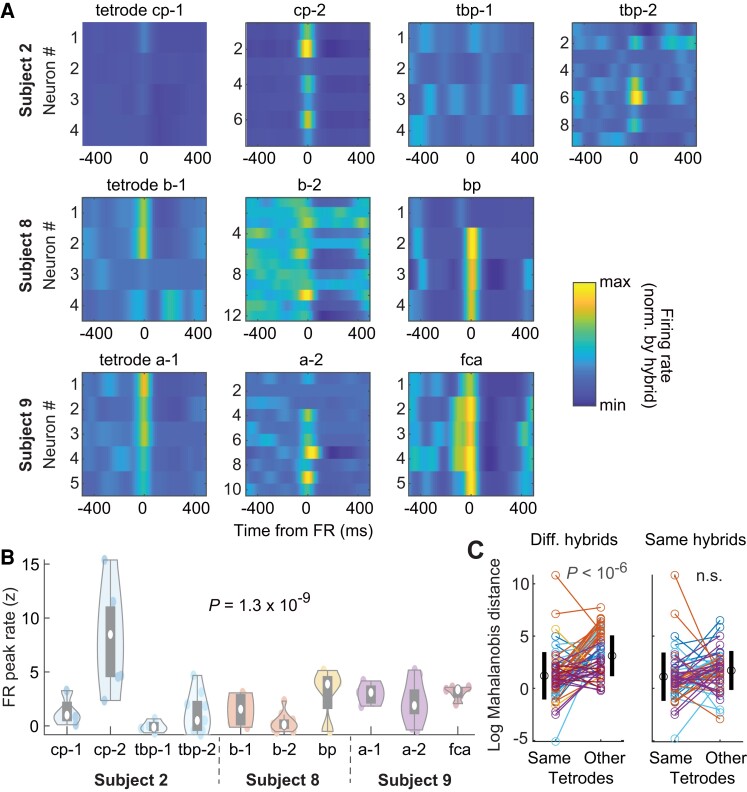
Figure 4.
Neuronal modulation by FRs in local networks. (A) Tetrode-by-tetrode neuronal cross-correlograms in three subjects (total of 6 hybrid electrodes and 60 single units). Colour indicates Z-scored firing rates from minimum (blue) to maximum (yellow) on each hybrid electrode. (B) Distribution of tetrode-by-tetrode peak FR firing rates. White circles indicate the median and grey rectangles the distribution of the first two quartiles around the median. (C) Comparison of cross-correlogram profiles (i.e. after compressing extreme values) between neurons of the same tetrodes or other tetrodes (see ‘Materials and methods’ section). Left, log Mahalanobis distance from each neuron to all other neurons from the same tetrodes and average distance to tetrodes on other hybrid electrodes. Black circles and vertical lines on the sides show average and SD, respectively. Right, Same as left but within tetrode distance in comparison to average distance to tetrodes from the same hybrid. Colour of each neuron indicates hybrid electrode of origin, as in B.

