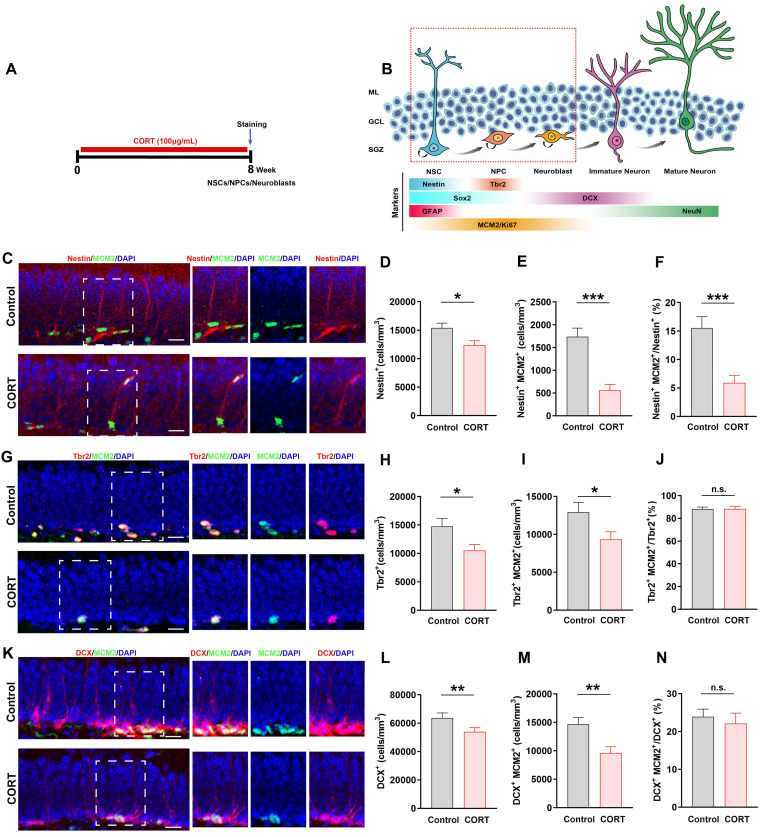
Figure 2.
Chronic CORT treatment depletes neural stem cells (NSCs), neural progenitor cells (NPCs), and neuroblasts, and impacts the proliferation of neural progenitor cells NSCs, NPCs, and neuroblasts. (A) Timeline of the experimental procedure for assessing adult hippocampal neurogenesis (AHN). (B) Diagram showing the AHN lineage and markers. (C) Representative images of the control and CORT DG with double immunostaining of Nestin+ (red) and MCM2+ (green) cells. (D) Quantification of Nestin+ cells. n = 4 mice per group, P = 0.0095. (E) Quantification of Nestin+MCM2+ cells. n = 4 mice per group, P < 0.0001. (F) Quantification of Nestin+MCM2+/Nestin+ cells. n = 3 mice per group, P = 0.0006. (G) Representative images of the control and CORT DG with double immunostaining of Tbr2+ (red) and MCM2+ (green) cells. (H) Quantification of Tbr2+ cells. n = 4 mice per group, P = 0.0200. (I) Quantification of Tbr2+MCM2+ cells. n = 4 mice per group, P = 0.0309. (J) Quantification of Tbr2+MCM2+/Tbr2+ cells. n = 4 mice per group, P = 0.9473. (K) Representative images of the control and CORT DG with double immunostaining of DCX+ (red) and MCM2+ (green) cells. (L) Quantification of DCX+ cells. n = 4 per group, P = 0.0436. (M) Quantification of DCX+MCM2+ cells. n = 4 per group, P = 0.0033. (N) Quantification of DCX+MCM2+/DCX+ cells. n = 3 mice per group, P = 0.6096. Scale bar = 20 μm. Data are presented as the mean ± SEM. Two-tailed unpaired t-test was used to identify statistically significant differences between datasets (*P < 0.05, **P < 0.01, ***P < 0.001 compared to the control group). n.s., non-significant difference.

