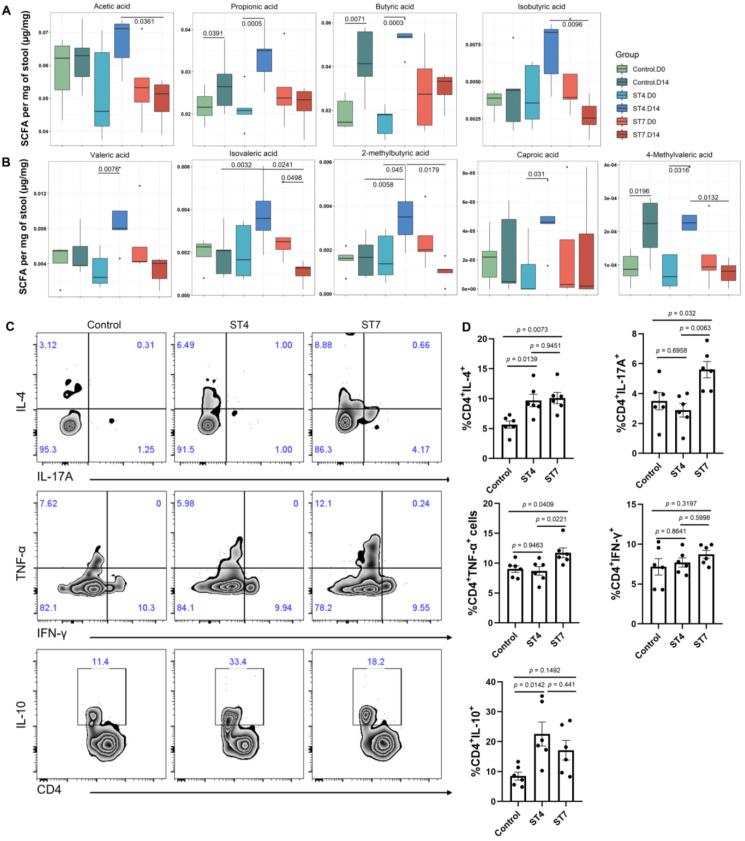
Figure 2.
Blastocystis ST4 and ST7 infection influence SCFAs production and colonic T helper cells. (A) The concentration of acetic, propionic, butyric, and isobutyric in control, ST4, and ST7 infected mice. (B) The concentration of valeric acid, isovaleric, 2-methylbutyric, and caproic acid, and 4-methylvaleric acid. (C) Zebra plots show staining for IL-4, IL-17A, TNF-α, IFN-γ and IL-10 within CD4+ T cells. (D) Bar charts show the percentage of IL-4, IL-17A, TNF-α, IFN-γ and IL-10 expressing CD4+ T cells. One-way ANOVA p-values adjusted for Tukey's multiple comparisons are shown. Data are representative of two independent experiments and shown as the mean ± SEM.

