Abstract
Objective
Idiopathic inflammatory myopathies (IIM) demonstrate characteristic clinical phenotypes depending on the myositis‐specific antibody (MSAs) present. We aimed to identify common or MSA‐specific immunological pathways in different immune cell types from peripheral blood by transcriptome analysis.
Methods
We recruited 33 patients with IIM who were separated into the following groups: 15 patients with active disease at onset and 18 with inactive disease under treatment. All patients were positive for MSAs: anti–melanoma differentiation‐associated gene 5 (MDA5) antibody (Ab) in 10 patients, anti‐Mi‐2 Ab in 7, and anti‐aminoacyl‐transfer RNA synthetase (ARS) Ab in 16. The patients were compared with 33 healthy controls. Twenty‐four immune cell types sorted from peripheral blood were analyzed by flow cytometry, RNA sequencing, and differentially expressed gene analysis combined with pathway analysis.
Results
The frequencies of memory B cell types were significantly decreased in active patients, and the frequency of plasmablasts was prominently increased in active patients with anti‐MDA5 Ab in comparison with healthy controls. The expression of type I interferon (IFN)‐stimulated genes of all immune cell types was increased in the active, but not inactive, patients. Endoplasmic reticulum stress‐related genes in all IIM memory B cells and oxidative phosphorylation‐related genes in inactive IIM double negative B cells were also increased, suggesting prominent B cell activation in IIM. Furthermore, active patients with anti‐MDA5 Ab, anti‐Mi‐2 Ab, or anti‐ARS Ab were distinguished by IFN‐stimulated and oxidative phosphorylation‐related gene expression in plasmablasts.
Conclusion
Unique gene expression patterns in patients with IIM with different disease activity levels and MSA types suggest different pathophysiologies. Especially, B cells may contribute to common and MSA‐specific immunological pathways in IIM.
INTRODUCTION
Idiopathic inflammatory myopathies (IIM) are rare systemic autoimmune diseases, and their precise etiologies remain unknown. These myopathies are heterogenous and include dermatomyositis (DM), juvenile DM, clinically amyopathic DM, inclusion body myositis, polymyositis (PM), and immune‐mediated necrotizing myopathies (1). Although only anti‐Jo‐1 antibody (Ab) is included in the classification criteria, it is widely recognized that the presence of myositis‐specific Ab (MSAs) and myositis‐associated Ab can help identify subgroups of IIM (2). Clinically common MSAs include Abs against melanoma differentiation‐associated gene 5 (MDA5), Mi‐2, aminoacyl‐transfer RNA synthetase (ARS) including Jo‐1, transcriptional intermediary factor 1γ, nuclear matrix protein 2, signal recognition particle, and 3‐hydroxy‐3‐methylglutaryl‐CoA reductase. Recently, genome‐wide association studies confirmed that alleles of the human leucocyte antigen 8.1 ancestral haplotype and other genes such as PTPN22 are important risk factors for IIM (3).
IIM pathogenesis is influenced by both genetic and environmental factors; however, the precise immune dysregulation underlying disease progression remains unclear. A role of adaptive and innate immunity was suggested by immunohistochemical analyses of muscle biopsy samples from patients with myositis. Infiltration of CD4 T cells, CD8 T cells, B cells, and dendritic cells has been identified in inflamed muscles (4, 5), and gene expression profiles of muscle biopsy samples are unique depending on the type of myositis (6).
The expression of type I interferon (IFN)–stimulated genes is significantly increased in patients with DM compared with patients with PM, not only in muscles but also in peripheral blood (7, 8). However, the clinical presentation of DM is clearly different from that of systemic lupus erythematosus (SLE), which is characterized by increased type I IFN–stimulated genes in immune cells. Therefore, it is difficult to explain the pathogenesis of IIM by type I IFN alone. Although muscle inflammation is a specific feature of IIM, immune cell types in peripheral blood might provide an immunological basis for inflammatory processes in muscle. In this study, we conducted immune cell phenotyping of as many as 24 immune cell types of peripheral blood mononuclear cells (PBMCs), by purifying the cells, in patients with IIM with different MSAs (anti‐MDA5, anti‐Mi‐2, and anti‐ARS Ab) and healthy controls (HCs), and we performed RNA sequencing (RNA‐seq). In addition to comparing gene expression profiles between patients with IIM and HCs, we investigated the transcriptional differences in patients with IIM at active disease onset without treatment according to MSA expression, to determine the MSA‐specific biological processes involved in disease progression.
PATIENTS AND METHODS
Study cohort
The IIM cohort comprised 33 patients with IIM. All patients fulfilled the criteria of Bohan and Peter for DM and PM (9) or the modified definition for CADM proposed by Sontheimer (10). Positivity for MSAs, including anti‐MDA5, anti‐Mi‐2, and anti‐ARS Ab, was assessed. We defined active patients with IIM as those recruited at disease onset without any treatment and inactive patients with IIM as those with a complete clinical response over 6 consecutive months with no evidence of disease activity while still receiving myositis therapy (11). Patients with IIM coexisting with malignancy, rheumatoid arthritis, and other connective tissue disease were excluded. The clinical characteristics of the patients are summarized in Supplementary Table 1. All HCs were age‐ and sex‐matched volunteers. The study was approved by the ethics committee of the University of Tokyo (G10095), and written informed consent was obtained from all participants.
Sample preparation
Our IIM cohort is part of the larger ImmuNexUT cohort (12). Briefly, human PBMCs were isolated from whole blood by centrifugation over Ficoll, and each immune cell type was sorted using a flow cytometer (FACS Aria Fusion [BD Biosciences]). The precise gating strategy used is presented in Supplementary Table 2. Neutrophils were purified using the MACSxpress Neutrophil Isolation Kit, human, and MACSxpress Erythrocyte Depletion Kit (Miltenyi Biotec). We collected 5000 cells per cell type.
RNA‐Seq
Total RNA was isolated using the MagMAX kit (Thermo Fisher Scientific) following the manufacturer's protocol. Neutrophils were collected using Trizol LS reagent (Invitrogen), and total RNA was extracted using the RNeasy micro kit (QIAGEN). Sequencing libraries were constructed using the SMART‐seq v4 Ultra Low Input RNA Kit (Clontech), and sequencing was performed using the HiSeq 2500 system (Illumina) with 100 bp paired‐end reads. Sequencing data in binary base call format was converted to FASTQ format using bcl2fastq2 v2.20.0 from Illumina. FASTQ files were aligned to the human genome within the UCSC Genome Browser (GRCh38; GenBank assembly GCA_000001405.18) using STAR (v2.5.3). HTSeq‐count (v0.11.2) was used to generate gene counts. Samples with a Phred quality score of more than 20 were selected using the FASTX‐Toolkit (v0.0.14). Genes were filtered to include those with raw read counts of at least 10 in at least 10% of each cell type library. The correlation coefficients between each pair of samples from the same cell type was calculated, and if the average of those correlation coefficients was less than 0.9, the sample was also removed from the analysis.
Identification of differentially expressed genes (DEGs) and pathway analysis
Genes with a read count of less than 10 in 90% or more of the samples were excluded. We used the edgeR (v3.18.1) package to calculate DEGs; run batch effects were removed, and raw count data were normalized by the trimmed mean of M values approach. The resulting P values were adjusted for multiple hypothesis testing and filtered to retain DEGs with a q‐value less than 0.05. ClusterProfiler was used to assess the enrichment of genes in biological pathways.
Calculation of signature score
To calculate the signature score of the gene set, we applied singular value decomposition after removing batch effects using ComBat software (13) and calculated the gene set eigengene, defined as the first singular vector of the expression matrix corresponding to the gene set. We used the singular value decomposition of the gene set as the signature score. The type I IFN signature genes (ISG) score was calculated using the response to type I IFN (GO:0034340) gene set (66 genes after removing human leucocyte antigen genes) from AmiGO 2, and the oxidative phosphorylation (OXPHOS) signature score was calculated using the hallmark oxidative phosphorylation gene set (200 genes).
Statistical analysis
Statistical analyses were performed using the Wilcoxon rank sum test when the sample size was greater than five. For multiple testing, Bonferroni's method was used to calculate corrected P values, and P < 0.05 was judged to be statistically significant. Using our expression data, false discovery rate (FDR)‐based hierarchical clustering was performed.
RESULTS
Changes in cell frequencies were most apparent in B cell types
Using multiparameter flow cytometry, we found alterations in the frequencies of several immune cell types among the parental cell lineage (Figure 1A and B). In comparisons of patients with active IIM, patients with inactive IIM, and HCs, patients with active IIM showed significantly decreased frequencies of unswitched memory B cells (USM B) and switched memory B cells (SM B) compared with HCs (P < 0.0000001 and P < 0.0000001, respectively) and patients with inactive IIM (P < 0.0001 and P < 0.00001, respectively). This result strongly suggests a common and essential role of memory B cells in IIM activity. Moreover, patients with active IIM with anti‐MDA5 Ab showed a significant increase in plasmablast frequency compared with HCs (P < 0.0001), an additional B cell–related feature. For immunological types other than B cells, the frequency of plasmacytoid dendritic cells (pDCs) was significantly increased in active patients compared with HCs, especially in patients with anti‐MDA5 Ab (P < 0.0001), suggesting a potential association of these cells with increased type I IFN activity. Compared with HCs, patients with active anti‐MDA5 Ab had decreased frequencies of nonclassical monocytes, potentially consistent with the monocyte activation indicated by an increased ferritin concentration reported in the sera of patients with anti‐MDA5 Ab. In addition, the frequencies of USM B and SM B were decreased in patients with active IIM harboring each MSA (Figure 1B). Collectively, the frequency of memory B cells demonstrated the most remarkable difference discriminating patients with active IIM from patients with inactive IIM. The frequencies of cell types in each patient are presented in Supplementary Figure 1.
Figure 1.
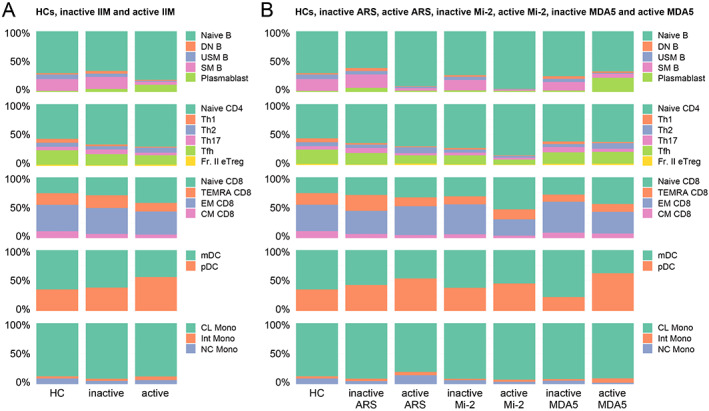
(A and B) The frequencies of each immune cell type among the parental cell lineage. From top to bottom, B cell, CD4 T cell, CD8 T cell, dendritic cell (DC), and monocyte (Mono) data are presented. The mean cell frequencies in healthy controls (HCs) and patients with inactive or active idiopathic inflammatory myopathy (IIM) are shown in (A). The mean cell frequencies in myositis‐specific antibody (MSA)‐positive patients with IIM according to active and inactive disease status are shown in (B). ARS, aminoacyl‐transfer RNA synthetase; CL, classical; CM, central memory; DN B, double negative B; EM, effector memory; Fr. II eTreg, fraction II effector regulatory T; Int, intermediate; MDA5, melanoma differentiation‐associated gene 5; mDC, myeloid DC; NC, non‐classical; pDC, plasmacytoid DC; SM B, switched memory B; TEMRA, terminally differentiated effector memory; Tfh, follicular helper T; Th1, T helpler 1; USM B, unswitched memory B.
Patients with active IIM are characterized by up‐regulation of genes associated with type I IFN, cell cycle, and endoplasmic reticulum stress in B cells
Using next‐generation sequencing, we performed transcriptome analysis and identified DEGs between active patients and HCs, as well as according to the MSA expressed. As shown in Figure 2A and B, pathway analysis of DEGs in active patients versus HCs revealed up‐regulation of type I IFN–stimulated genes in all immune cell types (Cluster A) and up‐regulation of cell cycle–related genes in T helper 1 cells (Th1), effector memory CD8 T cells (EM CD8), and double negative B cell (DN B) types (Cluster B). In DN B, USM B, and SM B types, genes related to endoplasmic reticulum (ER) stress were enriched among the DEGs (Cluster C). In monocyte types, neutrophil activation‐annotated pathways were enriched among the DEGs, and up‐regulated expression of monocyte activation‐related genes—such as S100 proteins (S100A8, S100A9, S100A12), FCGR3B, and CXCR2—was detected (Cluster D). Therefore, active patients share common immunological pathways.
Figure 2.
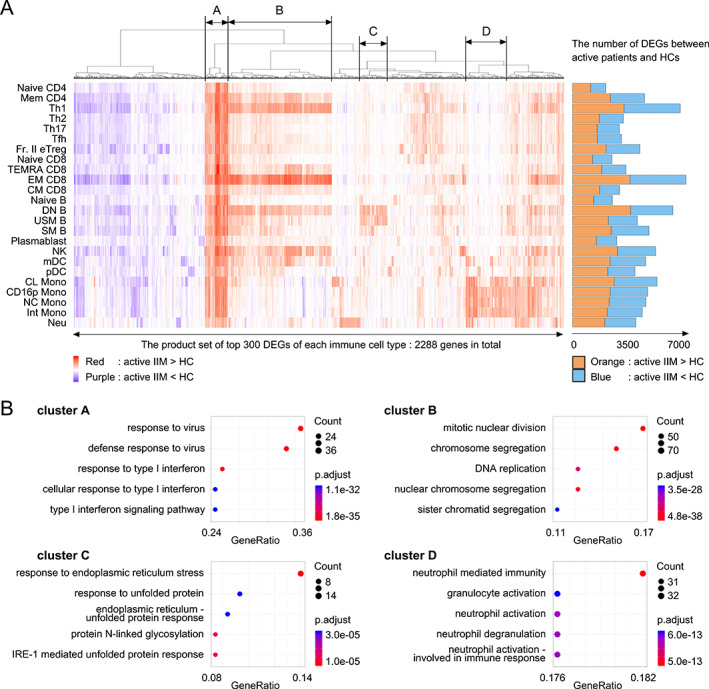
(A) Differentially expressed gene (DEG) analysis of patients with active idiopathic inflammatory myopathy (IIM) versus healthy controls (HCs). The top 300 DEGs calculated in each immune cell type were selected and subjected to FDR‐based hierarchical clustering. Red: genes up‐regulated in patients with IIM versus HCs. Purple: genes down‐regulated in patients with IIM versus HCs. The numbers of DEGs in each immune cell type are presented as a bar graph on the right. Orange: genes up‐regulated in patients with IIM versus HCs. Blue: genes down‐regulated in patients with IIM versus HCs. (B) Pathway analysis of clusters A, B, C, and D identified in Figure 2A performed using ClusterProfiler. CL, classical; CM, central memory; CD16p, CD16 positive; DN B, double negative B; EM, effector memory; FDR, false discovery rate; Fr. II eTreg, fraction II effector regulatory T; Int, intermediate; MDA5, melanoma differentiation‐associated gene 5; mDC, myeloid DC; NC, non‐classical; NK, natural killer, Neu, neutrophil; pDC, plasmacytoid DC; SM B, switched memory B; TEMRA, terminally differentiated effector memory; Tfh, follicular helper T; Th1, T helpler 1; USM B, unswitched memory B.
Subclinical DN B and SM B signatures persist in patients with inactive IIM under treatment
The fact that patients with IIM in the inactive phase also relapse at a certain rate suggests that a significant level of immune modification persists even in the inactive phase. It is important to identify these persistent immune modifications as they may interfere with drug‐free remission. While DEGs between inactive patients and HCs were relatively few compared with those between active patients and HCs, DEGs between inactive patients and HCs were prominent in DN B and SM B (Figure 3A), suggesting an essential role of these cell types in IIM. Pathway analysis of the DEGs in DN B showed enrichment of OXPHOS‐related genes (Figure 3B). Genes encoding multiple proteasomal subunits were enriched among the DEGs in SM B, indicating increased degradation of unnecessary or damaged proteins related to cellular stress. Notably, type I IFN–stimulated genes were not enriched among any DEGs in any immune cell type. Whereas SLE exhibits strong residual IFN signaling even in the inactive phase (14), the absence of strong residual IFN signaling in the inactive phase of IIM may be related to the difference in pathogenesis between IIM and SLE.
Figure 3.
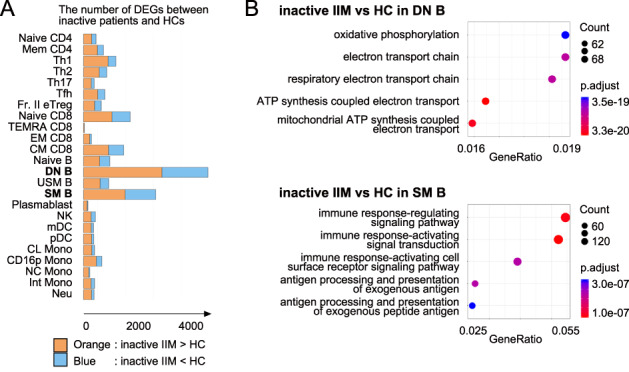
(A) Differentially expressed gene (DEG) analysis between inactive idiopathic inflammatory myopathy (IIM) patients and healthy controls (HCs). The numbers of DEGs (FDR < 0.05) in each immune cell type presented as a bar graph. Orange: genes up‐regulated in patients with IIM. Blue: genes down‐regulated in patients with IIM. (B) Pathway analysis of DEGs in double negative B cell (DN B) (upper) and switched memory B cells (SM B) (lower) performed using ClusterProfiler. CL, classical; CM, central memory; CD16p, CD16 positive; DN B, double negative B; EM, effector memory; FDR, false discovery rate; Fr. II eTreg, fraction II effector regulatory T; Int, intermediate; MDA5, melanoma differentiation‐associated gene 5; mDC, myeloid DC; NC, non‐classical; NK, natural killer; Neu, neutrophil; pDC, plasmacytoid DC; SM B, switched memory B; TEMRA, terminally differentiated effector memory; Tfh, follicular helper T; Th1, T helpler 1; USM B; unswitched memory B.
Identification of activation‐related immunological pathways specific to each MSA
Next, to identify activation‐related immunological pathways specific to each MSA, we analyzed DEGs between active and inactive patients in each MSA‐positive patient group. Although the DEGs between active and inactive patients with each MSA type were especially increased in EM CD8 T cells, the implicated pathways were not identical among the different MSAs (Figure 4A). Cell cycle–related pathways were enriched among the DEGs in EM CD8 T cells from patients with anti‐MDA5 Ab or anti‐Mi‐2 Ab, whereas proteasomal subunit genes were enriched mainly among the DEGs from patients with anti‐ARS Ab (Figure 4B). Type I IFN–stimulated genes were enriched among plasmablast DEGs in active versus inactive patients with anti‐MDA5 Ab, whereas ATP synthesis–related genes, which consisted mostly of electron transport chain complex genes, were enriched among plasmablast DEGs in active versus inactive patients with anti‐ARS Ab, suggesting increased OXPHOS (Figure 4C). Innate immune cell types (natural killer cells and monocytes) exhibited a larger number of DEGs between active and inactive patients with anti‐MDA5 Ab. The number of DEGs between active and inactive patients with anti‐ARS Ab was also increased in Fraction II effector regulatory T cells (Fr II. eTregs), with enrichment of T cell activation genes (data not shown).
Figure 4.
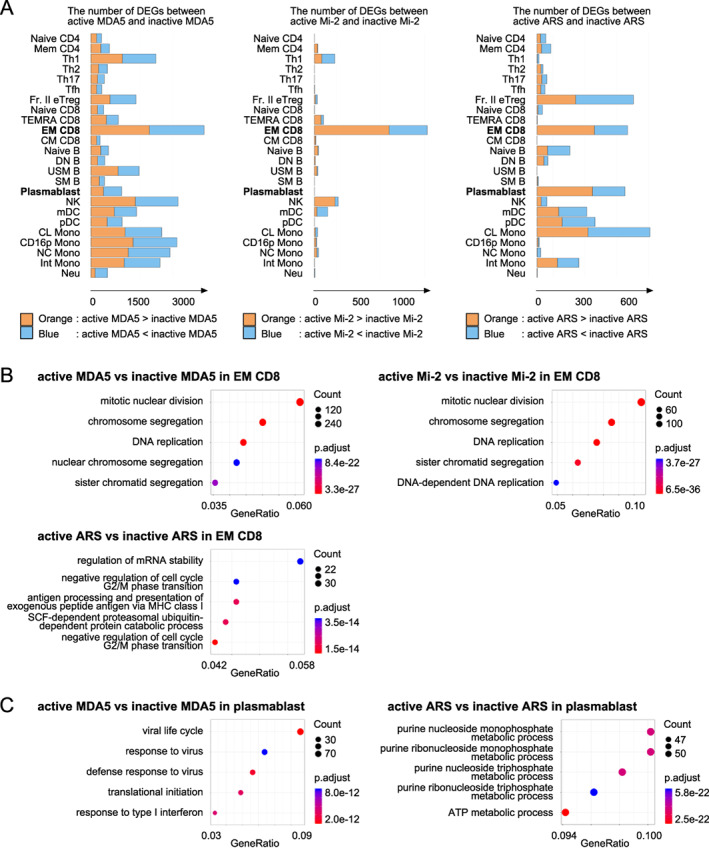
(A) Differentially expressed gene (DEG) analysis between patients with active and patients with inactive idiopathic inflammatory myopathy (IIM) expressing each myositis‐specific antibody (MSA): antimelanoma differentiation associated gene 5 (MDA5) antibody (Ab) (left), anti‐Mi‐2 Ab (center), and anti‐aminoacyl‐transfer RNA synthetase (ARS) Ab (right). (B and C) Pathway analysis of DEGs in effecter memory CD8 (EM CD8) T cells and plasmablasts performed using ClusterProfiler. (B) Anti‐MDA5 Ab‐positive patients (upper left), anti‐Mi‐2 Ab‐positive patients (upper right), and anti‐ARS Ab‐positive patients (lower left) in EM CD8. (C) Anti‐MDA5 Ab‐positive patients (left) and anti‐ARS Ab‐positive patients (right) in plasmablasts. CL, classical; CM, central memory; CD16p, CD16 positive; DN B, double negative B; EM, effector memory; Fr. II eTreg, fraction II effector regulatory T; Int, intermediate; MDA5, melanoma differentiation‐associated gene 5; mDC, myeloid DC; NC, non‐classical; NK, natural killer; Neu, neutrophil; pDC, plasmacytoid DC; SM B, switched memory B; TEMRA, terminally differentiated effector memory; Tfh, follicular helper T; Th1, T helpler 1; USM B; unswitched memory B.
Oxidative phosphorylation is a characteristic of plasmablasts in patients with active IIM with anti‐MDA5 Ab
Next, to identify the pathways specifically associated with each MSA in detail, we directly compared different cell populations according to the MSA type. We identified the DEGs in active patients according to the MSA expressed: anti‐MDA5 versus anti‐Mi‐2, anti‐MDA5 versus anti‐ARS, and anti‐Mi‐2 versus Anti‐ARS. In particular, we focused on plasmablasts because these cells are directly related to Ab production, and the increase in plasmablast frequency was the most significant in active patients with anti‐MDA5 Ab. The number of DEGs in plasmablasts was increased in active patients with anti‐MDA5 Ab or anti‐ARS Ab compared with active patients with antiMi‐2 Ab (Figure 5A). Consistent with the DEG comparison between active and inactive patients according to MSA, OXPHOS pathways were enriched among the DEGs in active patients with anti‐MDA5 Ab versus active patients with anti‐Mi‐2 Ab, as well as in active patients with anti‐ARS Ab versus active patients with anti‐Mi‐2 Ab, whereas type I IFN signaling pathways were enriched among the DEGs in active patients with anti‐MDA5 Ab versus active patients with anti‐ARS Ab (Figure 5B). These three different groups of MSA‐positive patients were divided by the combined ISG and OXPHOS signatures in plasmablasts (Figure 5C). Principal component analysis using all of the plasmablast DEGs detected above was able to discriminate the three groups of patients (Figure 5D). Pathway analyses of the 300 genes with the highest factor loading scores from the first and second principal coordinates revealed enrichment of type I IFN signaling and OXPHOS pathways, respectively (Supplementary Figure 2), supporting that these MSA‐positive patients can be distinguished by the ISG and OXPHOS signatures.
Figure 5.
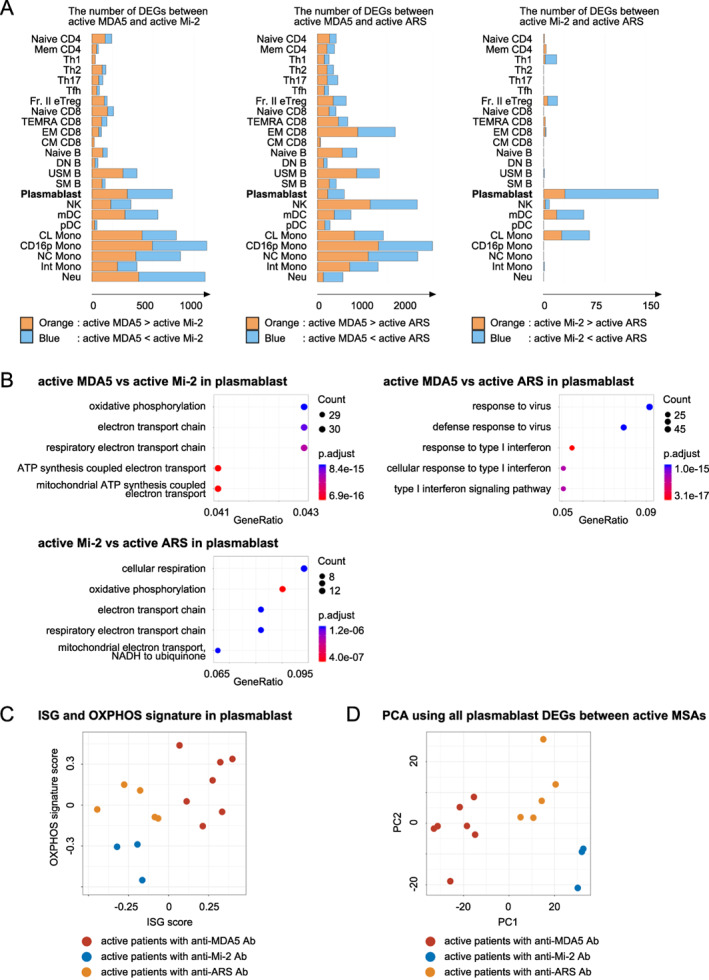
(A) Differentially expressed gene (DEG) analysis in patients with active idiopathic inflammatory myopathy (IIM) according to myositis‐specific antibodies (MSAs). The numbers of DEGs (FDR < 0.05) in each immune cell type in patients with anti‐melanoma differentiation‐associated gene 5 (MDA5) antibodies (Ab) versus anti‐Mi‐2 Ab (left), patients with anti‐MDA5 Ab vs. anti‐aminoacyl‐transer RNA synthetase (ARS) Ab (center), and patients with anti‐Mi‐2 Ab versus anti‐ARS Ab (right). (B) Pathway analysis of DEGs in plasmablasts calculated in panel A performed using ClusterProfiler. The results from patients with anti‐MDA5 Ab versus anti‐Mi‐2 Ab (upper left), patients with anti‐MDA5 Ab versus anti‐ARS Ab (upper right), and patients with anti‐Mi‐2 Ab versus anti‐ARS Ab (lower left). (C) Plots of the type I IFN signature gene (ISG) score and oxidative phosphorylation (OXPHOS) signature score in plasmablasts. Red: patients with active IIM with antiMDA5 Ab. Blue: patients with active IIM with anti‐Mi‐2 Ab. Orange: patient with active IIM with anti‐ARS Ab. (D) Principal component analysis of all DEGs in plasmablasts. All plasmablast DEGs (FDR < 0.05) in patients with active IIM with each MSA type were combined. Red: patients with active IIM with anti‐MDA5 Ab. Blue: patients with active IIM with anti‐Mi‐2 Ab. Orange: patients with active IIM with anti‐ARS Ab. CL, classical; CM, central memory; CD16p, CD16 positive; DN B, double negative B; EM, effector memory; FDR, false discovery rate; Fr. II eTreg, fraction II effector regulatory T; Int, intermediate; MDA5, melanoma differentiation‐associated gene 5; mDC, myeloid DC; NC, non‐classical; NK, natural killer; Neu, neutrophil; pDC, plasmacytoid DC; SM B, switched memory B; TEMRA, terminally differentiated effector memory; Tfh, follicular helper T; Th1, T helpler 1; USM B; unswitched memory B.
DISCUSSION
Our analysis combining flow cytometric and transcriptomic data revealed common and specific immunological modifications in IIM, especially in B cells. B cells in patients with active IIM generally showed transcriptomic modifications related to ISG and ER stress. In contrast, combination of the ISG and OXPHOS signatures in plasmablasts differentiated patients in the active phase according to MSA. In parallel with these B cell modifications, cell activation indicated by increased cell cycling was observed in T cells including Th1 and EM CD8 T cells.
A decreased frequency of memory B cells might be caused by their recruitment to muscles and/or their increased rate of differentiation into plasmablasts. In patients with active DM, histological B cell enrichment in muscles was reported to occur in parallel with ISG expression, suggesting B cell importance in IIM pathogenesis (15). Many reports have revealed that type I IFN–stimulated genes in both PBMCs and skeletal muscles play a crucial role in IIM pathogenesis (16). The increased pDC frequency in patients with active IIM might induce up‐regulated type I IFN production, being compatible with up‐regulated ISG expression in immune cell types in patients with active IIM. The main source of type 1 IFN, pDCs, were previously reported to be abundant in DM muscles (5).
The existence of some disease‐activity–related, immune‐cell–specific biological pathways other than type I IFN signaling pathways was suggested by the DEG analysis. Genes related to cell cycle were up‐regulated in Th1 cells, EM CD8 T cells, and DN B, which might reflect cell proliferation subsequent to stimulation‐induced activation (17). Up‐regulation of activation‐related genes in monocytes and ER stress‐related genes in DN B, SM B, and USM B also seemed to reflect myositis activity. Notably, the expression of IIM‐activity–related type I IFN–stimulated genes was absent in patients with inactive IIM under treatment. Although the number of DEGs between patients with inactive IIM and HCs was low, the number in DN B was relatively high, and pathway analysis of these DEGs revealed enrichment of OXPHOS‐related genes. Considering the maintained expression of these genes in DN B under inactive conditions, metabolic rearrangement reflecting subclinical activity might persist in DN B even after treatment and/or DN B might provide a useful biomarker of residual disease activity.
Our analysis also revealed MSA‐specific gene expression modifications as well as common modifications in IIM. The DEG analysis of each MSA‐positive patient group with an active versus inactive disease status suggested that the disease‐activity–related gene signature was differentially regulated depending on the MSA type. In the plasmablast DEGs of patients with active IIM, we found differences according to the MSA present: type I IFN–stimulated genes were enriched in patients with anti‐MDA5 Ab, electron transport chain complex genes were enriched in patients with anti‐ARS Ab, and few DEGs were detected in patients with anti‐Mi‐2 Ab. Although DEGs in EM CD8 T cells were abundant in all MSA‐positive patients, enrichment of cell cycle–related genes was found in patients with anti‐MDA5 or anti‐Mi‐2 Ab, whereas proteasomal complex genes were enriched among the DEGs of patients with anti‐ARS Ab. Moreover, in patients with anti‐ARS Ab, the number of DEGs was higher in Fr. II eTregs than in the other immune cell types. As Tregs are reportedly important for damaged skeletal muscle repair in aged mice (18), gene expression changes in Tregs might reflect ongoing muscle damage, as well as pathogenic processes, especially in patients with anti‐ARS Ab.
Although active patients with anti‐MDA5 Ab were characterized by their plasmablast phenotype compared with patients with other MSAs, gene expression was affected mainly in innate immune cell types during activation in patients with anti‐MDA5 Ab. As a high titer of anti‐MDA5 Ab was reported to be a prognostic marker of acute death with rapidly progressive interstitial lung disease (19), anti‐MDA5 Ab itself might be closely related to pathogenesis, and plasmablast differentiation was accelerated more prominently in active patients with anti‐MDA5 Ab compared with active patients with other MSAs. In addition, patients with IIM with anti‐MDA5 Ab also showed a decreased frequency of nonclassical monocytes, which might reflect their recruitment to damaged organs, such as the lungs, for tissue repair and removal of damaged or dead cells (20). Based on these findings, we focused on differences in gene expression, especially in plasmablasts, in patients with active IIM according to MSA type. ISG expression was highest in patients with anti‐MDA5 Ab. Considering that MDA5 is a protein encoded by the interferon‐induced helicase C domain‐containing protein 1 gene (a typical ISG), the production of anti‐MDA5 Ab itself might be closely related to high ISG, underlying their disease progression. Interestingly, we revealed that active patients with anti‐MDA5, anti‐Mi‐2, or anti‐ARS Ab were categorized by their ISG and OXPHOS signatures in plasmablasts, suggesting that ISG expression and metabolic status in plasmablasts were differentially regulated depending on the MSA type in patients with active IIM (Figure 6).
Figure 6.
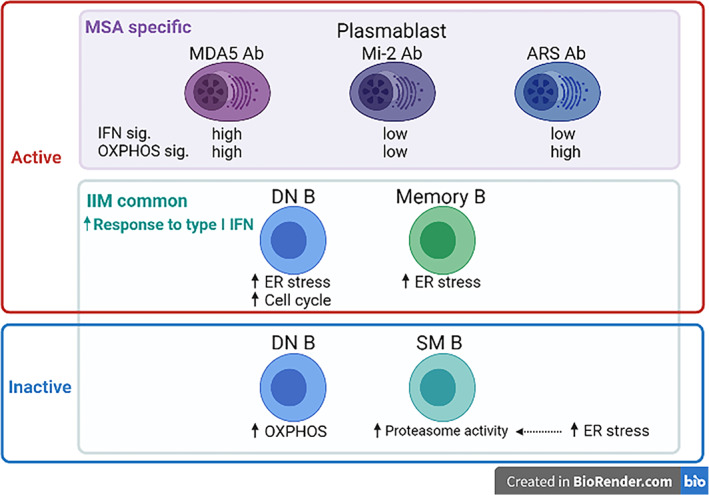
Proposed model of B cell modification during idiopathic inflammatory myopathy (IIM) progression. The presence of common biological pathways as well as myositis‐specific antibodies (MSA)‐specific pathways was suggested by our transcriptome‐based analysis. This schema was created using BioRender.com. ARS, aminoacyl‐transfer RNA synthetase; DN B, double negative B; MDA5, melanoma differentiation‐associated gene 5; SM B, switched memory B; USM B; unswitched memory B.
Our study has several limitations. First, the number of patients analyzed was relatively small because this was a single‐center study, and the number of active patients recruited at onset was especially small. The MSAs evaluated were limited to anti‐MDA5, anti‐Mi‐2, and anti‐ARS Ab. In addition, some patients were not positive for any MSAs examined. The low sample number could have statistically affected the DEG calculations. We did not perform DEG analysis among MSA‐positive patients with inactive disease activity because the results seemed to be difficult to interpret as to whether the MSA type or immunosuppressive treatment had a greater effect. Second, we analyzed immune cell types among PBMCs only, and we could not rule out the possibility that pathogenic processes are easier to detect in immune cell types in damaged muscles. Third, using only transcriptomic data, it was impossible to demonstrate whether the detected mRNA expression profiles were truly pathogenic or merely reflect inflammatory responses in patients with IIM. Several genome‐wide association studies have revealed as few as approximately 70 single nucleotide polymorphisms so far, mainly because of IIM heterogeneity, and there are technical barriers to performing expression quantitative trait locus analysis using limited whole genome sequencing data.
In conclusion, our findings suggest the importance of B cells in patients with IIM. The frequencies of PBMC types and disease‐activity–related DEGs support that a certain pathogenic process occurs during differentiation from DN B to plasmablasts. Patients with IIM with anti‐MDA5 Ab were characterized by a high number of plasmablasts among PBMCs and a strong OXPHOS signature that suggested drastic metabolic changes in disease activity status. We also found that active patients with anti‐MDA5, anti‐Mi‐2, and anti‐ARS Ab could be distinguished by the combined expression patterns of ISG and OXPHOS signature genes in plasmablasts. This is useful not only for potential biomarker application but also for comprehending pathogenesis in clinical settings. We also showed that immune cell–specific biological pathways differed according to the MSA type during activation. We acknowledge that our PBMC sample size was too limited for detecting weak or moderate effects of the MSAs, and a study with larger sample sizes in combination with muscle biopsy samples will be needed for future investigation. Our data provide clues for complex immune cell contributions to IIM pathogenesis. In addition to B cells, other immune cell types—such as Th1 cells, EM CD8 T cells, and Fr II. eTregs—might play crucial roles in IIM pathogenesis.
AUTHOR CONTRIBUTIONS
Dr. Iwasaki was involved in drafting and revising the article or revising it critically for important intellectual content and all authors approved the final version to be published. Dr. Fujio had full access to all of the data in the study and takes responsibility for the integrity of the data and the accuracy of the data analysis.
Study conception and design
Fujio.
Acquisition of data
Takeshima, Okubo, Kobayashi, Hatano, Yamada, Nakano, Yoshida, Ota, Tsuchida, Nagafuchi, Shimane, Yoshida, Kurosaka, Sumitomo, Shoda.
Analysis and interpretation of data
Sugimori, Iwasaki.
ROLE OF THE STUDY SPONSOR
The funding source(s) had no role in the study design or in the collection, analysis, or interpretation of the data, the writing of the manuscript, or the decision to submit the manuscript for publication. Publication of this article was not contingent upon approval by the funding sources.
Supporting information
Disclosure Form
Appendix S1: Supplementary Information
ACKNOWLEDGMENTS
The super‐computing resource was provided by Human Genome Center, Institute of Medical Sciences, The University of Tokyo (http://sc.hgc.jp/shirokane.html).
This study was supported by Chugai Pharmaceutical Co. Ltd.
Author disclosures are available at https://onlinelibrary.wiley.com/action/downloadSupplement?doi=10.1002%2Facr2.11521&file=acr211521-sup-0001-Disclosureform.pdf.
Contributor Information
Yukiko Iwasaki, Email: yu_nyan@saitama-med.ac.jp.
Keishi Fujio, Email: FUJIOK-INT@h.u-tokyo.ac.jp.
REFERENCES
- 1. Benveniste O, Goebel HH, Stenzel W. Biomarkers in inflammatory myopathies—an expanded definition. Front Neurol 2019;10:1–13. [DOI] [PMC free article] [PubMed] [Google Scholar]
- 2. Betteridge Z, Tansley S, Shaddick G, et al. Frequency, mutual exclusivity and clinical associations of myositis autoantibodies in a combined European cohort of idiopathic inflammatory myopathy patients. J Autoimmun 2019;101:48. [DOI] [PMC free article] [PubMed] [Google Scholar]
- 3. Rothwell S, Cooper RG, Lundberg IE, et al. Dense genotyping of immune‐related loci in the idiopathic inflammatory myopathies confirms HLA alleles as strongest genetic risk factor and suggests different genetic background for major clinical subgroups. Ann Rheum Dis 2016;75:1558. [DOI] [PMC free article] [PubMed] [Google Scholar]
- 4. Engel AG, Arahata K. Monoclonal antibody analysis of mononuclear cells in myopathies. II: Phenotypes of autoinvasive cells in polymyositis and inclusion body myositis. Ann Neurol 1984;16:209–15. [DOI] [PubMed] [Google Scholar]
- 5. CM de P, AM R . Dendritic cells and the immunopathogenesis of idiopathic inflammatory myopathies. Curr Opin Rheumatol 2008;20:669–74. [DOI] [PubMed] [Google Scholar]
- 6. Pinal‐Fernandez I, Casal‐Dominguez M, Derfoul A, et al. Machine learning algorithms reveal unique gene expression profiles in muscle biopsies from patients with different types of myositis. Ann Rheum Dis 2020;79:1234–42. [DOI] [PMC free article] [PubMed] [Google Scholar]
- 7. Walsh RJ, Kong SW, Yao Y, et al. Type I interferon–inducible gene expression in blood is present and reflects disease activity in dermatomyositis and polymyositis. Arthritis Rheum 2007;56:3784. [DOI] [PMC free article] [PubMed] [Google Scholar]
- 8. Pinal‐Fernandez I, Casal‐Dominguez M, Derfoul A, et al. Identification of distinctive interferon gene signatures in different types of myositis. Neurology 2019;93:e1193–204. [DOI] [PMC free article] [PubMed] [Google Scholar]
- 9. Bohan A, Peter JB. Polymyositis and dermatomyositis (first of two parts). N Engl J Med 1975;292:344–7. [DOI] [PubMed] [Google Scholar]
- 10. Sontheimer RD. Would a new name hasten the acceptance of amyopathic dermatomyositis (dermatomyositis siné myositis) as a distinctive subset within the idiopathic inflammatory dermatomyopathies spectrum of clinical illness? J Am Acad Dermatol 2002;46:626–36. [DOI] [PubMed] [Google Scholar]
- 11. Rider LG, Aggarwal R, Machado PM, et al. Update on outcome assessment in myositis. Nat Rev Rheumatol 2018;14:303. [DOI] [PMC free article] [PubMed] [Google Scholar]
- 12. Ota M, Nagafuchi Y, Hatano H, et al. Dynamic landscape of immune cell‐specific gene regulation in immune‐mediated diseases. Cell 2021;184:3006–21.e17. [DOI] [PubMed] [Google Scholar]
- 13. Leek JT, Johnson WE, Parker HS, et al. The sva package for removing batch effects and other unwanted variation in high‐throughput experiments. Bioinformatics 2012;28:882. [DOI] [PMC free article] [PubMed] [Google Scholar]
- 14. Landolt‐Marticorena C, Bonventi G, Lubovich A, et al. Lack of association between the interferon‐α signature and longitudinal changes in disease activity in systemic lupus erythematosus. Ann Rheum Dis 2009;68:1440–6. [DOI] [PubMed] [Google Scholar]
- 15. Radke J, Koll R, Preuße C, et al. Architectural B‐cell organization in skeletal muscle identifies subtypes of dermatomyositis. Neurol Neuroimmunol Neuroinflamm 2018;5:e451. [DOI] [PMC free article] [PubMed] [Google Scholar]
- 16. Gallay L, Mouchiroud G, Chazaud B. Interferon‐signature in idiopathic inflammatory myopathies. Curr Opin Rheumatol 2019;31:634–42. [DOI] [PubMed] [Google Scholar]
- 17. Whitfield ML, George LK, Grant GD, et al. Common markers of proliferation. Nat Rev Cancer 2006;6:99–106. [DOI] [PubMed] [Google Scholar]
- 18. Kuswanto W, Burzyn D, Panduro M, et al. Poor repair of skeletal muscle in aging mice reflects a defect in local, interleukin‐33‐dependent, accumulation of regulatory T cells. Immunity 2016;44:355. [DOI] [PMC free article] [PubMed] [Google Scholar]
- 19. Sakamoto S, Okamoto M, Kaieda S, et al. Low positive titer of anti‐melanoma differentiation‐associated gene 5 antibody is not associated with a poor long‐term outcome of interstitial lung disease in patients with dermatomyositis. Respir Investig 2018;56:464–72. [DOI] [PubMed] [Google Scholar]
- 20. Olingy CE, Emeterio CLS, Ogle ME, et al. Non‐classical monocytes are biased progenitors of wound healing macrophages during soft tissue injury. Sci Rep 2017;7:447. [DOI] [PMC free article] [PubMed] [Google Scholar]
Associated Data
This section collects any data citations, data availability statements, or supplementary materials included in this article.
Supplementary Materials
Disclosure Form
Appendix S1: Supplementary Information


