Abstract
Background
In individuals with postacute COVID-19 syndrome (PACS) and normal pulmonary function, xenon 129 (129Xe) MRI ventilation defects, abnormal quality-of-life scores, and exercise limitation were reported 3 months after infection; the longitudinal trajectory remains unclear.
Purpose
To measure and compare pulmonary function, exercise capacity, quality of life, and 129Xe MRI ventilation defect percent (VDP) in individuals with PACS evaluated 3 and 15 months after COVID-19 infection.
Materials and Methods
In this prospective study, participants with PACS aged 18–80 years were enrolled between July 2020 and August 2021 from two quaternary care centers. 129Xe MRI VDP, diffusing capacity of lung for carbon monoxide (Dlco), spirometry, oscillometry, 6-minute walk distance (6MWD), and St George Respiratory Questionnaire (SGRQ) scores were evaluated 3 months and 15 months after COVID-19 infection. Differences between time points were evaluated using the paired t test. Multivariable models were generated to explain exercise capacity and quality-of-life improvement. Odds ratios (ORs) were used to evaluate potential treatment influences.
Results
Overall, 53 participants (mean age, 55 years ± 18 [SD]; 27 women) attended both 3- and 15-month visits and were included in the analysis. The mean values for 129Xe MRI VDP (5.8% and 4.2%; P = .003), forced expiratory volume in the 1st second of expiration percent predicted (84% and 90%; P = .001), Dlco percent predicted (86% and 99%; P = .002), and SGRQ score (35 and 25; P < .001) improved between the 3- and 15-month visit. VDP measured 3 months after COVID-19 infection predicted the change in 6MWD (β = −0.643, P = .006), while treatment with respiratory medication at 3 months predicted an improved quality-of-life score at 15 months (OR, 4.0; 95% CI: 1.2, 13.8; P = .03).
Conclusion
Pulmonary function, gas exchange, exercise capacity, quality of life, and 129Xe MRI ventilation defect percent (VDP) improved in participants with postacute COVID-19 syndrome at 15 months compared with 3 months after infection. VDP measured at 3 months after infection correlated with improved exercise capacity, while treatment with respiratory medication was associated with an improved quality-of-life score 15 months after infection.
ClinicalTrials.gov registration no. NCT05014516
© RSNA, 2023
Supplemental material is available for this article.
See also the editorial by Vogel-Claussen in this issue.
Summary
Pulmonary function, gas exchange, exercise capacity, quality of life, and 129Xe MRI ventilation defect percent improved in participants with postacute COVID-19 syndrome 15 months after infection, while treatment with respiratory medication was associated with quality-of-life improvement.
Key Results
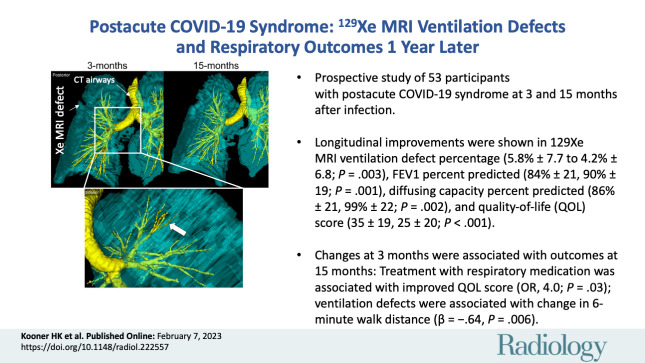
■ Prospective evaluation of 53 participants with postacute COVID-19 syndrome at 3 and 15 months after infection showed an improved mean 129Xe MRI ventilation defect percent (VDP) (5.8% ± 7.7 [SD], 4.2% ± 6.8; P = .003), forced expiratory volume in 1 second percent predicted (84% ± 21, 90% ± 19; P = .001), diffusing capacity percent predicted (86% ± 21, 99% ± 22; P = .002), and quality-of-life score (35 ± 19, 25 ± 20; P < .001).
■ VDP measured 3 months after COVID-19 predicted the change in the 6-minute walk distance (β = −0.643, P = .006) 15 months after COVID-19.
■ Treatment with respiratory medication 3 months after COVID-19 was associated with an improved quality-of-life score (odds ratio, 4.0; P = .03) 15 months after COVID-19.
Introduction
Over the past 2 years, postacute COVID-19 sequelae have been defined (1) and redefined (2). Postacute COVID-19 syndrome (PACS), now called post–COVID-19 condition, is the umbrella term that describes continuing or new symptoms that persist 4 weeks or more after acute COVID-19 infection, including respiratory, neurologic, and psychologic symptoms (1). While a majority of previously hospitalized individuals with PACS have reported improved pulmonary function and exercise capacity 12 months after infection (3,4), at least one persistent symptom has also been reported in 41%–85% of patients with PACS (5–7). Importantly, in a single-center study of 30 previously hospitalized symptomatic patients 6 weeks after discharge, treatment with oral corticosteroids significantly improved dyspnea and exercise capacity (8). However, without a control group, it remains difficult to ascertain the influence of treatment on improvements.
Chest CT is nearly universally available and is the clinical mainstay for evaluation of pulmonary abnormalities resultant from COVID-19 infection (9) in people with PACS (10). In PACS, xenon 129 (129Xe) MRI previously revealed abnormal gas-exchange measurements (11–14) and ventilation defects (11,15). In patients with normal pulmonary function and normal or mildly abnormal chest CT (12–15) results, some of these MRI findings were accompanied by highly abnormal quality-of-life scores and exercise capacity. The longitudinal trajectory of such abnormal MRI measurements and their relationship to persistent symptoms remains unclear. Hyperpolarized 129Xe MRI (16) provides a way to quantify airway dysfunction, including the functional consequences of airway inflammation or remodeling in asthma (17). In patients with PACS, MRI ventilation defects were shown to be related to exercise limitation and postexertional dyspnea (15). Ventilation defects are temporally and spatially reproducible in individuals with airways disease (18), with high reproducibility across different sites (19). In a pilot demonstration in four asymptomatic patients with COVID-19, 129Xe MRI ventilation defects improved 12 months after infection (20). In another investigation, full-scale airway network modeling of ventilation abnormalities differentiated patients with dyspnea after COVID-19 infection (21).
While these previous results are compelling, to our knowledge, there have been no published observations in individuals with PACS that link improved airway dysfunction with dyspnea and exercise capacity improvements over time. We hypothesized that in those with PACS, 129Xe MRI VDP and quality-of-life scores would significantly improve 12 months after a baseline visit. Hence, our aim was to measure and compare pulmonary function, exercise capacity, quality of life, and 129Xe MRI ventilation defect percent (VDP) in patients with PACS who were evaluated 3 months and 15 months after COVID-19 infection.
Materials and Methods
Study Participants and Design
In this prospective study, participants were recruited in a convenience series between July 2020 and August 2021 from two quaternary care centers and research sites (site 1: Robarts Research Institute, London, Canada; site 2: St Joseph’s Healthcare Hamilton, Hamilton, Canada), and all provided written informed consent to the institutional ethics board (HSREB #113224, site 1; HiREB #12672, site 2) to participate in the Health Canada–approved protocol (ClinicalTrials.gov registration no. NCT05014516). Inclusion criteria and participant recruitment were previously described (15). Briefly, inclusion criteria consisted of individuals aged 18–80 years with a public health–confirmed case of COVID-19 and persistent symptoms, including but not limited to respiratory, neurologic, and metabolic systems. Exclusion criteria included MRI contraindications and inability to return for follow-up.
During 3-month and 15-month visits, the fraction of exhaled nitric oxide, spirometry, oscillometry, multibreath inert gas washout, diffusing capacity of lung for carbon monoxide (Dlco), and 129Xe MRI parameters were evaluated for each participant. The St George Respiratory Questionnaire (SGRQ) (22) was completed to measure respiratory illness–related quality of life, and the modified Medical Research Council dyspnea scale (23), modified Borg scale (24), International Physical Activity Questionnaire (25), and 6-minute walk distance (6MWD) test (26) were also completed. Thoracic CT was performed during the 3-month visit. 129Xe MRI VDP and CT results acquired 3 months after COVID-19 infection have been previously reported (15); herein, we report measurements at 15 months after COVID-19 infection and compare them with the 3-month measurements.
Pulmonary Function Tests and Questionnaires
Participants completed spirometry for forced expiratory volume in 1st second of expiration (FEV1) and forced vital capacity, according to American Thoracic Society guidelines (27), using the EasyOne Pro LAB system (ndd Medical Technologies) or a whole-body plethysmograph (MGC Diagnostics). Multibreath inert gas washout, performed using the EasyOne Pro LAB system equipped with an ultrasonic flow and molar mass sensor, measured the lung clearance index (28). Dlco was also measured using the EasyOne Pro LAB system or the plethysmograph, according to European Respiratory Society guidelines (29). Oscillometry was performed according to European Respiratory Society guidelines (30) using the tremoFlo C-100 Airwave Oscillometry System (Thorasys) to measure resistance and reactance (units in cm H2O·sec/L) from 5 to 37 Hz. Postbronchodilator measurements were performed 15 minutes after inhalation of 4 × 100 µg of salbutamol sulfate norflurane (Ivax Pharmaceuticals) using AEROCHAMBER (Trudell Medical International). Participants withheld respiratory medications before each study visit according to American Thoracic Society guidelines (27). The SGRQ, modified Medical Research Council dyspnea scale, modified Borg scale, International Physical Activity Questionnaire, and 6MWD test were administered under study personnel supervision.
Thoracic MRI
Anatomic proton (1H) and 129Xe static ventilation MRI was performed using 3-T scanners (Discovery MR750; GE Healthcare), as previously described (15). Anatomic 1H MRI scans were acquired using a fast-spoiled gradient-recalled-echo sequence (partial-echo acquisition; total acquisition time, 8 seconds; repetition time msec/echo time msec, 4.7/1.2; flip angle, 30°; field of view, 40 × 40 cm2; bandwidth, 24.4 kHz; matrix size, 128 × 80; zero-filled to 128 × 128; partial-echo percentage, 62.5%; section thickness, 15–17 × 15 mm). 129Xe MRI scans were acquired using a three-dimensional fast-spoiled gradient-recalled-echo sequence (total acquisition time, 14 seconds; 6.7/1.5; variable flip angle; field of view, 40 × 40 cm2; bandwidth, 15.63 kHz; matrix size, 128 × 128; section thickness, 14 × 15 mm) and a flexible vest coil (Clinical MR Solutions, site 1) or asymmetric quadrature bird cage coil (custom built, site 2). Supine-positioned participants were coached to inhale a 1-L bag (Tedlar; Jensen Inert Products) (400 mL 129Xe plus 600 mL 4He at site 1 or 600 mL 129Xe plus 400 mL N2 at site 2 and 1 L N2 for 1H MRI) from the bottom of a tidal breath (functional residual capacity) with acquisition under breath-hold conditions. 129Xe gas was polarized to 15%–55% (Xenispin 9820 [site 1] and Xenispin 9800 [site 2]; Polarean) (15). Quantitative MRI analysis was performed (H.K.K, with 3 years of experience, and M.J.M, with 4 years of experience) using MATLAB 2019a (Mathworks), as previously described (15).
Thoracic CT
Within 30 minutes of MRI, CT was performed as previously described (15) (64-slice LightSpeed VCT [site 1], Discovery MI PET/CT [site 2]; GE Healthcare) (collimation, 64 × 0.625; peak 120 kV; 100 mA; tube rotation, 500 msec; pitch, 1.25; standard reconstruction kernel; field of view, 40 cm2; section thickness, 1.25 mm). CT images were analyzed (H.K.K., with 3 years of experience) using VIDAvision software (VIDA Diagnostics).
Statistical Analysis
SPSS Statistics (version 25; IBM) was used for all statistical analyses. Sample size considerations (power of 80% and two-sided significance of 5%, indicating 33 participants) are described in Appendix S1. Data were tested for normality using the Shapiro-Wilk test, and nonparametric tests were performed for nonnormally distributed data. Differences between 3- and 15-month visits were evaluated using paired samples t tests, and differences between subgroups were evaluated using independent samples t tests and analysis of variance. Univariable relationships were evaluated using Pearson (r) for parametric data and Spearman (ρ) correlations for nonparametric data. Variables with Pearson or Spearman correlation with P values less than or equal to .20 were used to generate multivariable models, where significant variables included in the model were chosen using the backward approach to explain changes observed at 15 months. The removal criterion for the backward method included variables with a probability of an F value greater than or equal to 0.10. Variables were tested for collinearity and models were rejected when the variance inflation factor was greater than or equal to 5. Predictors of improvements greater than the minimal clinically important difference were evaluated using binary logistic regression to generate odds ratios (ORs). Results were considered statistically significant when the probability of making a type I error was less than 5% (P < .05).
Results
Participant Characteristics
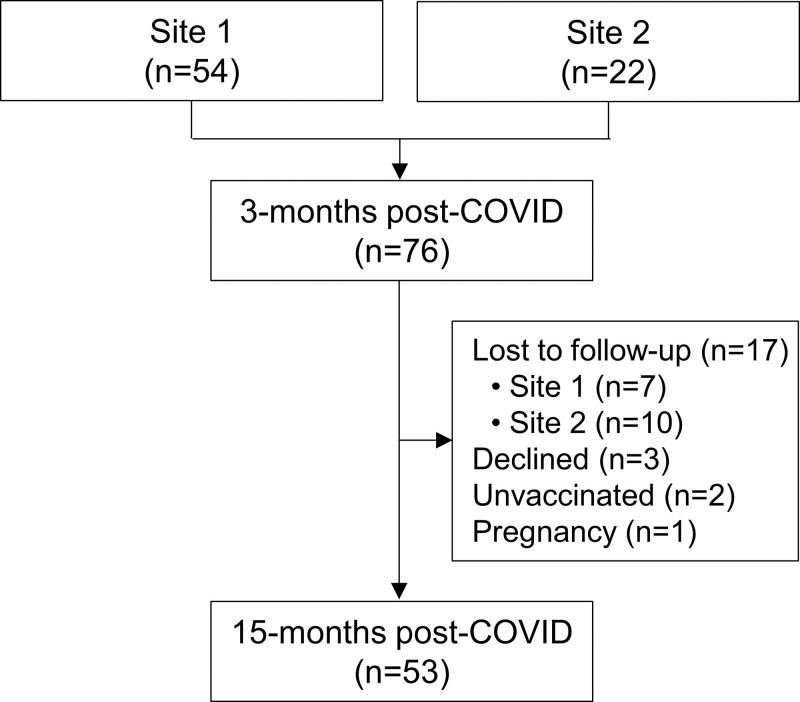
In total, 76 participants with PACS (mean age, 53 years ± 12 [SD]; 38 men, 38 women) were evaluated at 3 months (site 1, n = 54; site 2, n = 22) (Fig 1), as prior work has shown (15). Of these, 23 were excluded from analysis; 17 were lost-to-follow-up, three declined, two declined COVID-19 vaccination and thus were not allowed to attend the follow-up visit due to institutional guidelines, and one became pregnant during the time between visits and was not eligible for MRI. Finally, 53 participants were evaluated at 15 months (mean age, 55 years ± 18; 27 women).
Figure 1:
Study flowchart.
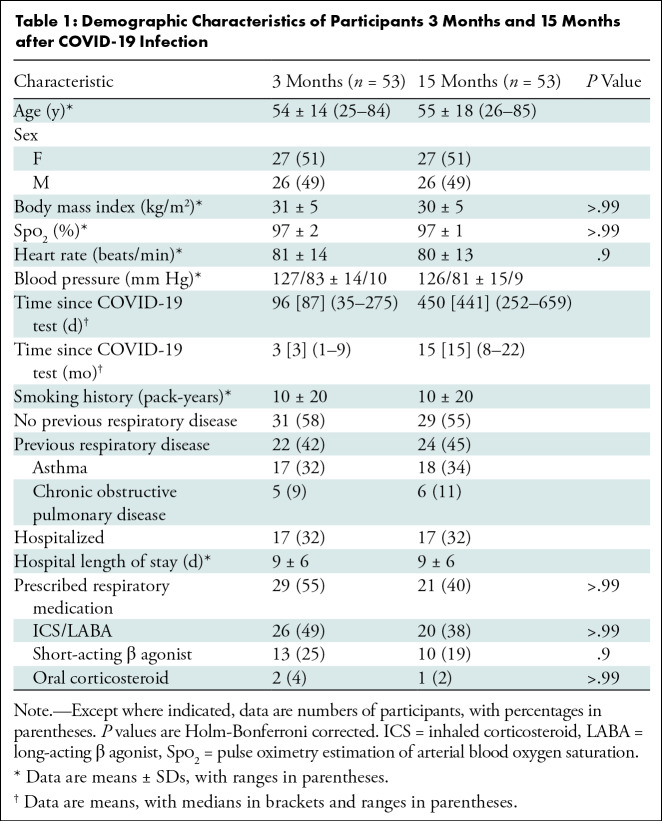
Table 1 provides demographic characteristics for participants at the 3- and 15-month visits. Biological sex was self-reported. Table S1 summarizes baseline measurements for the original study group and the subgroup attending the 15-month visit. Of the 53 participants evaluated at 15 months, 17 (32%) were hospitalized during acute COVID-19 infection and 36 (68%) received home-based care. A summary of prescribed medications is shown in Table 1 and a by-participant list is provided in Table S2. Table S3 summarizes demographic characteristics by site and shows that the mean postexertion pulse oximetry estimation of arterial blood oxygen saturation (Spo2) was significantly different (96% ± 3 vs 99% ± 1; P = .002) between sites at the 15-month post–COVID-19 visit. Tables S4 and S5 show data in subgroups dichotomized by previous hospitalization status and self-reported previous respiratory disease, respectively.
Table 1:
Demographic Characteristics of Participants 3 Months and 15 Months after COVID-19 Infection
Post–COVID-19 Measurements at 15 Months
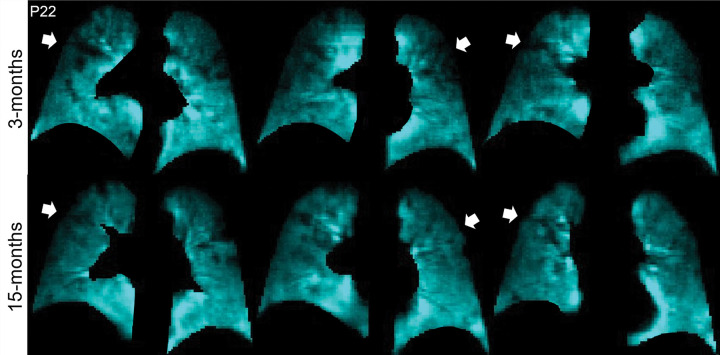
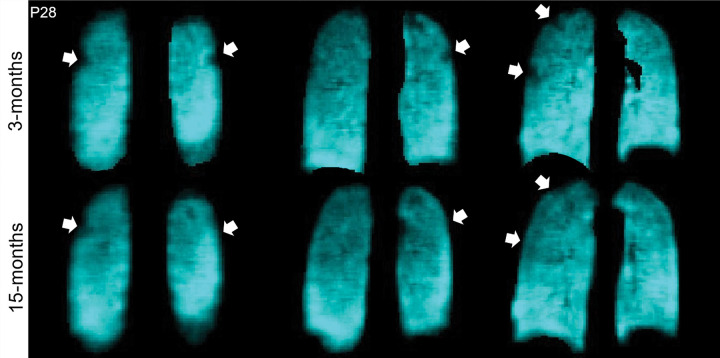
Figures 2 and 3 show 129Xe ventilation MRI scans for two representative participants at 3 and 15 months. In one participant, ventilation defects in the upper lobes were qualitatively improved at 15 months compared with 3 months after COVID-19 infection (Fig 2). In the other participant, who required hospitalization during the acute infection phase, wedge-shaped ventilation defects at 3 months resolved at 15 months (Fig 3).
Figure 2:
129Xe MRI ventilation scans 3 months (top) and 15 months (bottom) after COVID-19 infection in a 65-year-old man who was not hospitalized during acute infection. Coronal 129Xe MRI scans show lung sections (cyan), with arrows indicating MRI ventilation abnormalities that improved at the 15-month follow-up. At 3 and 15 months, the forced expiratory volume in 1st second of expiration percent predicted was 95% and 102%, diffusing capacity of lung for carbon monoxide percent predicted was 97% and 105%, St George Respiratory Questionnaire score was 36 and 27, and ventilation defect percent was 7% and 2%, respectively.
Figure 3:
129Xe MRI ventilation scans 3 months (top) and 15 months (bottom) after COVID-19 infection in a 68-year-old woman who was hospitalized for 9 days during acute infection. Coronal 129Xe MRI scans show lung sections (cyan), with arrows indicating MRI ventilation abnormalities that improved at the 15-month follow-up. At 3 and 15 months, the forced expiratory volume in 1st second of expiration percent predicted was 84% and 100%, diffusing capacity of lung for carbon monoxide percent predicted was 81% and 91%, St George Respiratory Questionnaire score was 59 and 0, and ventilation defect percent was 2% and 0%, respectively.
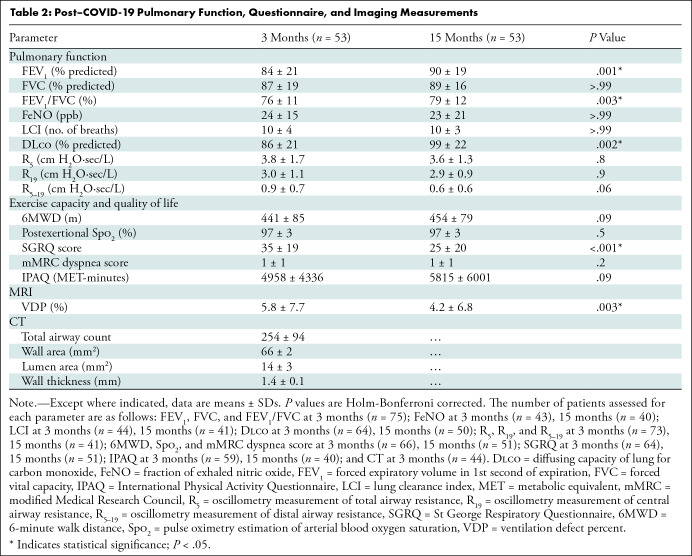
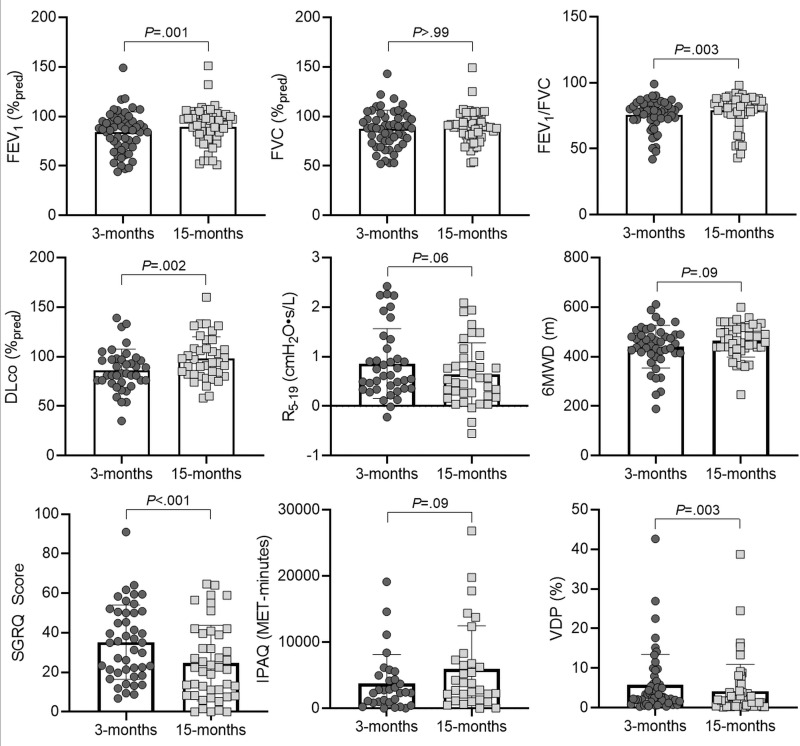
Table 2 shows data acquired at 3 and 15 months after COVID-19 infection. A subset of these measurements is shown in Figure 4. Improvement from the 3-month to 15-month visit after COVID-19 infection was observed in all participants with PACS for FEV1 percent predicted (mean, 84% ± 21 and 90% ± 19, respectively; P = .001), FEV1/FVC (mean, 76% ± 11 and 79% ± 12, respectively; P = .003), Dlco percent predicted (mean, 86% ± 21 and 99% ± 22, respectively; P = .002), SGRQ score (mean, 35 ± 19 and 25 ± 20, respectively; P < .001), and VDP (mean, 5.8% ± 7.7 and 4.2% ± 6.8, respectively; P = .003). The mean lung clearance index (31) (10 ± 4 and 10 ± 3; P > .99) and SGRQ score (32) remained abnormal in participants with PACS at both visits. At 15 months after COVID-19 infection, 34% (18 of 53) of participants reported VDP improvement greater than the minimal clinically important difference (2%) (33). Table S6 shows all participant data dichotomized according to VDP value at the 3-month visit (22).
Table 2:
Post–COVID-19 Pulmonary Function, Questionnaire, and Imaging Measurements
Figure 4:
Scatterplots and bar graphs show pulmonary function, exercise capacity, and quality of life 3 months and 15 months after COVID-19 infection. Holm-Bonferroni correction indicates a statistically significant difference for forced expiratory volume in 1st second of expiration (FEV1) (P = .001), FEV1/FVC (P = .003), diffusing capacity of lung for carbon monoxide (Dlco) (P = .002), St George Respiratory Questionnaire (SGRQ) score (P < .001), and 129Xe MRI ventilation defect percent (VDP) (P = .003) at 15 months compared with 3 months. Forced vital capacity (FVC) (P > .99), oscillometry measurement of distal airway resistance (R5–19) (P = .06), 6-minute walk distance (6MWD) (P = .09), and International Physical Activity Questionnaire (IPAQ) (P = .09) did not differ significantly. MET = metabolic equivalent, %pred = percent predicted.
Relationships and Multivariable Models
As shown in Figure S1, the VDP at 15 months was related to postexertional Spo2 (ρ = −0.36, P = .009) and lung clearance index (ρ = 0.59, P < .001), while the oscillometry measurement of distal airway resistance (R5–19) was related to the SGRQ score (ρ = 0.33, P = .04) and 6MWD (ρ = −0.42, P = .008). The change in VDP was related to the change in FEV1 (ρ = −0.30, P = .03) and the change in lung clearance index (ρ = −0.39, P = .03) at 15 months compared with 3 months after infection.
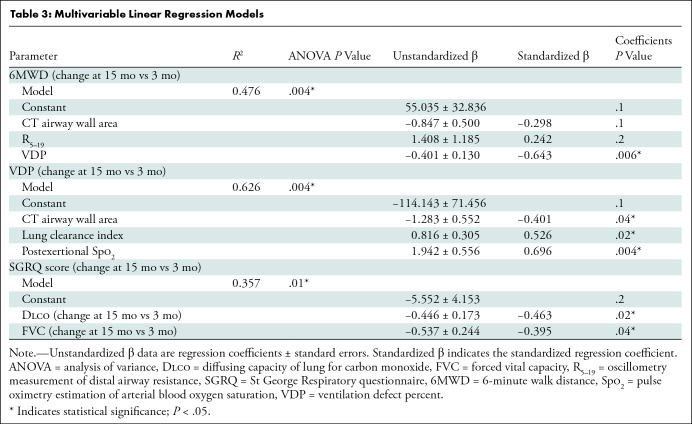
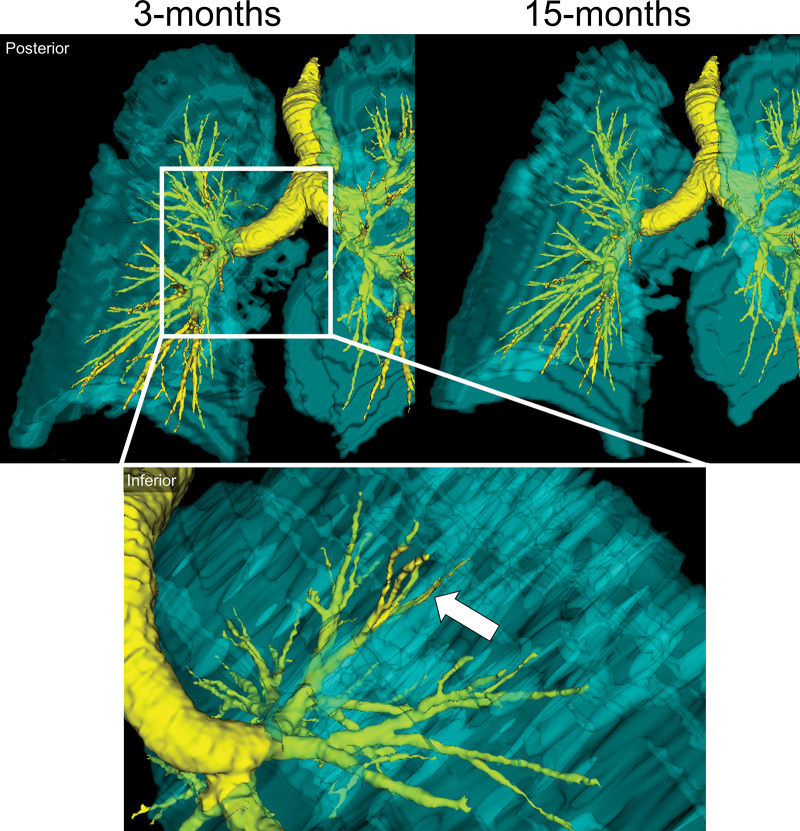
We generated multivariable models to explain the change in the 6MWD, VDP, and SGRQ score at 15 months, and these are shown in Table 3. Table S7 shows correlations for potential predictor variables of these changes. VDP (β = −0.643, P = .006) measured 3 months after COVID-19 predicted the change in 6MWD at 15 months, while the CT airway wall area (β = −0.298, P = .1) and oscillometry measurement of distal airway resistance (β = 0.242, P = .2) also contributed to the model. The CT airway wall area (β = −0.401, P = .04), lung clearance index (β = 0.526, P = .02), and postexertional Spo2 (β = 0.696, P = .004) were all variables for the change in VDP at 15 months relative to 3 months. In addition, changes in Dlco (β = −0.463, P = .02) and forced vital capacity (β = −0.395, P = .04) explained the change in the SGRQ score. In one participant, the MRI and CT relationships (Figure 5) show that an abnormal left upper lobe anterior segmental bronchus (LB3), spatially related to ventilation defects at 3 months, showed substantial improvement, if not complete normalization, at 15 months.
Table 3:
Multivariable Linear Regression Models
Figure 5:
Representative images show a three-dimensional model of 129Xe MRI lung sections (cyan) and CT airways (yellow) in a 65-year-old man who was not hospitalized during acute COVID-19 infection. Top: Posterior views show ventilation abnormalities at 3 months (left), which resolved at 15 months (right). Bottom: Inset shows the inferior view, with the arrow pointing to an airway LB3 ventilation defect at 3 months.
In addition, we retrospectively evaluated any potential influence of prescription medications, including inhaled long-acting bronchodilator or oral and/or inhaled corticosteroids, on 15-month visit improvements. Twenty-nine participants were prescribed airways disease medications at 3 months. Of these 29 participants, improvements greater than the minimal clinically important difference at 15 months were observed for FEV1 in 15 (52%), 6MWD in 15 (15 of 25 [60%]), SGRQ score in 20 (20 of 25 [80%]), and VDP in 10 (34%) (33–36). Figure 6 shows that prescribed respiratory medication at 3 months was associated with SGRQ score improvement at 15 months (OR, 4.0; 95% CI: 1.2, 13.8; P = .03) but was not statistically predictive of 6MWD improvement (OR, 2.9; 95% CI: 0.9, 9.6; P = .08). There was no statistical evidence that prescribed respiratory medication at 3 months was associated with improved FEV1 (OR, 1.1; 95% CI: 0.4, 3.2; P = .9) or VDP (OR, 0.9; 95% CI: 0.3, 2.7; P = .9) at 15 months after COVID-19 infection. Notably, as shown in Table S8, the proportion of participants prescribed respiratory medication was not different (52% [15 of 29] and 48% [14 of 29]; P = .1) between those with (n = 22) and without (n = 31) a prior history of respiratory illness. The presence or absence of any prior history of respiratory disease, independent of treatment, was not a predictor for improved SGRQ score (OR, 2.7; 95% CI: 0.8, 9.1; P = .1), 6MWD (OR, 0.8; 95% CI: 0.3, 2.7; P = .8), FEV1 (OR, 1.5; 95% CI: 0.5, 4.3; P = .5), or VDP (OR, 0.5; 95% CI: 0.5, 4.3; P = .5). Table S9 shows data for participants prescribed respiratory medication at 3 months and those who were not.
Figure 6:
Forest plots show that treatment with prescribed respiratory medication (Rx) 3 months after COVID-19 infection predicted an improved St George Respiratory Questionnaire (SGRQ) score (odds ratio [OR], 4.0; P = .03) greater than or equal to the minimal clinically important difference at 15 months, but not improved 6-minute walk distance (6MWD) (OR, 2.9; P = .08), forced expiratory volume in 1st second of expiration (FEV1) (OR, 1.1; P = .9), or 129Xe MRI ventilation defect percent (VDP) (OR, 0.9; P = .9). The triangle indicates change at 15 months compared with 3 months. * indicates P < .05.
Discussion
We prospectively evaluated symptomatic participants with postacute COVID-19 syndrome (PACS) 3 and 15 months after COVID-19 infection using xenon 129 (129Xe) MRI, pulmonary function tests, the 6-minute walk distance (6MWD) test, as well as quality-of-life and exercise questionnaires. We wanted to better understand the longitudinal trajectory of abnormal MRI and other respiratory measurements observed 3 months after infection. We also wanted to interrogate potential mechanistic links between the pathologic findings in lung function we observed using MRI in participants who presented with normal pulmonary function but persistent symptoms, including exertional dyspnea and exercise limitation. Our observations are as follows: (a) improved 129Xe MRI ventilation defect percent (VDP) (mean, 5.8% and 4.2%; P = .003), forced expiratory volume in 1st second of expiration (FEV1) percent predicted (mean, 84% and 90%; P = .001), diffusing capacity of lung for carbon monoxide (Dlco) percent predicted (mean, 86% and 99%; P = .002), and St George Respiratory Questionnaire (SGRQ) score (mean, 35 and 25; P < .001) at 15 months compared with 3 months after COVID-19 infection; (b) MRI VDP (β = −0.643, P = .006) measured 3 months after infection predicted 6MWD improvement 15 months after infection; (c) improved Dlco (β = −0.463, P = .02) and forced vital capacity (β = −0.395, P = .04) explained the improved SGRQ score 15 months after infection; and (d) airways disease therapy at 3 months was strongly associated with an improved quality-of-life score (odds ratio, 4.0; 95% CI: 1.2, 13.8; P = .03) that was greater than the minimal clinically important difference 15 months after COVID-19. In this relatively large group of 53 participants, 129Xe MRI VDP and SGRQ score both improved 15 months after COVID-19 infection; the mean VDP at 15 months (4.2% ± 6.8 [SD]) remained greater (worse) than the mean VDP values determined during the 3-month visit in a healthy subgroup who had never contracted COVID-19 (1.1% ± 0.9), as previously described (15). The mean FEV1 and Dlco values, while both in the normal range at 3 months, also improved at 15 months. Not only were these improvements statistically significant, but the majority of participants also showed a personal improvement greater than the minimal clinically important difference.
Previous studies of longitudinal respiratory outcomes 12 months following COVID-19 infection also reported increased quality of life and exercise capacity (3,4). Unfortunately, these previous studies did not uncover evidence that linked such subjective improvements with pathophysiologic changes. Because all patients in our study sample had been infected early in the pandemic before vaccination was possible, we could not evaluate the relationship between different COVID-19 infection waves or vaccination status on PACS. However, we were able to demonstrate objective improvements in airway dysfunction, alongside symptom and quality-of-life changes, 15 months after infection.
Toward our goal of understanding the drivers of post–COVID-19 symptoms, we aimed to explore the potential relationships between symptoms and exercise limitation with MRI-assessed VDP, which reflects airway luminal dysfunction in airways disease observed in asthma (17). At 15 months after infection, VDP correlated with both the postexertional Spo2 (ρ = −0.36, P = .009) and lung clearance index (ρ = 0.59, P < .001). This result suggested that ventilation defect improvement was coincident with improved, resting upright (vs supine for MRI) ventilation heterogeneity and O2 saturation after the 6MWD test. In addition, the oscillometry measurement of distal airway resistance, or R5–19, which was not significantly different at 15 months (mean, 0.9 cm H2O·sec/L ± 0.7 vs 0.6 cm H2O·sec/L ± 0.6; P = .06), was related to SGRQ score (ρ = 0.33, P = .04) and 6MWD (ρ = −0.42, P = .008), which were both improved at 15 months. Given these relationships, we were surprised that VDP did not correlate with symptoms or exercise limitations at 15 months. However, taken together, all these results suggest that improved small airway function may play a role in improved quality of life and exercise capacity in some patients with PACS. Moreover, the improved MRI VDP at 15 months was also explained by CT airway wall area, lung clearance index, and postexertional Spo2 measurements, which is consistent with the growing body of evidence pointing to small airways disease as a contributor to PACS (37). While we have not evaluated the role of MRI gas exchange in the current study, such measurements are necessarily based on 129Xe signal moving from well-ventilated lung regions to the tissue barrier and red blood cells; in participants with a predominant MRI ventilation defect phenotype, a complete picture of gas-exchange abnormalities is impossible.
We were surprised to observe that MRI VDP, along with the oscillometry measurement of distal airway resistance, also predicted 6MWD improvements, which supported the concept of a mechanistic link between exercise intolerance and small airway dysfunction. The observation that improved Dlco and forced vital capacity together explained an improved SGRQ score was also consistent with previous reports in hospitalized patients with COVID-19 after discharge (3,4). A large component of the SGRQ score evaluates exercise limitation. Thus, based on the modeling results reported here, there appears to be a complex relationship or link between exercise intolerance and quality of life with MRI, CT, and oscillometry measurements of airway dysfunction.
Finally, our results showed that treatment with inhaled or oral airways disease medication at 3 months predicted an improved quality-of-life score at 15 months that was greater than the minimal clinically important difference. As treatment of COVID-19 continues to shift from acute to chronic care, the similarities between PACS and symptomatic airways disease has placed emphasis on the treatment of the airway component of PACS (38). Herein, we provided evidence to support airways disease treatment in patients with PACS who have MRI and lung clearance index findings consistent with airways disease.
We acknowledge several study limitations. First, our study had a relatively small sample size with a potential for retention bias toward participants with persistent symptoms and poor quality of life. Second, we did not repeat CT imaging at 15 months and, hence, were unable to measure potential CT airway, parenchymal, or pulmonary vascular changes at follow-up. Third, we did not acquire 129Xe gas-exchange MRI measurements in our current study, as previously reported (11–14). Finally, while we reported on prescribed therapies, we did not have any information about the rationale for such patient management decisions. All participants enrolled were followed by a quaternary care team based at local post–COVID-19 condition clinics and were prescribed treatment accordingly, perhaps based on evidence of airways disease as a potential cause of PACS (38). Thus, we note the possibility of selection bias for participants receiving prescribed therapy based on recruitment from these clinics.
In conclusion, in this prospective longitudinal investigation 15 months after infection in participants with postacute COVID-19 syndrome (PACS), we found that 129Xe MRI ventilation defect percent (VDP) improvement coincided with improved forced expiratory volume in 1st second of expiration, diffusing capacity of lung for carbon monoxide (Dlco), and St George Respiratory Questionnaire (SGRQ) score. The MRI VDP assessed 3 months after infection uniquely predicted improved 6-minute walk distance tests at 15 months, while the changes in both Dlco and forced vital capacity explained the change in the SGRQ score. Treatment with respiratory medication at 3 months was strongly associated with quality-of-life score improvements at 15 months. These positive results may have implications for the monitoring and treatment of patients with PACS as the pandemic evolves.
Supported by the Ontario Ministry of Health and Long-Term Care. H.K.K., M.J.M., and A.M.M. supported by Natural Sciences and Engineering Council of Canada doctoral scholarships. H.K.K. supported by Asthma Canada; the Canadian Allergy, Asthma and Immunology Foundation; and the Canadian Institutes of Health Research–Institute of Circulatory and Respiratory Health (grant CIHR-ICRH). M.J.M. supported by a Canadian Respiratory Research Network (CRRN) studentship training award. G.P., M.K., and S.S. supported by the Canada Research Chair Program.
Data sharing: Data generated or analyzed during the study are available from the corresponding author by request.
Disclosures of conflicts of interest: H.K.K. No relevant relationships. M.J.M. No relevant relationships. A.M.M. No relevant relationships. M.A. No relevant relationships. M.S.A. No relevant relationships. I.D. No relevant relationships. M.K. Consultant for VIDA Diagnostics. A.O. No relevant relationships. G.E.S. No relevant relationships. C.V. Lecture honoraria from AstraZeneca and GSK; conference travel support from AstraZeneca. N.R. No relevant relationships. S.S. Lecture honoraria from Polarean. J.M.N. Lecture honoraria from AstraZeneca, Vertex, Valeo Pharma, and Horizon Therapeutics. G.P. Grant from Ontario Rapid Response; consulting fees from Polarean Imaging; payment or honoraria from AstraZeneca; member of the Institute Advisory Board, Institute of Circulatory and Respiratory Health, and Canadian Institutes of Health Research; member of the RSNA Thoracic Imaging board of directors.
Abbreviations:
- Dlco
- diffusing capacity of lung for carbon monoxide
- FEV1
- forced expiratory volume in 1st second of expiration
- OR
- odds ratio
- PACS
- postacute COVID-19 syndrome
- SGRQ
- St George Respiratory Questionnaire
- Spo2
- pulse oximetry estimation of arterial blood oxygen saturation
- 6MWD
- 6-minute walk distance
- VDP
- ventilation defect percent
References
- 1. Nalbandian A , Sehgal K , Gupta A , et al . Post-acute COVID-19 syndrome . Nat Med 2021. ; 27 ( 4 ): 601 – 615 . [DOI] [PMC free article] [PubMed] [Google Scholar]
- 2. Montani D , Savale L , Noel N , et al . Post-acute COVID-19 syndrome . Eur Respir Rev 2022. ; 31 ( 163 ): 210185 . [DOI] [PMC free article] [PubMed] [Google Scholar]
- 3. Lorent N , Vande Weygaerde Y , Claeys E , et al . Prospective longitudinal evaluation of hospitalised COVID-19 survivors 3 and 12 months after discharge . ERJ Open Res 2022. ; 8 ( 2 ): 00004 – 2022 . [DOI] [PMC free article] [PubMed] [Google Scholar]
- 4. Wu X , Liu X , Zhou Y , et al . 3-month, 6-month, 9-month, and 12-month respiratory outcomes in patients following COVID-19-related hospitalisation: a prospective study . Lancet Respir Med 2021. ; 9 ( 7 ): 747 – 754 . [DOI] [PMC free article] [PubMed] [Google Scholar]
- 5. Tran VT , Porcher R , Pane I , Ravaud P . Course of post COVID-19 disease symptoms over time in the ComPaRe long COVID prospective e-cohort . Nat Commun 2022. ; 13 ( 1 ): 1812 . [DOI] [PMC free article] [PubMed] [Google Scholar]
- 6. Wynberg E , van Willigen HDG , Dijkstra M , et al . Evolution of Coronavirus Disease 2019 (COVID-19) Symptoms During the First 12 Months After Illness Onset . Clin Infect Dis 2022. ; 75 ( 1 ): e482 – e490 . [DOI] [PMC free article] [PubMed] [Google Scholar]
- 7. Seeßle J , Waterboer T , Hippchen T , et al . Persistent Symptoms in Adult Patients 1 Year After Coronavirus Disease 2019 (COVID-19): A Prospective Cohort Study . Clin Infect Dis 2022. ; 74 ( 7 ): 1191 – 1198 . [DOI] [PMC free article] [PubMed] [Google Scholar]
- 8. Myall KJ , Mukherjee B , Castanheira AM , et al . Persistent Post-COVID-19 Interstitial Lung Disease. An Observational Study of Corticosteroid Treatment . Ann Am Thorac Soc 2021. ; 18 ( 5 ): 799 – 806 . [DOI] [PMC free article] [PubMed] [Google Scholar]
- 9. Kanne JP , Bai H , Bernheim A , et al . COVID-19 Imaging: What We Know Now and What Remains Unknown . Radiology 2021. ; 299 ( 3 ): E262 – E279 . [DOI] [PMC free article] [PubMed] [Google Scholar]
- 10. Solomon JJ , Heyman B , Ko JP , Condos R , Lynch DA . CT of Post-Acute Lung Complications of COVID-19 . Radiology 2021. ; 301 ( 2 ): E383 – E395 . [DOI] [PMC free article] [PubMed] [Google Scholar]
- 11. Li H , Zhao X , Wang Y , et al . Damaged lung gas exchange function of discharged COVID-19 patients detected by hyperpolarized 129Xe MRI . Sci Adv 2021. ; 7 ( 1 ): eabc8180 . [DOI] [PMC free article] [PubMed] [Google Scholar]
- 12. Grist JT , Chen M , Collier GJ , et al . Hyperpolarized 129Xe MRI Abnormalities in Dyspneic Patients 3 Months after COVID-19 Pneumonia: Preliminary Results . Radiology 2021. ; 301 ( 1 ): E353 – E360 . [DOI] [PMC free article] [PubMed] [Google Scholar]
- 13. Grist JT , Collier GJ , Walters H , et al . Lung Abnormalities Detected with Hyperpolarized 129Xe MRI in Patients with Long COVID . Radiology 2022. ; 305 ( 3 ): 709 – 717 . [DOI] [PMC free article] [PubMed] [Google Scholar]
- 14. Matheson AM , McIntosh MJ , Kooner HK , et al . Persistent 129Xe MRI Pulmonary and CT Vascular Abnormalities in Symptomatic Individuals with Post-acute COVID-19 Syndrome . Radiology 2022. ; 305 ( 2 ): 466 – 476 . [DOI] [PMC free article] [PubMed] [Google Scholar]
- 15. Kooner HK , McIntosh MJ , Matheson AM , et al . 129Xe MRI ventilation defects in ever-hospitalised and never-hospitalised people with post-acute COVID-19 syndrome . BMJ Open Respir Res 2022. ; 9 ( 1 ): e001235 . [DOI] [PMC free article] [PubMed] [Google Scholar]
- 16. Albert MS , Cates GD , Driehuys B , et al . Biological magnetic resonance imaging using laser-polarized 129Xe . Nature 1994. ; 370 ( 6486 ): 199 – 201 . [DOI] [PubMed] [Google Scholar]
- 17. Svenningsen S , Kirby M , Starr D , et al . What are ventilation defects in asthma? Thorax 2014. ; 69 ( 1 ): 63 – 71 . [DOI] [PubMed] [Google Scholar]
- 18. de Lange EE , Altes TA , Patrie JT , et al . Changes in regional airflow obstruction over time in the lungs of patients with asthma: evaluation with 3He MR imaging . Radiology 2009. ; 250 ( 2 ): 567 – 575 . [DOI] [PubMed] [Google Scholar]
- 19. Svenningsen S , McIntosh M , Ouriadov A , et al . Reproducibility of Hyperpolarized 129Xe MRI Ventilation Defect Percent in Severe Asthma to Evaluate Clinical Trial Feasibility . Acad Radiol 2021. ; 28 ( 6 ): 817 – 826 . [DOI] [PubMed] [Google Scholar]
- 20. Chen S , Lan Y , Li H , et al . Relationship between Lung and Brain Injury in COVID-19 Patients: A Hyperpolarized 129Xe-MRI-based 8-Month Follow-Up . Biomedicines 2022. ; 10 ( 4 ): 781 . [DOI] [PMC free article] [PubMed] [Google Scholar]
- 21. Inui S , Yoon SH , Doganay O , Gleeson FV , Kim M . Impaired pulmonary ventilation beyond pneumonia in COVID-19: A preliminary observation . PLoS One 2022. ; 17 ( 1 ): e0263158 . [DOI] [PMC free article] [PubMed] [Google Scholar]
- 22. Jones PW , Quirk FH , Baveystock CM , Littlejohns P . A self-complete measure of health status for chronic airflow limitation. The St. George’s Respiratory Questionnaire . Am Rev Respir Dis 1992. ; 145 ( 6 ): 1321 – 1327 . [DOI] [PubMed] [Google Scholar]
- 23. Mahler DA , Ward J , Fierro-Carrion G , et al . Development of self-administered versions of modified baseline and transition dyspnea indexes in COPD . COPD 2004. ; 1 ( 2 ): 165 – 172 . [DOI] [PubMed] [Google Scholar]
- 24. Borg GA . Psychophysical bases of perceived exertion . Med Sci Sports Exerc 1982. ; 14 ( 5 ): 377 – 381 . [PubMed] [Google Scholar]
- 25. Craig CL , Marshall AL , Sjöström M , et al . International physical activity questionnaire: 12-country reliability and validity . Med Sci Sports Exerc 2003. ; 35 ( 8 ): 1381 – 1395 . [DOI] [PubMed] [Google Scholar]
- 26. Enright PL . The six-minute walk test . Respir Care 2003. ; 48 ( 8 ): 783 – 785 . [PubMed] [Google Scholar]
- 27. Miller MR , Hankinson J , Brusasco V , et al . Standardisation of spirometry . Eur Respir J 2005. ; 26 ( 2 ): 319 – 338 . [DOI] [PubMed] [Google Scholar]
- 28. Robinson PD , Latzin P , Verbanck S , et al . Consensus statement for inert gas washout measurement using multiple- and single- breath tests . Eur Respir J 2013. ; 41 ( 3 ): 507 – 522 . [DOI] [PubMed] [Google Scholar]
- 29. Macintyre N , Crapo RO , Viegi G , et al . Standardisation of the single-breath determination of carbon monoxide uptake in the lung . Eur Respir J 2005. ; 26 ( 4 ): 720 – 735 . [DOI] [PubMed] [Google Scholar]
- 30. King GG , Bates J , Berger KI , et al . Technical standards for respiratory oscillometry . Eur Respir J 2020. ; 55 ( 2 ): 1900753 . [DOI] [PubMed] [Google Scholar]
- 31. Horsley AR , Gustafsson PM , Macleod KA , et al . Lung clearance index is a sensitive, repeatable and practical measure of airways disease in adults with cystic fibrosis . Thorax 2008. ; 63 ( 2 ): 135 – 140 . [DOI] [PubMed] [Google Scholar]
- 32. Ferrer M , Villasante C , Alonso J , et al . Interpretation of quality of life scores from the St George’s Respiratory Questionnaire . Eur Respir J 2002. ; 19 ( 3 ): 405 – 413 . [DOI] [PubMed] [Google Scholar]
- 33. Eddy RL , Svenningsen S , McCormack DG , Parraga G . What is the minimal clinically important difference for helium-3 magnetic resonance imaging ventilation defects? Eur Respir J 2018. ; 51 ( 6 ): 1800324 . [DOI] [PubMed] [Google Scholar]
- 34. Jones PW , Beeh KM , Chapman KR , Decramer M , Mahler DA , Wedzicha JA . Minimal clinically important differences in pharmacological trials . Am J Respir Crit Care Med 2014. ; 189 ( 3 ): 250 – 255 . [DOI] [PubMed] [Google Scholar]
- 35. Puhan MA , Chandra D , Mosenifar Z , et al . The minimal important difference of exercise tests in severe COPD . Eur Respir J 2011. ; 37 ( 4 ): 784 – 790 . [DOI] [PMC free article] [PubMed] [Google Scholar]
- 36. Jones PW . St. George’s Respiratory Questionnaire: MCID . COPD 2005. ; 2 ( 1 ): 75 – 79 . [DOI] [PubMed] [Google Scholar]
- 37. Cho JL , Villacreses R , Nagpal P , et al . Quantitative Chest CT Assessment of Small Airways Disease in Post-Acute SARS-CoV-2 Infection . Radiology 2022. ; 304 ( 1 ): 185 – 192 . [DOI] [PMC free article] [PubMed] [Google Scholar]
- 38. Adeloye D , Elneima O , Daines L , et al . The long-term sequelae of COVID-19: an international consensus on research priorities for patients with pre-existing and new-onset airways disease . Lancet Respir Med 2021. ; 9 ( 12 ): 1467 – 1478 . [DOI] [PMC free article] [PubMed] [Google Scholar]


![Forest plots show that treatment with prescribed respiratory medication (Rx) 3 months after COVID-19 infection predicted an improved St George Respiratory Questionnaire (SGRQ) score (odds ratio [OR], 4.0; P = .03) greater than or equal to the minimal clinically important difference at 15 months, but not improved 6-minute walk distance (6MWD) (OR, 2.9; P = .08), forced expiratory volume in 1st second of expiration (FEV1) (OR, 1.1; P = .9), or 129Xe MRI ventilation defect percent (VDP) (OR, 0.9; P = .9). The triangle indicates change at 15 months compared with 3 months. * indicates P < .05.](https://cdn.ncbi.nlm.nih.gov/pmc/blobs/2d48/10102632/7f5157e29b94/radiol.222557.fig6.jpg)