. 2023 Feb 7;307(2):e222557. doi: 10.1148/radiol.222557

Figure 4:

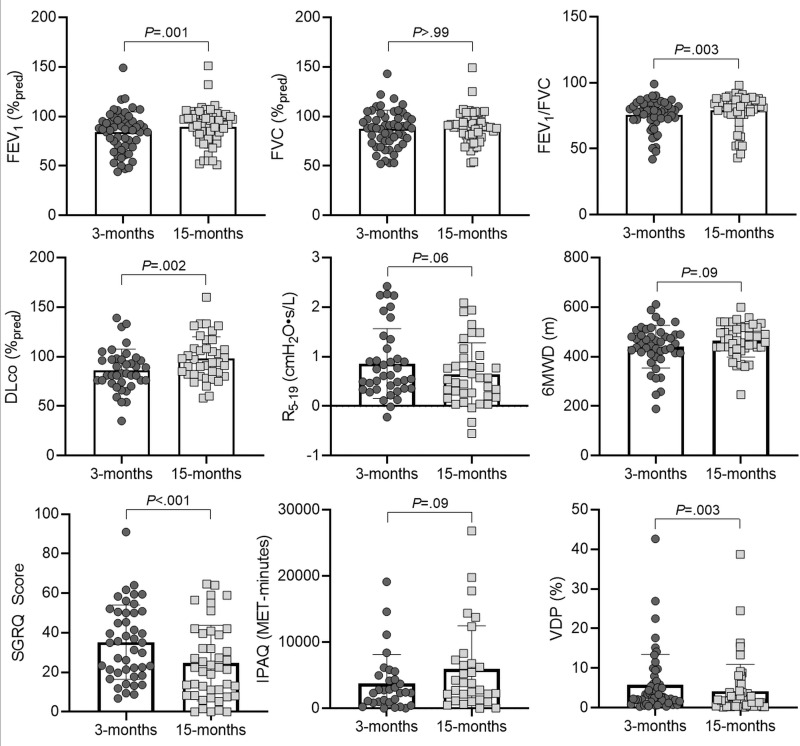
Scatterplots and bar graphs show pulmonary function, exercise capacity, and quality of life 3 months and 15 months after COVID-19 infection. Holm-Bonferroni correction indicates a statistically significant difference for forced expiratory volume in 1st second of expiration (FEV1) (P = .001), FEV1/FVC (P = .003), diffusing capacity of lung for carbon monoxide (Dlco) (P = .002), St George Respiratory Questionnaire (SGRQ) score (P < .001), and 129Xe MRI ventilation defect percent (VDP) (P = .003) at 15 months compared with 3 months. Forced vital capacity (FVC) (P > .99), oscillometry measurement of distal airway resistance (R5–19) (P = .06), 6-minute walk distance (6MWD) (P = .09), and International Physical Activity Questionnaire (IPAQ) (P = .09) did not differ significantly. MET = metabolic equivalent, %pred = percent predicted.

Scatterplots and bar graphs show pulmonary function, exercise capacity, and quality of life 3 months and 15 months after COVID-19 infection. Holm-Bonferroni correction indicates a statistically significant difference for forced expiratory volume in 1st second of expiration (FEV1) (P = .001), FEV1/FVC (P = .003), diffusing capacity of lung for carbon monoxide (Dlco) (P = .002), St George Respiratory Questionnaire (SGRQ) score (P < .001), and 129Xe MRI ventilation defect percent (VDP) (P = .003) at 15 months compared with 3 months. Forced vital capacity (FVC) (P > .99), oscillometry measurement of distal airway resistance (R5–19) (P = .06), 6-minute walk distance (6MWD) (P = .09), and International Physical Activity Questionnaire (IPAQ) (P = .09) did not differ significantly. MET = metabolic equivalent, %pred = percent predicted.