

ABSTRACT
With increasing demand for high-quality pork, development of green and healthy feed for finishing pigs is urgently needed. In this study, the effects and mechanisms of mulberry and paper mulberry silages on growth performance, meat quality, and intestinal health of finishing pigs were explored. Intestinal microbiota were profiled, and microbially produced short-chain fatty acids (SCFAs) were measured. The average daily gain (ADG) and feed conversion rate (FCR) with mulberry and paper mulberry silages were not significantly different from those of the control. Meat quality as measured by pork marbling and fatty acids in the longissimus dorsi was better with mulberry silage. The highest concentration of SCFAs was also with mulberry silage. According to 16S rRNA sequencing, Clostridium_sensu_stricto_1, Terrisporobacter, and Lachnospiraceae, which are important in SCFA production, were biomarkers of mulberry silage. PICRUSt functional analysis of intestinal microbes indicated that galactose metabolism, starch and sucrose metabolism, and carbohydrate digestion and absorption decreased significantly in silage treatments but increased in the control. Correlations between intestinal microbes and SCFAs and fatty acids indicated Clostridium_sensu_stricto_1, Terrisporobacter, and Lachnospiraceae were closely associated with SCFA and fatty acid contents. The results indicated that mulberry silage could increase SCFA content through shaping intestinal microbes to affect the deposition of fatty acids, which laid a solid theoretical foundation for improving pork quality.
IMPORTANCE To avoid competition between people and animals for food, it is essential to develop nontraditional feeds. In this study, the effects of the silages of the unconventional feed resources mulberry and paper mulberry on meat quality of finishing pigs were examined. With mulberry silage in the diet, meat quality improved as indicated by meat color, marbling score, and beneficial fatty acids in the longissimus dorsi muscle. Pigs fed mulberry silage had the highest concentrations of short-chain fatty acids (SCFAs), and 16S rRNA sequencing identified Clostridium_sensu_stricto_1, Terrisporobacter, and Lachnospiraceae as biomarkers, which are important in SCFA production. Functions of intestinal microbes in the two silage groups primarily involved amino acid metabolism and SCFA production. Correlations between intestinal microbes and SCFAs and fatty acids indicated that Clostridium_sensu_stricto-1, Terrisporobacter, and Lachnospiraceae were closely associated with SCFA contents in the intestine and fatty acids in the longissimus dorsi.
KEYWORDS: finishing pigs, meat quality, mulberry silage, paper mulberry silage, SCFAs, gut microbiota
INTRODUCTION
Pork is one of the most important meat products for consumers. As the living standard of people improves, the demand for high-quality pork increases. Many factors affect pork quality, among which feed is the most important and the most easily controlled (1). Competition between people and animals for food is currently a serious problem. Therefore, there is demand to develop nontraditional feeds with potential benefits for animal productivity. Grasses, shrubs, trees, and other resources have been widely explored as nontraditional feeds to provide a high-protein and -fiber supplement to low-protein and -fiber feed. Mulberry and paper mulberry are unconventional feed resources. The crude protein content of mulberry leaves is 27.63 to 37.36 g/100 g dry weight (DW), the crude fiber content is 9.90 to 13.85 g/100 g DW (2), and the crude fat content is 0.64% to 1.51% (3). Mulberry is currently widely used in livestock and poultry production (4). Mulberry leaves also contain a variety of bioactive substances, such as alkaloids, polysaccharides, and flavonoids (5), which have antioxidant and antibacterial activities and improve immunity (6). Therefore, mulberry leaves are considered “green and healthy” feed additives, and when used properly, they can replace probiotics to improve animal immune function and prevent diseases (7). Mulberry leaves have good palatability and high digestibility—generally as high as 70% to 90%—with relatively high protein and essential amino acid contents, which is very similar to alfalfa hay (8). Because of such characteristics, mulberry leaves have recently become a focus of research as an unconventional feed for animals. Paper mulberry is another tree in the family Moraceae with leaves that are rich in nutrients and contain high crude protein, crude ash, crude fat, and phosphorus contents and a suitable content of crude fiber (9). Paper mulberry leaves contain 21.6% crude protein, 4.3% ether extract, and 1.9% calcium (10). The leaves are usually used as a type of high-quality feed for cattle, pigs, and sheep because of the high nutritional value and high contents of crude protein, lysine, and methionine. Because of the many beneficial effects, including antibacterial and antioxidative activities and increasing immunity, paper mulberry leaves are also often used as animal feed supplements (11). Paper mulberry leaves are usually made into silage to improve digestibility. Addition of paper mulberry leaves extract to food for weaned piglets at an appropriate dose can improve growth performance, increase antioxidant capacity and immune function, and reduce diarrhea (12).
According to their own characteristics, mulberry and paper mulberry can be made into silage feed for animals, which has many advantages. Silage reduces nutrient loss during harvest and storage to the maximum extent and improves the efficiency of feed treatment (13). Silage feed has high moisture content and good palatability, which can eliminate antinutritional factors (14). However, 50% of protein is converted into nonprotein nitrogen in silage feed, which cannot be used by monogastric animals. Recent studies have shown that intestinal microbes can regulate host-related biological processes, including nutrient production and energy metabolism in diet (15). Moreover, a study has shown that the external environment and feed are the main factors affecting gut microbes (16). Therefore, adjustment of intestinal microbes through feed to improve animal growth performance is an effective strategy. Many studies are currently investigating silage application in monogastric animals. For example, feeding fattening pigs fermented apple pomace can affect meat quality and fatty acid composition (17), and feeding broilers a fermented cottonseed meal diet has positive effects on growth performance and intestinal health (18). However, the application of mulberry and paper mulberry silages (MS and PMS, respectively) in pig production needs further study.
In this study, to investigate the effects of MS and PMS on finishing pigs, growth performance, meat quality, intestinal microbes, and short-chain fatty acids (SCFAs) in the intestine were analyzed. In addition, mechanisms were explored by examining interactions between intestinal microbes, SCFAs, and muscle fatty acids. The goal was to clarify the influence and possible mechanisms of MS and PMS feeds on growth performance, meat quality, and intestinal health of finishing pigs, as well as provide a solid theoretical foundation to improve pork quality and strategies to identify new feed resources.
RESULTS
Effects of mulberry and paper mulberry silages on growth performance of finishing pigs.
To investigate the effects of mulberry and paper mulberry silages (MS and PMS, respectively) on growth performance of finishing pigs, the average daily gain (ADG) and feed conversion rate (FCR) of finishing pigs in different treatment groups were calculated. Each treatment had 4 replicates, and each replicate had 20 finishing pigs. The ADG and FCR of mulberry and paper mulberry silage groups were not significantly different from those of the control (P > 0.05) (Table 1).
TABLE 1.
Effects of different diets on growth performance of finishing pigs
| Groupa | Result forb: |
|
|---|---|---|
| ADG (kg/head/day) | FCR | |
| CON | 0.87 ± 0.06 | 3.12 ± 0.21 |
| MS | 0.89 ± 0.02 | 3.05 ± 0.07 |
| PMS | 0.82 ± 0.08 | 3.31 ± 0.29 |
CON, control group; MS, mulberry silage group; PMS, paper mulberry silage group.
ADG, average daily gain; FCR, feed conversion rate. The data were evaluated by one-way ANOVA, and the difference between the average values was evaluated by Duncan’s test. P < 0.05 is considered to be statistically significant. The values are the mean ± standard deviation. Each treatment has 4 replicates, and each replicate has 20 finishing pigs (n = 80).
Effects of mulberry and paper mulberry silages on meat quality.
To determine the effects of mulberry and paper mulberry silages on the physical characteristics of meat, meat color, water holding capacity, marbling score, and drip loss were observed in 4 samples per treatment. One sample was randomly selected from each replicate in the same treatment. Meat color was assessed by redness (a*), yellowness (b*), and lightness (L*). The L* value is the brightness coefficient, and a* and b* values are the color coefficients for red-green and yellow-blue, respectively. The L* value of the paper mulberry silage group was significantly higher than that of the control, whereas there was no significant difference between silage groups (Table 2). The a* value in the mulberry silage group tended to increase over that of the control group. The water holding capacity of the paper mulberry silage group was significantly higher than those of the control and mulberry silage groups (P < 0.01) (Table 2). There was no significant difference in marbling scores between silage groups, but both had significantly higher scores than that in the control (P < 0.05) (Table 2). Meat marbling images with the three treatments are shown in Fig. 1A.
TABLE 2.
Effects of the different diets on meat quality of finishing pigs
| Characteristic | Result fora: |
||
|---|---|---|---|
| CON | MS | PMS | |
| Lightness (L*) | 49.72 ± 0.52 b | 50.28 ± 1.14 ab | 51.31 ± 0.86 a |
| Redness (a*) | 9.55 ± 1.37 | 10.15 ± 0.41 | 9.30 ± 0.80 |
| Yellowness (b*) | 2.73 ± 2.47 | 1.82 ± 0.20 | 1.89 ± 0.77 |
| Drip loss (%) | 4.20 ± 0.36 | 3.33 ± 0.92 | 3.67 ± 1.46 |
| Water holding capacity (%) | 2.80 ± 0.10 B | 3.10 ± 0.35 B | 4.33 ± 0.40 A |
| Marbling score | 1.83 ± 0.29 b | 2.33 ± 0.29 a | 2.50 ± 0.00 a |
CON, control group; MS, mulberry silage group; PMS, paper mulberry silage group. The data were evaluated by one-way ANOVA, and the difference between the average values was evaluated by Duncan’s test. Values are the mean ± standard deviation. Different small letters indicate significant difference (P < 0.05), and the presence of the same small letters or no letters indicates no significant difference (P > 0.05). Different capital letters indicate extremely significant difference (P < 0.01), and the presence of the same capital letters or no letters indicates no significant difference (P > 0.05). One sample was randomly selected from each replicate in the same treatment (i.e., 4 samples per treatment [n = 4]).
FIG 1.

Effects of mulberry and paper mulberry silages on meat quality and fatty acids in the longissimus dorsi muscle of finishing pigs. (A) Marbling score of pork; (B to E) content of fatty acids in longissimus dorsi muscle. CON, control; MS, mulberry silage; PMS, paper mulberry silage. One sample was randomly selected from each replicate in the same treatment (i.e., 4 samples per treatment [n = 4]). The data were evaluated by one-way ANOVA, and the difference between the average values was evaluated by Duncan’s test (*, P < 0.05; **, P < 0.01; ns, nonsignificant difference). The error bars show the standard deviation (SD).
Among fatty acids of the longissimus dorsi muscle, oleic acid (C18:1), monounsaturated fatty acid (MUFA), and myristic acid (C14:0) decreased significantly in the MS group compared with the control (P < 0.05) (Fig. 1B and C). In addition, stearic acid (C18:0) and saturated fatty acid (SFA) decreased significantly in the MS group compared with the control and PMS groups (P < 0.01) (Fig. 1B). Compared with the PMS group, arachidonic acid (C20:1) decreased significantly in the MS group (P < 0.01) (Fig. 1C), whereas α-linolenic acid (C18:3) and ω-3FA increased significantly in the MS group (P < 0.05) (Fig. 1C). Arachidonic acid (C20:4) increased significantly in the MS and PMS groups (P < 0.01) (Fig. 1C). Arachidonic acid (C20:2), linoleic acid (C18:2), polyunsaturated fatty acid (PUFA), and ω-6FA increased significantly in the MS group compared with the control and PMS groups (Fig. 1C and D). There were no significant differences in amounts of other fatty acids among the three groups (Fig. 1E). The results suggested that the mulberry silage treatment was the most beneficial for the production of fatty acids in the longissimus dorsi.
Concentrations of short-chain fatty acids in the colon of finishing pigs.
One sample was randomly selected from each replicate in the same treatment (i.e., four samples per treatment), and concentrations of SCFAs in the colon of finishing pigs were determined. Concentrations of acetic acid (AA), propionic acid (PA), and total SCFAs in the two silage groups were significantly higher than those in the control (P < 0.05) (Fig. 2). Butyric acid (BA) content was significantly higher in the mulberry silage group than in the paper mulberry silage and control groups (P < 0.05) (Fig. 2).
FIG 2.
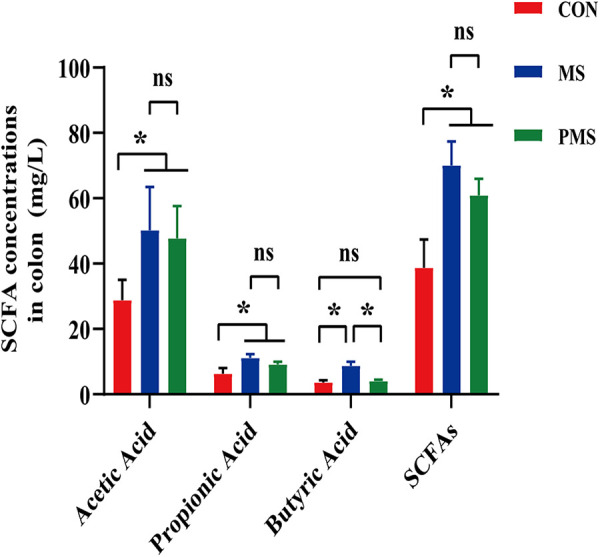
Concentration of short-chain fatty acids in the colon of finishing pigs. CON, control; MS, mulberry silage; PMS, paper mulberry silage. One sample was randomly selected from each replicate in the same treatment (i.e., 4 samples per treatment [n = 4]). The data were evaluated by one-way ANOVA, and the difference between the average values was evaluated by Duncan’s test (*, P < 0.05; **, P < 0.01; ns, nonsignificant difference). The error bars show the SD.
Diversity index analysis of cecum and colon microbes.
Four cecum samples and four colon samples per treatment (one sample was randomly selected from each replicate in the same treatment, and cecum and colon samples were from the same pig) were sequenced by Illumina MiSeq, and 1,489,912 optimized sequences were obtained, with a total of 646,921,498 bases. The average sequence length of the samples was ~434 bp. Totals of 1,133 operational taxonomic units (OTUs) in the cecum and 1,165 OTUs in the colon were obtained. Rarefaction curves of deep sequencing of the 16S rRNA gene in the V3-V4 region of cecum samples are presented in Fig. S1A in the supplemental material. In the cecum, there were 1,133 OTUs in the three treatment groups. There were 786 OTUs in the three treatment groups, 43 OTUs in the cecum control (CCe) and mulberry silage (MSCe) groups, 66 OTUs in the CCe and cecum paper mulberry silage (PMSCe) groups, and 98 OTUs in the MSCe and PMSCe groups (Fig. S1B). Principal-coordinate analysis (PCoA) indicated the cecum microbial compositions of the MSCe and PMSCe treatment groups were similar (Fig. S1C). Richness and diversity of cecum microbes in different treatment groups were also analyzed. There were no significant differences in the Shannon and Chao indices among cecum microbes in different treatments, but diversity and richness of microbes in the two silage groups were higher than those in the control (Fig. S1D and E). Rarefaction curves of deep sequencing of the 16S rRNA gene in the V3-V4 region of cecum samples are presented in Fig. S2A. In the colon, there were 1,165 OTUs in the three treatment groups. There were 831 OTUs in three treatment groups, 41 OTUs in the colon control (CCo) and mulberry silage (MSCo) groups, 67 OTUs in the CCo and colon paper mulberry silage (PMSCo) groups, and 90 OTUs in the MSCo and PMSCo groups (Fig. S2B). A PCoA indicated that microbes in the MSCo and PMSCo treatment groups were similar and were separate from those in the CCo treatment group (Fig. S2C). There were no significant differences in the Shannon index results among treatments. However, the Chao index of the PMSCo group was significantly higher than that of the control, indicating that species richness in the PMSCo group was significantly higher than that of the control (P < 0.05) (Fig. S2D and E).
Composition and difference in intestinal microbes at the phylum level.
Cecum microbes were mainly composed of six phyla, including Firmicutes, Bacteroidetes, Actinobacteria, Proteobacteria, Verrucomicrobia, and Spirochaetae (Fig. 3A). Firmicutes and Bacteroidota were the two most important phyla, accounting for more than 88% in the three groups. The five most abundant phyla of bacteria were Firmicutes (87.27%), Bacteroidota (8.80%), Actinobacteriota (2.49%), Proteobacteria (0.80%), and Spirochaetota (0.27%) in the CCe group, Firmicutes (78.23%), Bacteroidota (15.53%), Proteobacteria (2.50%), Actinobacteriota (1.16%), and Spirochaetota (1.11%) in the MSCe group, and Firmicutes (81.86%), Bacteroidota (7.85%), Proteobacteria (4.65%), Actinobacteriota (2.57%), and Verrucomicrobiota (1.26%) in the PMSCe group (Fig. 3A). The abundance of Proteobacteria in both silage groups was higher than that in the control group, but only in the PMSCe group was the abundance significantly higher than that in the control group (P < 0.01) (Fig. 3B).
FIG 3.

Composition of and differences in intestinal microbes at the phylum level. (A) Microbial composition of the cecum at the phylum level; (B) differential expression of microbes in different groups; (C) microbial composition of the colon at the phylum level. The data are means ± SD. *, 0.01 < P < 0.05; **, P < 0.01. CCe, cecum of the control; MSCe, cecum of the mulberry silage group; PMSCe, cecum of the paper mulberry silage group; CCo, colon of the control; MSCo, colon of the mulberry silage group; PMSCo, colon of the paper mulberry silage group. One sample was randomly selected from each replicate in same treatment (i.e., 4 samples in cecum and 4 samples in colon per treatment [n = 4]).
The composition of the colon microbe phyla was similar to that in the cecum (Fig. 3C), with Firmicutes, Bacteroidetes, Spirochaetae, Actinobacteria, and Proteobacteria the most abundant phyla. Firmicutes and Bacteroidota were the two most important phyla, accounting for more than 92% in the three groups. The five most abundant phyla of bacteria were Firmicutes (75.65%), Bacteroidota (18.84%), Spirochaetota (2.99%), Actinobacteriota (1.74%), and Desulfobacterota (0.31%) in the CCo group, Firmicutes (82.21%), Bacteroidota (13.35%), Spirochaetota (1.35%), Proteobacteria (1.14%), and Actinobacteriota (0.91%) in the MSCo group, and Firmicutes (76.58%), Bacteroidota (16.63%), Spirochaetota (2.02%), Proteobacteria (1.88%), and Actinobacteriota (1.08%) in the PMSCo group (Fig. 3C). However, there were no significant differences in phyla of colon microbes among the groups.
Screening of cecum microbial biomarkers at the genus level.
Cecum microbial communities were relatively complex, with many species. The three most abundant genera of microbes in the cecum were Lactobacillus (25.95%), Clostridium_sensu_stricto_1 (17.56%), and Terrisporobacter (9.25%) in the CCe group, Terrisporterobacter (18.83%), Clostridium_sensu_stricto_1 (16.21%), and UCG-005 (8.52%) in the MSCe group, and Terrisporobacter (14.57%), UCG-005 (11.42%), and Clostridium_sensu_stricto_1 (14.03%) in the PMSCe group (Fig. 4A). The volcano map showed that compared with CCe, 39 OTUs were significantly downregulated and 12 were significantly upregulated in the MSCe group (Fig. 4B) and 50 OTUs were significantly downregulated and 24 were significantly upregulated in the PMSCe group (Fig. 4C).
FIG 4.

Screening of microbial biomarkers of the cecum at the genus level. (A) Differential analysis of cecum microbes at the genus level; (B and C) differential volcano map (x-axis coordinate, log2 fold change [FC]; y-axis coordinate, adjusted P value). Each point in the graph represents an operational taxonomic unit (OTU), and the two lines parallel to the y axis represent FC = 2 and FC = −2. The dotted line parallel to the x axis represents −log10 (0.05), and the points above the dotted line represent OTUs with significance at P < 0.05. For each OTU, when P is <0.05 and at an FC of ≥2, the OTU has an intergroup difference. (D and F) Linear discriminant analysis (LDA) effect size (LEfSe) analysis representing differentially abundant taxa in the cecum (CCe and MSCe and CCe and PMSCe); (E and G) LDA cladogram (CCe and MSCe and CCe and PMSCe); (H and I) differential expression of intestinal microbes: (H) Lactobacillus and (I) Christensenellaceae_R-7_group. Values are the mean ± SD. *, 0.01 < P < 0.05; **, P < 0.01. CCe, cecum of the control; MSCe, cecum of the mulberry silage group; PMSCe, cecum of the paper mulberry silage group. There were 4 samples in cecum per treatment (n = 4).
On the basis of results of the volcano map, a linear discriminant analysis (LDA) effect size (LEfSe) analysis was used to identify the biomarkers associated with the silage groups. Candidate biomarkers in the MSCe group included Phascolarctobacterium, Acidaminococcaceae, Acidaminococcales, and Papillibacter (Fig. 4D and E), and those in the PMSCe group included Clostridia, Intestinimonas, Proteobacteria, Gammaproteobacteria, Christensenellaceae, Eubacteriales, Christensenellaceae_R-7_group, Christensenellales, Anaerovoracaceae, Peptococcales, Peptococcus, Coriobacteriales, Peptococcaceae, and Coriobacteriia (Fig. 4F and G). Thus, those microbial species were closely associated with the two silage groups. Relative abundance of Lactobacillus in the two silage groups decreased significantly compared with that in the CCe group (P < 0.05) (Fig. 4H). The relative abundance of Christensenellaceae_R-7_group in the PMSCe group increased significantly compared with those in the CCe and MSCe groups (Fig. 4I), indicating that the members of Christensenellaceae_R-7_group, acting as differential core microbes, played important roles in PMSCe group.
Screening of colon microbial biomarkers at the genus level.
The three most abundant genera of microbes in the colon were Lactobacillus (17.96%), Clostridium_sensu_stricto_1 (12.47%), and Streptococcus (10.86%) in the CCo group, Clostridium_sensu_stricto_1 (22.69%), Terrisporter (16.35%), and UCG-005 (6.84%) in the MSCo group, and Clostridium_sensu_stricto_1 (15.85%), Terrisporobacter (13.14%), and UCG-005 (7.00%) in the PMSCo group (Fig. 5A). The volcano map showed that compared with the CCo group, 8 OTUs were significantly downregulated and 5 were significantly upregulated in the MSCo group (Fig. 5B) and 11 OTUs were significantly downregulated and 8 were significantly upregulated in the PMSCo group (Fig. 5C).
FIG 5.

Screening of microbial biomarkers of the colon at the genus level. (A) Differential analysis of colon microbes at the genus level; (B and C) differential volcano map (x-axis coordinate, log2 fold change [FC]; y-axis coordinate, adjusted P value). Each point in the graph represents an operational taxonomic unit (OTU), and the two lines parallel to the y axis represent FC = 2 and FC = −2. The dotted line parallel to the x axis represents −log10 (0.05), and the points above the dotted line represent OTUs with significance at P < 0.05. For each OTU, when P is <0.05 and at an FC of ≥2, the OTU has an intergroup difference. (D and F) Linear discriminant analysis (LDA) effect size (LEfSe) analysis representing differentially abundant taxa in the colon (CCo and MSCo and CCo and PMSCo); (E and G) LDA cladogram (CCo and MSCo and CCo and PMSCo); (H to M) differential expression of intestinal microbes: (H) Clostridium_sensu_stricto_1, (I) Terrisporobacter, (J) Lactobacillus, (K) Lachnospiraceae, (L) Phascolarctobacterium, and (M) Rikenellaceae_RC9_gut group. Values are means ± SD. *, 0.01 < P < 0.05; **, P < 0.01. CCo, colon of the control; MSCo, colon of the mulberry silage group; PMSCo, colon of the paper mulberry silage group. There were 4 samples in colon per treatment (n = 4).
On the basis of the significantly different species screened at the genus level, an LEfSe analysis was used to identify colon biomarkers associated with the two experimental treatments. There were significant differences in relative abundances at the genus level between the control and the two silage groups. Compared with the control, candidate biomarkers in the MSCo group included Clostridia, Peptostreptococcales-Tissierellales, Peptostreptococcaceae, Terrisporobacter, Clostridiales, Clostridiaceae, Clostridium_sensu_stricto_1, Lachnospirales, and Lachnospiraceae (Fig. 5D and E) and those in the PMSCo group included Clostridia, Peptostreptococcales-Tissierellales, Phascolarctobacterium, Acidaminococcaceae, UCG-005, Acidaminococcales, Defluviitaleaceae, Defluviitaleaceae_UCG-011, norank_o__Oscillospirales, and Alistipes (Fig. 5F and G).
Six genera of bacteria were significantly different among the groups. Relative abundances of Clostridium_sensu_stricto_1 (Fig. 5H), Terrisporobacter (Fig. 5I), and Lachnospiraceae (Fig. 5K) in the MSCo group increased significantly compared with those in the CCo group, whereas the relative abundance of Lactobacillus decreased significantly (Fig. 5J). The relative abundance of Phascolarctobacterium (Fig. 5L) in the PMSCo group increased significantly compared with that in the CCo group, whereas that of Lactobacillus decreased significantly (Fig. 5J). The relative abundance of the Rikenellaceae_RC9_gut_group (Fig. 5M) in the PMSCo group increased significantly compared with that in MSCo group.
PICRUSt predictions of intestinal microbe functions.
To predict functions of the intestinal microbes, PICRUSt predictions of function were obtained based on the KEGG database, and STAMP software was used to select the 20 metabolic pathways with the most significant differences. Analysis of cecum microbes indicated that 10 metabolic pathways increased significantly in the MSCe group compared with the CCe group, including those of vitamin B6 metabolism, phenylalanine metabolism, and arginine and proline metabolism, and that 10 metabolic pathways decreased significantly in the MSCe group compared with the CCe group, including those of galactose metabolism, pentose phosphate, and starch and sucrose metabolism (Fig. 6A). Twelve metabolic pathways increased significantly in the PMSCe group compared with the CCe group, including those of propanoate metabolism, pentose and glucuronate interconversions, and lysine degradation, whereas 8 metabolic pathways decreased significantly in the PMSCe group compared with the CCe group, including those of carbohydrate digestion and absorption, galactose metabolism, and starch and sucrose metabolism (Fig. 6B).
FIG 6.

Prediction of metabolic pathways regulated by intestinal microbes. (A) Top 20 metabolic pathways with the most significant differences between CCe and MSCe; (B) top 20 metabolic pathways with the most significant differences between CCe and PMSCe; (C) top 20 metabolic pathways with the most significant differences between CCo and MSCo; (D) top 20 metabolic pathways with the most significant differences between CCo and PMSCo. CCe, cecum of the control; MSCe, cecum of the mulberry silage group; PMSCe, cecum of the paper mulberry silage group; CCo, colon of the control; MSCo, colon of the mulberry silage group; PMSCo, colon of the paper mulberry silage group.
Analysis of colon microbes indicated that 13 metabolic pathways increased significantly in the MSCo group compared with the CCo group, including those of porphyrin and chlorophyll metabolism, nitrogen metabolism, and nitrotoluene degradation, and that 7 metabolic pathways decreased significantly in the MSCo group compared with the CCo group, including those of DNA replication, methane metabolism, and glycine, serine, and threonine metabolism (Fig. 6C). Fourteen metabolic pathways increased significantly in the PMSCo group compared with the CCo group, including those of 2-oxocarboxylic acid metabolism, porphyrin and chlorophyll metabolism, and arginine and proline metabolism, and 6 metabolic pathways decreased significantly in the PMSCo group compared with the CCo group, including those of methane metabolism, glycolysis/gluconeogenesis, and peptidoglycan biosynthesis (Fig. 6D).
Correlation analysis between intestinal microbes and short-chain fatty acids and longissimus dorsi muscle fatty acids.
Pearson correlation analysis was used to determine the correlations between SCFAs and colon microbes. A metabolic association heat map indicated positive or negative correlations between SCFAs and microbes. Coprococcus and Terrisporobacter were positively correlated with BA, AA, PA, and total SCFAs. Unclassifed_f__lachnospiraceae was positively correlated with PA. Clostridium_sensu_stricto_1 was positively correlated with BA, PA, and total SCFAs. Lactobacillus was negatively correlated with AA, PA, BA, and total SCFAs, and norank_f__Muribaculaceae was negatively correlated with AA, PA, and total SCFAs (Fig. 7A). The results indicated that those microbes had important interactions with SCFAs.
FIG 7.

Correlation analysis of intestinal microbes with short-chain fatty acids and longissimus dorsi muscle fatty acids. (A) Correlation analysis of intestinal microbes with short-chain fatty acids; (B) correlation analysis of intestinal microbes with longissimus dorsi muscle fatty acids. The x axis presents environmental factors, and correlation coefficients (r) and P values were obtained by calculation. Coefficients are displayed in different colors as indicated by the legend on the right, with red representing a positive correlation and blue representing a negative correlation. P values were adjusted by FDR using the Benjamini-Hochberg method (FDR < 0.05). *, 0.01 < P < 0.05; **, P < 0.01; ***, P < 0.001.
Pearson correlations were also examined between fatty acids of the longissimus dorsi muscle and colon microbes. Lactobacillus, norank_f__Muribaculaceae, Treponema, Prevotellaceae_NK3B31_group, and Streptococcus were positively correlated with oleic acid (C18:1), whereas Clostridium_sensu_stricto_1, Turicibacter, Terrisporobacter, and Coprococcus were negatively correlated with oleic acid (C18:1). Lactobacillus, norank_f__Muribaculaceae, Treponema, Prevotellaceae_NK3B31_group, Streptococcus, Prevotella, and Rikenellaceae_RC9_gut_group were positively correlated with MUFA, whereas Clostridium_sensu_stricto_1, unclassified_f_Lachnospiraceae, Turicibacter, Terrisporobacter, and Coprococcus were negatively correlated with MUFA. Clostridium_sensu_stricto_1, unclassified_f__Lachnospiraceae, and Turicibacter were positively correlated with arachidonic acid (C20:4), while Lactobacillus was negatively correlated with arachidonic acid (C20:4). Clostridium_sensu_stricto_1, unclassified_f__Lachnospiraceae, and Turicibacter were positively correlated with PUFA, whereas Lactobacillus was negatively correlated with PUFA. Clostridium_sensu_stricto_1, unclassified_f__Lachnospiraceae, Turicibacter, Terrisporobacter, and Coprococcus were positively correlated with ω-6FA, but Lactobacillus and norank_f__Muribaculaceae were negatively correlated with ω-6FA (Fig. 7B). These results suggested that those microbes were important in the production of fatty acids in the longissimus dorsi.
DISCUSSION
Effects of different silage diets on growth performance of finishing pigs.
In recent years, silage feed has been increasingly provided to finishing pigs. Weight gain and FCR improve in finishing pigs fed clover silage (19), although there are no significant differences in ADG and FCR among treatments when finishing pigs are fed diets with 3% rye silage (20). Mulberry trees are rich in alkaloids, polyphenols, flavonoids, and anthocyanins, which are very beneficial for animal health (5), and leaves of paper mulberry are rich in alkaloids and flavonoids, which have high medicinal and nutritional value (12). In this study, mulberry and paper mulberry were silage processed and added to the diet of finishing pigs. The ADG and FCR were not significantly different between silage treatment groups and the control, which is a result not consistent with that in piglets (12). The difference in effects of silage may be because different growth stages of pigs have different nutritional requirements (21).
Effects of different silages on the meat quality of finishing pigs.
The physicochemical properties of pork, such as water holding capacity, drip loss, meat color, and marbling, and nutrients such as fatty acids are used to evaluate meat quality. The quality of pork is affected by many factors, including heredity, environment, and diet, but animal feed is a factor that directly affects meat quality (22). The overall acceptability of meat color, appearance, marbling score, and fresh meat sensory score of pigs fed silage is higher than that of commercial feed (23). In this study, the values of L* and a* indicted the best meat color was in the mulberry silage group. The water holding capacity of meat with paper mulberry silage in the diet was significantly higher than that of the control, while that in the mulberry silage group tended to be higher. The marbling scores of meat in the mulberry and paper mulberry silage groups were both significantly higher than that of the control. Effects on muscle water holding capacity are mainly due to the antioxidant capacity of muscle (24). Mulberry silage includes antioxidant flavonoids and polyphenols (5), and paper mulberry silage is rich in antioxidant polyphenols (25). The high levels of antioxidants might explain why water holding capacity in the silage groups was higher (better) than that in the control. Deposition of intramuscular fat directly affects the marbling score, and an increase in marbling affects the tenderness of pork (26). With increases in marbling, the edible quality gradually improves. However, too much fat has adverse effects on human health, and thus, the content of fat in pork should be controlled in a reasonable range of 1.5% to 2.5% (27). The results indicated that silage feed can improve the water holding capacity and intramuscular fat deposition of pork.
In addition to the physical properties, fatty acid composition also affects the quality of pork. Differences in diets can affect the production or deposition of fatty acids in pork. Compared with pigs fed conventional feed, pigs fed a red clover silage diet have relatively low levels of SFA and MUFA and relatively high levels of PUFAs, including ω-6FA and ω-3FA (28). In the mulberry silage group, amounts of oleic acid (C18:1), MUFA, stearic acid (C18:0), SFA, myristic acid (C14:0), and arachidonic acid (C20:1) decreased, whereas amounts of ω-3FA, α-linolenic acid (C18:3), arachidonic acid (C20:2 and C20:4), linoleic acid (C18:2), PUFA, and ω-6FA increased. The α-linolenic acid (C18:3) is the precursor of long-chain ω-3 fatty acids, which have a wide range of anti-inflammatory and cardioprotective effects (29). The ω-3FAs are most beneficial to human health and can reduce cholesterol and triglyceride contents in plasma and help prevent cardiovascular diseases (30). In animals, α-linolenic acid (C18:3), linoleic acid (C18:2), and arachidonic acid (C20:4) are essential fatty acids that can only be obtained from food. Polyunsaturated fatty acids are beneficial to human health and meet the needs of consumers (31). They can also increase the activity of T cells and help to improve the immune system and reduce the occurrence of inflammation and tumors (32). Therefore, silage diets had important effects on the nutritional value of pork by affecting the fatty acid composition.
Effects of different silage treatments on intestinal microbes and associated metabolites.
Short-chain fatty acids are the final products of fermentation of undigested substances in the hindgut and primarily include AA, PA, and BA (33). In the intestine, SCFAs are rapidly absorbed. Propionic acid is mainly used in the gluconeogenesis pathway, whereas AA can promote the synthesis of fatty acids and cholesterol (34). Butyric acid is primarily absorbed by intestinal epithelial cells and is the main energy source for metabolism of hindgut cells (35). In this study, contents of AA, PA, BA, and total SCFAs in the colon were higher in the silage groups than in the control. Short-chain fatty acids are the main metabolites of intestinal microbial fermentation. The 16S rRNA sequencing in the present study indicated that abundance of Proteobacteria at the phylum level was higher in the mulberry and paper mulberry silage groups than in the control, with the difference significant in the paper mulberry silage group. Proteobacteria is the most unstable phylum in the intestinal tract and is easily influenced by environmental factors such as diet, but it can also promote the production of lactic acid (36). At the genus level in the cecum, the phylum Christensenellaceae_R-7_group might be important as both core and differential bacteria in the paper mulberry silage group. Christensenellaceae_R-7_group belongs to Firmicutes and can produce SCFAs (37). Christensenellaceae_R-7_group is very important to the structure and function of the host intestinal tract (38) At the genus level in the colon, Clostridium_sensu_stricto_1, Terrisporobacter, and Lachnospiraceae were both core and differential bacteria of the mulberry silage group and therefore may have important roles. Clostridium_sensu_stricto_1 is a fiber-degrading bacterium that can degrade cellulose and hemicellulose by using glucose (39) and is also associated with the formation of SCFAs (40). Correlations between intestinal microbes and SCFAs were also evaluated. Clostridium_sensu_stricto_1 was significantly positively correlated with the production of PA, BA, and SCFAs. Terrisporobacter can generate lactic acid and synthesize BA by exploiting AA and lactic acid under anaerobic conditions, which prevents the accumulation of lactic acid to stabilize the intestinal environment (41). In this study, Terrisporobacter was significantly positively correlated with the production of AA, BA, PA, and SCFAs. Lachnospiraceae is an obligate anaerobic bacterium that is abundant in the human intestine, and it can resist the colonization of drug-resistant pathogens by converting primary bile acids into secondary bile acids and producing SCFAs (42). Moreover, Lachnospiraceae can convert butyrate to propionate on different substrates (43). In this study, Lachnospiraceae was significantly positively correlated with the production of PA. The functions of Clostridium_sensu_stricto_1, Terrisporobacter, and Lachnospiraceae explained why amounts of AA, PA, BA, and SCFAs were highest in the different diet groups. In addition, there was a significant increase of Phascolarctobacterium in the paper mulberry silage group of the colon compared with the control group. Phascolarctobacterium is one kind of asaccharolytic, succinate-utilizing bacterium (44), and propionic acid is the main end product of succinate fermentation (45). This may be one reason why the contents of acetic acid, propionic acid, and SCFAs increased significantly in the paper mulberry silage group. The Rikenellaceae_RC9_gut_group can produce propionate and acetate as fermentation end products (46). Lactobacillus bacteria can produce lactic acid from the fermentation of glucose or lactose (47). After silage, glucose content in feed is low (48). Therefore, when feeding silage to finishing pigs, high Lactobacillus abundance is not needed to metabolize glucose, which may explain why Lactobacillus abundance was higher in the control than in both silage groups. The correlation analysis between microbes and SCFAs further demonstrated that Coprococcus, as the main butyric acid-producing bacterium (49), is positively correlated with butyric acid, acetic acid, and propionic acid, possibly because acetic acid can be used as the substrate for butyric acid synthesis (50) and Coprococcuscatus can convert lactic acid into propionic acid through the acrylate pathway (51). Microbes function in host metabolism, and therefore, predictions of function by PICRUSt were analyzed by STAMP software. The results indirectly indicated that most of the microbes in the control group were involved probably in galactose, pentose phosphate, starch, sucrose, and glycolysis metabolism, while most of the microbes in the two silage groups were involved in vitamin B6, phenylalanine, arginine and proline, and propanoate metabolism and lysine degradation. The results demonstrated that galactose metabolism, starch and sucrose metabolism, carbohydrate digestion, and absorption significantly decreased in the silage feed treatment group, while they increased in the control group. Previous reports have shown that some protein and soluble sugar have been degraded during silage production (48, 52). In this study, the PICRUSt functional analysis of intestinal microbes also indicated that some proteins and soluble saccharides were most likely degraded during silage production.
Potential mechanism to improving meat quality.
Diet is important in determining tissue fatty acid content (53). Semova et al. reported that as the absorption rate of fatty acids in a diet increases the number and volume of fat droplets in intestinal epithelial cells and fat deposition increase (54). In addition, SCFAs produced by microbial fermentation can regulate the expression of genes related to fat metabolism. Acetic acid can promote the synthesis of fatty acids and cholesterol (55), whereas PA can inhibit AA from producing cholesterol and fat in the liver (56). Short-chain fatty acids also have effects on fat storage (57). Therefore, SCFAs produced by intestinal microbial fermentation may directly regulate the expression of genes associated with lipid metabolism or act as signal molecules to regulate the production of intramuscular fat. Correlations between intestinal microbes and fatty acids also indicated that Clostridium_sensu_stricto_1 promoted the accumulation of arachidonic acid (C20:4), PUFA, and ω-6FA and inhibited the accumulation of oleic acid (C18:1) and MUFA. In addition, correlations indicated that Terrisporobacter promoted the accumulation of ω-6FA and inhibited the accumulation of oleic acid (C18:1) and MUFA. Lachnospiraceae promoted the accumulation of arachidonic acid (C20:4), PUFA, and ω-6FA and inhibited the accumulation of MUFA. In pigs, the driving force has been to increase with a higher ratio of PUFA to saturated fatty acids to produce healthier meat, which can be achieved by feeding (58). It can be seen that Clostridium_sensu_stricto_1, Terrisporobacter, and Lachnospiraceae acting as SCFA-producing bacteria were also closely related to meat fatty acids. Overall, feeding finishing pigs silage feed in this study, especially mulberry silage, improved meat quality by altering intestinal microbial communities to increase the abundance of SCFA-producing and beneficial microbes. The resulting changes in bacteria can alter the content of intestinal SCFAs, which can affect the generation and deposition of muscle fatty acids. The study provides a theoretical basis for the application of mulberry silage in finishing pigs and identifies a new strategy to improve meat quality.
MATERIALS AND METHODS
Ethics approval.
The animal study was approved by the Institutional Animal Ethics Committee of Henan Agricultural University (approval HENAU-2020-013).
Animal experiment.
A total of 240 healthy finishing pigs (Duroc × Landrace × Yorkshire) with an average body weight of 60 kg were fed the same diet and in the same house before the start of the experiment. The 240 pigs were then randomly separated into three treatments: control group, 10% mulberry silage (MS) group, and 10% paper mulberry silage (PMS) group. Pigs continued to be fed in the same house. The amount added was based on dry matter. Each treatment had 4 replicates, and each replicate included 20 finishing pigs. Finishing pigs were fed two times per day (8:00 a.m. and 5:00 p.m.) and had free access to diet and water during the experiment. The experiment lasted for 61 days, including a 7-day preexperiment period and a 54-day feeding experiment. After the feeding experiment, one finishing pig was randomly selected from each replicate for slaughter (i.e., 4 pigs per treatment [n = 4]). Samples from the pigs were analyzed for meat quality, intestinal SCFAs, and microbiota. Methods and procedures were approved by the Professional Committee of Animal Welfare Ethics of Henan Agricultural University. All animal treatments and experiments were performed according to the recommendations of the guidelines for ethical review of animal welfare in the national standards of the People’s Republic of China. Mulberry and paper mulberry silages were provided by Henan Shi ji tian yuan Ecological Science and Technology Co., Ltd., and Lan kao Zhong ke hua gou Biological Technology Co., Ltd., respectively. The experimental diet was designed according to the nutrition standard of the NRC of the United States, and the diet formula and nutritional composition are shown in Table 3.
TABLE 3.
Ingredient composition and nutritional level in different diets
| Parameter | Result fora: |
||
|---|---|---|---|
| CON | MS | PMS | |
| Ingredient (%) | |||
| Corn | 72.41 | 67.33 | 68.55 |
| Soybean meal | 18.12 | 18.80 | 17.55 |
| Soybean oil | 0 | 1.90 | 1.90 |
| Bran | 7.2 | 0.04 | 0 |
| Calcium hydrogen phosphate | 0.70 | 0.52 | 0.53 |
| Limestone powder | 0.36 | 0.25 | 0.18 |
| Fermented mulberry | 0 | 10.00 | 0 |
| Fermented paper mulberry | 0 | 0 | 10.00 |
| 1% premixb | 1.00 | 1.00 | 1.00 |
| Lysine (98% pure)c | 0.21 | 0.16 | 0.29 |
| Total | 100.00 | 100.00 | 100.00 |
| Nutrient composition | |||
| Digestive energy (MJ/kg) | 13.67 | 13.67 | 13.67 |
| Crude protein (%) | 15.19 | 15.24 | 15.25 |
| Ether extract (%) | 4.47 | 6.09 | 6.11 |
| Neutral detergent fiber (%) | 12.24 | 13.15 | 14.99 |
| Acid detergent fiber (%) | 5.13 | 7.23 | 8.22 |
| Ca (%) | 0.51 | 0.51 | 0.51 |
| Total phosphorus (%) | 0.49 | 0.44 | 0.43 |
| Available phosphorus (%) | 0.24 | 0.24 | 0.24 |
| Lys (%) | 0.95 | 0.94 | 0.95 |
CON, control group; MS, mulberry silage group; PMS, paper mulberry silage group.
The 1% premix provided the following dietary supplements per kilogram: vitamin A, 5,000 IU; vitamin D3, 3,000 IU; vitamin E, 40.1 IU; vitamin B2, 23.2 mg; vitamin B1, 20.01 mg; nicotinic acid, 16 mg; pantothenic acid, 10 mg; biotin, 0.168 mg; folacin, 1.28 mg; Cu, 11.2 mg; Fe, 110 mg; Zn, 65.6 mg; Mn, 37.6 mg; I, 0.47 mg; Se, 0.30 mg.
The purity of the lysine added in feed is 98%.
Growth performance of finishing pigs.
The following measures of growth performance were calculated: (i) average daily feed intake (ADFI) = average daily supplement (kg) − average daily surplus (kg), (ii) average daily gain (ADG) = (average final weight − average initial weight)/test days, and (iii) feed conversion rate (FCR) = ADFI/ADG.
Determination of the physical characteristics of pork.
Approximately 500 g of longissimus dorsi muscle was collected, and meat color, marbling, drip loss, and water holding capacity were measured. Meat color parameters included redness (a*), yellowness (b*), and lightness (L*) and were determined by a portable chromameter at 45 min after slaughter. The L* value is the lightness coefficient, and the closer the value is to 100, the brighter the sample. The a* value represents red-green, and the b* value represents yellow-blue. When the a* value is positive, the color is reddish, and when a* value is negative, the color is greenish. When the b* value is positive, the color is yellowish, and when b* value is negative, the color is bluish. Meat marbling was observed by cross section of the longissimus dorsi muscle at the junction of the last thoracic vertebra and the first lumbar vertebra. The scale of marbling score was 1 to 5 (1 = devoid to practically devoid, 2 = traces to slight, 3 = small to modest, 4 = moderate to slightly abundant, and 5 = moderately abundant or greater). Marbling was observed 45 min later after slaughter. All samples were analyzed by five people, and the evaluators did not know the source of the samples. Water holding capacity pressure was measured by a weight pressurization method. In brief, longissimus dorsi muscle from the last lumbar to the first thoracic vertebra was cut into 1-cm-thick slices, and the slices were weighed as m1 values. Then, pork samples were treated in the following order: filter paper (18 layers), gauze (5 layers), pork sample, gauze (5 layers), and filter paper (18 layers). An iron weight (30 kg) was placed on top, and after 5 min, samples were weighed as m2 values. The following formulas were used to calculate water holding capacity: (i) water loss rate = [(m1 − m2)/m1] × 100% and (ii) water holding capacity = 1 − (water loss rate/moisture content of the pork samples). Drip loss was measured by a hanging method that relied only on gravity within 2 h after slaughter. Longissimus dorsi muscle samples of 5 cm (length) by 3 cm (width) by 2 cm (thickness) were weighed as m1 values. One end of a pork sample was hooked with a thin wire so that the muscle fibers were oriented vertically downward and hung in a Ziploc bag for 24 h in a refrigerator at 4°C. Samples were then weighed as m2 values. The following formula was used to calculate drip loss: drip loss = [(m1 − m2)/m1] × 100%.
Determination of fatty acids in muscle.
Fatty acids were determined in 100-g samples of longissimus dorsi muscle by gas chromatography (GC). The GC conditions were set according to a previous study as follows: injection volume, 1 μL; split ratio, 1:15; initial temperature of 150°C ramped to 240°C at 4°C/min; and nitrogen flow rate, 40 mL/cm2.
Determination of short-chain fatty acids in the colon.
Collected colon chyme was diluted with distilled water (mass/volume ratio of 1:1). After shaking and mixing, samples were centrifuged at 12,000 × g for 10 min. To 1 mL of supernatant, 0.2 mL of 25% metaphosphoric acid was added. After 30 min, samples were centrifuged at 12,000 × g for 10 min. To 100 μL of supernatant, 100 μL of methanol was added, and following thorough mixing, samples were centrifuged at 12,000 × g for 10 min. Supernatants were collected, and GC was used to determine amounts of SCFAs in the colon. Samples were analyzed on an HP-88 column and separated using a Trace 1310 GC with a flame ionization detector. Samples were run with a split ratio of 20:1 and a column flow of 1.3 mL/min. Hydrogen was used as the carrier gas. The injector and detector temperatures were 270°C and 290°C, respectively, according to a previous study. The calibration curve constructed by GC-mass spectrometry (MS) data of corresponding SCFA standards was used to calculate the concentration of SCFA in colon samples.
DNA extraction and 16S rRNA gene sequencing.
After cecum and colon chyme were collected and sorted, samples were sent to Shanghai Meiji Biomedical Technology Co., Ltd., for sequencing of bacterial DNA. The bacterial DNA of cecum and colon was extracted by an E.Z.N.A. soil DNA kit (Omega Bio-Tek, Norcross, GA, USA) according to the manufacturer’s protocols. Concentration and purity of DNA were measured by a NanoDrop 2000 UV-visible (UV-vis) spectrophotometer (Thermo Scientific, Wilmington, DE, USA), and DNA quality was verified by 1% agarose gel electrophoresis. The upstream primer 338F (5′-ACTCCTACGGGAGGCAGCAG-3′) and the downstream primer 806R (5′-GGACTACHVGGGTWTCTAAT-3′) were used to amplify the V3-V4 hypervariable region of the 16S rRNA gene by PCR. The PCR program was the following: 3 min of denaturation at 95°C, followed by 27 cycles of 30 s at 95°C, 30 s of annealing at 55°C, and 45 s of elongation at 72°C, with a final extension at 72°C for 10 min. In the PCR system, each 20-μL reaction mixture contained 4 μL of 5× FastPfu buffer, 2 μL of 2.5 mM deoxynucleoside triphosphates, 0.8 μL of each primer (5 μM), 0.4 μL of FastPfu polymerase, and 10 ng of template DNA. The PCR products were extracted from a 2% agarose gel and further purified using an AxyPrep DNA gel extraction kit (Axygen Biosciences, Union City, CA, USA). Three independent PCRs from each sample were conducted, and the PCR products were mixed and sequenced as a single sample (59). A TruSeqIM DNA sample prep kit was used to build the library, and the MiSeq PE300 platform of the Illumina Company was used for sequencing.
Bioinformatics analysis of sequencing data.
Cecum and colon samples were collected and sequenced by Shanghai Magi Biomedical Technology Co., Ltd. Raw fastq files were demultiplexed, quality filtered using Trimmomatic, and merged using FLASH. In that process, (i) reads were truncated at any site receiving an average quality score of <20 over a 50-bp sliding window, (ii) primers were exactly matched, allowing 2-nucleotide mismatching, and reads containing ambiguous bases were removed, and (iii) sequences with overlap longer than 10 bp were merged according to the overlap sequence. Operational taxonomic units (OTUs) with 97% similarity cutoff were clustered using UPARSE (v7.1 [http://drive5.com/uparse/]), and chimeric sequences were identified and removed. The taxonomy of each OTU representative sequence was analyzed by RDP Classifier (http://rdp.cme.msu.edu/) against a 16S rRNA database (i.e., Silva SSU128) using a confidence threshold of 0.7.
Microbial diversity analysis.
Sample biodiversity was calculated using Chao 1 and Shannon indices and then applying a Wilcoxon rank sum test. Changes in relative abundances of bacteria are shown using column charts. The weighted Unifrac was used in a principal-coordinate analysis (PCoA). Hierarchical cluster analysis of Bray-Curtis samples based on OTU level was used to summarize the composition of cecum and colon bacterial communities. The Shannon and Chao indices measure diversity and richness of bacteria, respectively.
Screening of microbial markers.
The propensity score matching method in the R language was adopted. After matching of propensity scores, DESeq2 was used to screen preliminary differences in abundance of OTUs between groups at the genus level. The ggploT2 package was used to draw a volcano map to show the abundance and significance of differences in OTUs. On the basis of screening abundance differences in OTUs between groups, the linear discriminant analysis (LDA) effect size (LEfSe) method was used to further identify the bacterial markers associated with mulberry and paper mulberry silages. Kruskal-Wallis rank sum tests and Wilcoxon rank sum tests were used to establish a linear discriminant analysis model to screen the biomarkers of each group.
PICRUSt prediction of microbial functions.
PICRUSt predictions were used to analyze functions of bacteria according to a previous study. To obtain the metabolic pathways with significant differences, STAMP software was used to analyze the significance of PICRUSt predictions at P < 0.05 and to visualize the results, according to a previous study.
Correlation analysis between microbes and short-chain fatty acids and long-chain fatty acids.
To determine the effects of microbes interacting with SCFAs and long-chain fatty acids, redundancy analysis (RDA) was performed at the genus level using the R language vegan packet of Spearman correlation analysis (RDA 2014). Benjamini-Hochberg’s false-discovery rate (FDR) correction was used to correct for multiple testing.
Statistical analyses.
Growth performance, meat quality, and intestinal SCFA concentrations of finishing pigs were analyzed by SPSS 22.0 software. Data were evaluated by one-way analysis of variance (ANOVA), and differences between mean values were evaluated by Duncan’s test. Significance was set at a P value of <0.05. Values are presented as the mean ± standard deviation.
Data availability.
Raw reads were deposited into the NCBI Sequence Read Archive database under accession no. SRP375531 (https://www.ncbi.nlm.nih.gov/Traces/study/).
ACKNOWLEDGMENTS
Financial support for this research was provided by the Outstanding Talents of Henan Agricultural University (no. 30500636), the earmarked fund for China Forage and Grass Research System (CARS-34), the Henan Provincial Science and Technology Research Project (no. 222102110007), the Science and Technology Innovation Team of Henan Province High Quality Forage and Animal Health (no. 22IRTSTHN022), and the China Postdoctoral Science Foundation (no. 2022M710046).
We give special thanks for the technical support provided by the Henan Key Laboratory of Grassland Resources Innovation and Utilization.
Y.C., J.N., and X.L. designed and performed experiments and analyzed data. F.L. and J.X. participated in the data collection. J.W., X.Z., X.Y., and L.W. helped to perform experiments. S.M. and D.L. provided advice on design and performance of experiments. X.Z., C.W., and Y.S. provided help with data collection. J.N. and Y.C. wrote the manuscript draft. All authors read and approved the final manuscript.
We declare we have no conflict of interest.
Footnotes
Supplemental material is available online only.
Contributor Information
Yalei Cui, Email: yaleicui423@henau.edu.cn.
Ilenys M. Perez-Diaz, USDA—ARS
REFERENCES
- 1.Scollan ND, Price EM, Morgan SA, Huws SA, Shingfield KJ. 2017. Can we improve the nutritional quality of meat? Proc Nutr Soc 76:603–618. doi: 10.1017/S0029665117001112. [DOI] [PubMed] [Google Scholar]
- 2.Yanfang Y, Hongyan L, Bing Z, Junwen W, Xuping S, Jinzhi H, Jianyuan Y, Yanfei Z, Zeyuan D. 2018. Nutritional and functional components of mulberry leaves from different varieties: evaluation of their potential as food materials. Int J Food Prop 21:1495–1507. doi: 10.1080/10942912.2018.1489833. [DOI] [Google Scholar]
- 3.Srivastava S, Kapoor R, Thathola A, Srivastava RP. 2006. Nutritional quality of leaves of some genotypes of mulberry (Morus alba). Int J Food Sci Nutr 57:305–313. doi: 10.1080/09637480600801837. [DOI] [PubMed] [Google Scholar]
- 4.Al-Kirshi R, Alimon AR, Zulkifli I, Sazili A, Zahari MW, Ivan M. 2010. Utilization of mulberry leaf meal (Morus alba) as protein supplement in diets for laying hens. Ital J Anim Sci 9:50–66. [Google Scholar]
- 5.Lin WC, Lee MT, Chang SC, Chang YL, Shih CH, Yu B, Lee TT. 2017. Effects of mulberry leaves on production performance and the potential modulation of antioxidative status in laying hens. Poult Sci 96:1191–1203. doi: 10.3382/ps/pew350. [DOI] [PubMed] [Google Scholar]
- 6.Wang F, Li J, Jiang Y. 2010. Polysaccharides from mulberry leaf in relation to their antioxidant activity and antibacterial ability. J Food Process Eng 33:39–50. doi: 10.1111/j.1745-4530.2008.00258.x. [DOI] [Google Scholar]
- 7.Butt MS, Nazir A, Sultan MT, Schroën K. 2008. Morus alba L. nature's functional tonic. Trends Food Sci Tech 19:505–512. doi: 10.1016/j.tifs.2008.06.002. [DOI] [Google Scholar]
- 8.Doran MP, Laca EA, Sainz RD. 2007. Total tract and rumen digestibility of mulberry foliage (Morus alba), alfalfa hay and oat hay in sheep. Anim Feed Sci Technol 138:239–253. doi: 10.1016/j.anifeedsci.2006.11.016. [DOI] [Google Scholar]
- 9.Wang X, Tang C, Lin Y, Ni K, Yang F, Guo L, Liu X, Yang X. 2019. Assessing nutritive value and in vitro ruminal dry matter digestibility of paper mulberry (Broussonetia papyrifera L.) at the different cutting heights. IOP Conf Ser Earth Environ Sci 387:012015. doi: 10.1088/1755-1315/387/1/012015. [DOI] [Google Scholar]
- 10.Wu XZ, Yang PL, Gao XH, Wen ZG, Dai SF, Zhu MX, Wang LX. 2019. Effects of replacement of alfalfa by big-leaf mulberry on growth performance, digestion and meat quality in growing rabbits. World Rabbit Sci 27:199–205. doi: 10.4995/wrs.2019.11529. [DOI] [Google Scholar]
- 11.Jung Park E, Pezzuto JM. 2002. Botanicals in cancer chemoprevention. Cancer Metast Rev 21:231–255. doi: 10.1023/A:1021254725842. [DOI] [PubMed] [Google Scholar]
- 12.Chen G, Shui S, Chai M, Wang D, Su Y, Wu H, Sui X, Yin Y. 2020. Effects of paper mulberry (Broussonetia papyrifera) leaf extract on growth performance and fecal microflora of weaned piglets. Biomed Res Int 2020:6508494. doi: 10.1155/2020/6508494. [DOI] [PMC free article] [PubMed] [Google Scholar]
- 13.Mahanna B, Chase LE. 2003. Practical applications and solutions to silage problems. Silage Sci Technol 42:855–895. [Google Scholar]
- 14.Mohapatra D, Patel AS, Kar A, Deshpande SS, Tripathi MK. 2019. Effect of different processing conditions on proximate composition, anti-oxidants, anti-nutrients and amino acid profile of grain sorghum. Food Chem 271:129–135. doi: 10.1016/j.foodchem.2018.07.196. [DOI] [PubMed] [Google Scholar]
- 15.Chung H, Pamp SJ, Hill JA, Surana NK, Edelman SM, Troy EB, Reading NC, Villablanca EJ, Wang S, Mora JR, Umesaki Y, Mathis D, Benoist C, Relman DA, Kasper DL. 2012. Gut immune maturation depends on colonization with a host-specific microbiota. Cell 149:1578–1593. doi: 10.1016/j.cell.2012.04.037. [DOI] [PMC free article] [PubMed] [Google Scholar]
- 16.Carmody R, Gerber G, Luevano J, Gatti D, Somes L, Svenson K, Turnbaugh P. 2015. Diet dominates host genotype in shaping the murine gut microbiota. Cell Host Microbe 17:72–84. doi: 10.1016/j.chom.2014.11.010. [DOI] [PMC free article] [PubMed] [Google Scholar]
- 17.Fang J, Cao Y, Matsuzaki M, Suzuki H, Kimura H. 2016. Effects of apple pomace-mixed silage on growth performance and meat quality in finishing pigs. Anim Sci J 87:1516–1521. doi: 10.1111/asj.12601. [DOI] [PubMed] [Google Scholar]
- 18.Jazi V, Boldaji F, Dastar B, Hashemi SR, Ashayerizadeh A. 2017. Effects of fermented cottonseed meal on the growth performance, gastrointestinal microflora population and small intestinal morphology in broiler chickens. Br Poult Sci 58:402–408. doi: 10.1080/00071668.2017.1315051. [DOI] [PubMed] [Google Scholar]
- 19.Wallenbeck A, Rundgren M, Presto M. 2014. Inclusion of grass/clover silage in diets to growing/finishing pigs—influence on performance and carcass quality. Acta Agric Scand A Anim Sci 64:145–153. doi: 10.1080/09064702.2015.1006668. [DOI] [Google Scholar]
- 20.Shin S, Han Y, Cho J, Kim H, Chen Y, Yoo J, Whang K, Kim J, Kim I. 2007. Effects of rye silage on growth performance, blood characteristics, and carcass quality in finishing pigs. Food Sci Anim Resour 27:392–400. doi: 10.5851/kosfa.2007.27.4.392. [DOI] [Google Scholar]
- 21.Wu Y, Zhao J, Xu C, Ma N, He T, Zhao J, Ma X, Thacker PA. 2020. Progress towards pig nutrition in the last 27 years. J Sci Food Agric 100:5102–5110. doi: 10.1002/jsfa.9095. [DOI] [PubMed] [Google Scholar]
- 22.Chen L, Zhang Y, Huang T, Cai Y. 2016. Gene expression profiling gut microbiota in different races of humans. Sci Rep 6:23075. doi: 10.1038/srep23075. [DOI] [PMC free article] [PubMed] [Google Scholar]
- 23.Kim TW, Kang SN, Jeong JY, Kim CW, Jin SK. 2011. Effects of feeding silage on pork quality by pig breeds. J Agric Life Sci 45:79–88. [Google Scholar]
- 24.Cumby N, Zhong Y, Naczk M, Shahidi F. 2008. Antioxidant activity and water-holding capacity of canola protein hydrolysates. Food Chem 109:144–148. doi: 10.1016/j.foodchem.2007.12.039. [DOI] [PubMed] [Google Scholar]
- 25.Zhang H, Zheng M, Luo X, Li X. 2018. Effects of mulberry fruit (Morus alba L.) consumption on health outcomes: a mini-review. Antioxidants 7:69. doi: 10.3390/antiox7050069. [DOI] [PMC free article] [PubMed] [Google Scholar]
- 26.Rajkumar V, Dushyanthan K, Das AK. 2010. Retort pouch processing of Chettinad style goat meat curry—a heritage meat product. J Food Sci Technol 47:372–379. doi: 10.1007/s13197-010-0062-9. [DOI] [PMC free article] [PubMed] [Google Scholar]
- 27.Ramsey CB, Tribble LF, Wu C, Lind KD. 1990. Effects of grains, marbling and sex on pork tenderness and composition. J Anim Sci 68:148–154. [Google Scholar]
- 28.Johansson L, Lundström K, Jonsäll A. 2002. Effects of RN genotype and silage feed on fat content and fatty acid composition of fresh and cooked pork loin. Meat Sci 60:17–24. doi: 10.1016/s0309-1740(01)00100-0. [DOI] [PubMed] [Google Scholar]
- 29.de Almeida CdG, Viana EC, Moreira AVB, Miguel GPS, Pedra FSG, Oliveira FE, Quimquim TN, Bissoli NS, Alves RDM, Bressan J. 2020. The fatty acid profile of adipose tissue as a predictor of the ponderal and inflammatory response in adult women six years after bariatric surgery. Lipids Health Dis 19:45. doi: 10.1186/s12944-020-01229-3. [DOI] [PMC free article] [PubMed] [Google Scholar]
- 30.Harris WS, Miller M, Tighe AP, Davidson MH, Schaefer EJ. 2008. Omega-3 fatty acids and coronary heart disease risk: clinical and mechanistic perspectives. Atherosclerosis 197:12–24. doi: 10.1016/j.atherosclerosis.2007.11.008. [DOI] [PubMed] [Google Scholar]
- 31.Zárate R, El Jaber-Vazdekis N, Tejera N, Pérez JA, Rodríguez C. 2017. Significance of long chain polyunsaturated fatty acids in human health. Clin Transl Med 6:25. doi: 10.1186/s40169-017-0153-6. [DOI] [PMC free article] [PubMed] [Google Scholar]
- 32.Hardman WE. 2004. (n-3) fatty acids and cancer therapy. J Nutr 134:3427S–3430S. doi: 10.1093/jn/134.12.3427S. [DOI] [PubMed] [Google Scholar]
- 33.Kimura I, Inoue D, Hirano K, Tsujimoto G. 2014. The SCFA receptor GPR43 and energy metabolism. Front Endocrinol (Lausanne) 5:85. doi: 10.3389/fendo.2014.00085. [DOI] [PMC free article] [PubMed] [Google Scholar]
- 34.Cummings JH, Pomare EW, Branch WJ, Naylor CP, Macfarlane GT. 1987. Short chain fatty acids in human large intestine, portal, hepatic and venous blood. Gut 28:1221–1227. doi: 10.1136/gut.28.10.1221. [DOI] [PMC free article] [PubMed] [Google Scholar]
- 35.Den Besten G, Van Eunen K, Groen AK, Venema K, Reijngoud D, Bakker BM. 2013. The role of short-chain fatty acids in the interplay between diet, gut microbiota, and host energy metabolism. J Lipid Res 54:2325–2340. doi: 10.1194/jlr.R036012. [DOI] [PMC free article] [PubMed] [Google Scholar]
- 36.Faith JJ, Guruge JL, Charbonneau M, Subramanian S, Seedorf H, Goodman AL, Clemente JC, Knight R, Heath AC, Leibel RL, Rosenbaum M, Gordon JI. 2013. The long-term stability of the human gut microbiota. Science 341:1237439. doi: 10.1126/science.1237439. [DOI] [PMC free article] [PubMed] [Google Scholar]
- 37.Morotomi M, Nagai F, Watanabe Y. 2012. Description of Christensenella minuta gen. nov., sp. nov., isolated from human faeces, which forms a distinct branch in the order Clostridiales, and proposal of Christensenellaceae fam. nov. Int J Syst Evol Microbiol 62:144–149. doi: 10.1099/ijs.0.026989-0. [DOI] [PubMed] [Google Scholar]
- 38.Waters JL, Ley RE. 2019. The human gut bacteria Christensenellaceae are widespread, heritable, and associated with health. BMC Biol 17:83. doi: 10.1186/s12915-019-0699-4. [DOI] [PMC free article] [PubMed] [Google Scholar]
- 39.Bauchart-Thevret C, Stoll B, Chacko S, Burrin DG. 2009. Sulfur amino acid deficiency upregulates intestinal methionine cycle activity and suppresses epithelial growth in neonatal pigs. Am J Physiol Endocrinol Metab 296:E1239–E1250. doi: 10.1152/ajpendo.91021.2008. [DOI] [PMC free article] [PubMed] [Google Scholar]
- 40.Distrutti E, Monaldi L, Ricci P, Fiorucci S. 2016. Gut microbiota role in irritable bowel syndrome: new therapeutic strategies. World J Gastroenterol 22:2219–2241. doi: 10.3748/wjg.v22.i7.2219. [DOI] [PMC free article] [PubMed] [Google Scholar]
- 41.Flint HJ, Duncan SH, Scott KP, Louis P. 2015. Links between diet, gut microbiota composition and gut metabolism. Proc Nutr Soc 74:13–22. doi: 10.1017/S0029665114001463. [DOI] [PubMed] [Google Scholar]
- 42.Sorbara MT, Littmann ER, Fontana E, Moody TU, Kohout CE, Gjonbalaj M, Eaton V, Seok R, Leiner IM, Pamer EG. 2020. Functional and genomic variation between human-derived isolates of Lachnospiraceae reveals inter- and intra-species diversity. Cell Host Microbe 28:134–146.e4. doi: 10.1016/j.chom.2020.05.005. [DOI] [PMC free article] [PubMed] [Google Scholar]
- 43.Reichardt N, Duncan SH, Young P, Belenguer A, McWilliam Leitch C, Scott KP, Flint HJ, Louis P. 2014. Phylogenetic distribution of three pathways for propionate production within the human gut microbiota. ISME J 8:1323–1335. doi: 10.1038/ismej.2014.14. [DOI] [PMC free article] [PubMed] [Google Scholar]
- 44.Watanabe Y, Nagai F, Morotomi M. 2012. Characterization of Phascolarctobacterium succinatutens sp. nov., an asaccharolytic, succinate-utilizing bacterium isolated from human feces. Appl Environ Microbiol 78:511–518. doi: 10.1128/AEM.06035-11. [DOI] [PMC free article] [PubMed] [Google Scholar]
- 45.Song H, Lee SY. 2006. Production of succinic acid by bacterial fermentation. Enzyme and microbial technology. Enzyme Microb Tech 39:352–361. doi: 10.1016/j.enzmictec.2005.11.043. [DOI] [Google Scholar]
- 46.Holman DB, Gzyl KE. 2019. A meta-analysis of the bovine gastrointestinal tract microbiota. FEMS Microbiol Ecol 95:fiz072. doi: 10.1093/femsec/fiz072. [DOI] [PubMed] [Google Scholar]
- 47.Bintsis T. 2018. Lactic acid bacteria as starter cultures: an update in their metabolism and genetics. AIMS Microbiol 4:665–684. doi: 10.3934/microbiol.2018.4.665. [DOI] [PMC free article] [PubMed] [Google Scholar]
- 48.Kondo M, Shimizu K, Jayanegara A, Mishima T, Matsui H, Karita S, Goto M, Fujihara T. 2016. Changes in nutrient composition and in vitro ruminal fermentation of total mixed ration silage stored at different temperatures and periods. J Sci Food Agric 96:1175–1180. doi: 10.1002/jsfa.7200. [DOI] [PubMed] [Google Scholar]
- 49.Vijay A, Astbury S, Le Roy C, Spector TD, Valdes AM. 2021. The prebiotic effects of omega-3 fatty acid supplementation: a six-week randomised intervention trial. Gut Microbes 13:1863133. doi: 10.1080/19490976.2020.1863133. [DOI] [PMC free article] [PubMed] [Google Scholar]
- 50.Stadtman ER, Stadtman TC, Barker HA. 1949. Tracer experiments on the mechanism of synthesis of valeric and caproic acid by Clostridium Kluyveri. J Biol Chem 178:677–682. doi: 10.1016/S0021-9258(18)56884-8. [DOI] [PubMed] [Google Scholar]
- 51.Jonathan MC, van den Borne JJ, van Wiechen P, Da Silva CS, Schols HA, Gruppen H. 2012. In vitro fermentation of 12 dietary fibres by faecal inoculum from pigs and humans. Food Chem 133:889–897. doi: 10.1016/j.foodchem.2012.01.110. [DOI] [Google Scholar]
- 52.Du Z, Risu N, Gentu G, Jia Y, Cai Y. 2020. Dynamic changes and characterization of the protein and carbohydrate fractions of native grass grown in Inner Mongolia during ensiling and the aerobic stage. Asian-Australas J Anim Sci 33:556–567. doi: 10.5713/ajas.19.0212. [DOI] [PMC free article] [PubMed] [Google Scholar]
- 53.Ricardo U, Dangour AD. 2008. Nutrition in brain development and aging: role of essential fatty acids. Nutr Rev 64:S24–S33. doi: 10.1111/j.1753-4887.2006.tb00242.x. [DOI] [PubMed] [Google Scholar]
- 54.Semova I, Carten JD, Stombaugh J, Mackey LC, Knight R, Farber SA, Rawls JF. 2012. Microbiota regulate intestinal absorption and metabolism of fatty acids in the zebrafish. Cell Host Microbe 12:277–288. doi: 10.1016/j.chom.2012.08.003. [DOI] [PMC free article] [PubMed] [Google Scholar]
- 55.Jenkins DJ, Wolever TM, Jenkins A, Brighenti F, Vuksan V, Rao AV, Cunnane SC, Ocana A, Corey P, Vezina C. 1991. Specific types of colonic fermentation may raise low-density-lipoprotein-cholesterol concentrations. Am J Clin Nutr 54:141–147. doi: 10.1093/ajcn/54.1.141. [DOI] [PubMed] [Google Scholar]
- 56.Lopez HW, Levrat-Verny MA, Coudray C, Besson C, Krespine V, Messager A, Demigné C, Rémésy C. 2001. Class 2 resistant starches lower plasma and liver lipids and improve mineral retention in rats. J Nutr 131:1283–1289. doi: 10.1093/jn/131.4.1283. [DOI] [PubMed] [Google Scholar]
- 57.Heimann E, Nyman M, Degerman E. 2015. Propionic acid and butyric acid inhibit lipolysis and de novo lipogenesis and increase insulin-stimulated glucose uptake in primary rat adipocytes. Adipocyte 4:81–88. doi: 10.4161/21623945.2014.960694. [DOI] [PMC free article] [PubMed] [Google Scholar]
- 58.Wood JD, Richardson RI, Nute GR, Fisher AV, Campo MM, Kasapidou E, Sheard PR, Enser M. 2004. Effects of fatty acids on meat quality: a review. Meat Sci 66:21–32. doi: 10.1016/S0309-1740(03)00022-6. [DOI] [PubMed] [Google Scholar]
- 59.Cui Y, Liu H, Gao Z, Xu J, Liu B, Guo M, Yang X, Niu J, Zhu X, Ma S, Li D, Sun Y, Shi Y. 2022. Whole-plant corn silage improves rumen fermentation and growth performance of beef cattle by altering rumen microbiota. Appl Microbiol Biotechnol 106:4187–4198. doi: 10.1007/s00253-022-11956-5. [DOI] [PubMed] [Google Scholar]
Associated Data
This section collects any data citations, data availability statements, or supplementary materials included in this article.
Supplementary Materials
Supplemental material. Download spectrum.02416-22-s0001.pdf, PDF file, 0.3 MB (276.2KB, pdf)
Data Availability Statement
Raw reads were deposited into the NCBI Sequence Read Archive database under accession no. SRP375531 (https://www.ncbi.nlm.nih.gov/Traces/study/).