Abstract
Alterations in the genome, including mutations and copy number variation (CNV), can drive cancer progression. The Cancer Genome Atlas (TCGA) project studying papillary thyroid cancer (PTC) identified a number of recurrent arm-level copy number amplifications, some spanning genes that are also commonly mutated in thyroid cancer. Herein, we focus on the role of TERT and BRAF CNV in PTC, including its relation to mutation status, gene expression, and clinicopathological characteristics. Utilizing TCGA CNV data, we identified focal amplifications and deletions involving the TERT and BRAF loci. TERT amplifications are more frequent in later stage thyroid tumors; in contrast, BRAF amplifications are not associated with stage. Furthermore, TERT amplifications are more frequently found in tumors also harboring TERT mutations, the combination further increasing TERT expression. Conversely, BRAF amplifications are more frequently found in BRAF wildtype tumors, and are more common in the follicular subtype of PTC as well as classic PTCs associated with a high follicular component and a RAS-like expression profile (assessed by the BRAF/RAS score). This is the first study to examine the TCGA thyroid dataset for gene-level CNV of TERT and BRAF, and their relationship with mutation status, tumor type and tumor stage. Assessing the differences in patterns of TERT and BRAF amplifications in the context of the mutation status of these genes may provide insight into the differing roles CNV can play depending on tumor type, and may lead to a better understanding of cancer drivers in thyroid cancer.
Keywords: BRAF, copy number variation, papillary thyroid carcinoma, TCGA, telomerase
1 |. INTRODUCTION
During cancer progression, a variety of genetic changes, including mutations, amplifications, and deletions, can occur within the cancer genome. While much attention has focused on the identification of mutations, alterations of DNA copy number, or copy number variations (CNV), remain understudied.1 Similar to activating mutations in oncogenes, amplification of an oncogene may also represent an oncogenic stimulus, while deletions can substitute for inactivating mutations of tumor suppressors.2 Beyond these obvious examples, CNVs have the potential to broadly affect gene expression patterns and regulatory pathways.2
The Cancer Genome Atlas (TCGA) project examined nearly 500 papillary thyroid cancers (PTC) and documented somatic CNV in 27.2% of tumors.3 Furthermore, 18 significant arm-level alterations were identified, including amplifications of chromosome arms 5p and 7q, which also contain the critical genes, telomerase reverse transcriptase (TERT) and B-Raf proto-oncogene (BRAF), respectively.4 We therefore chose to investigate the CNV of these two genes at the highest resolution available using TCGA data. To elucidate the relationship between CNV and mutation status in PTC, we examined correlations between TERT and BRAF CNVs with their mutation status and gene expression levels, as well as associated clinicopathological features.
We know that activating TERT promoter mutations are found in approximately 10% of PTCs and 15% of follicular thyroid cancers (FTC).3,5 The TERT promoter mutations upregulate expression of TERT, which, in turn, is associated with increased telomerase activity.5 A previous study of TERT CNV in PTC found CNV to be a rare event, with only 1% of PTCs showing amplification of TERT.6 However, in a study of FTC, 14% exhibited TERT CNV, with 8% showing amplification of TERT and 6% demonstrating deletions.7 While the prevalence of both TERT CNV and TERT mutations have been studied separately, the relationship between TERT CNV and TERT mutation status has not been explored.
In contrast, BRAF mutations are highly prevalent in PTC and rare in other thyroid cancers, with a prevalence of approximately 80% in tall cell variant PTC, 60% in classical PTC, 15% in follicular variant PTC (FVPTC), and 1% in follicular thyroid cancer (FTC).3,8,9 BRAF mutations lead to constitutive activation of the mitogen-activated protein kinase (MAPK) signaling pathway, which in turn promotes cell growth and proliferation.3,8 An earlier fluorescence in-situ hybridization study of thyroid tumors found BRAF CNV to be rare in PTC (3%), while more common in conventional and oncocytic follicular neoplasms (16%−45%), usually in the context of chromosome 7 polysomies.10 Similar to TERT CNV, BRAF mutation status and CNV status have not been studied concurrently in thyroid cancer. Unfortunately, the number of HRAS, NRAS, and KRAS alterations in this dataset (~1% amplifications, ~5% mutations) precluded a meaningful comparable analysis of the RAS oncogenes.
By utilizing the TCGA PTC dataset, we examine for the first time the relationship between TERT and BRAF mutation status, CNV of these genes, and clinicopathological characteristics. Our work begins to unravel the relationship of TERT and BRAF amplifications in thyroid cancer in the context of mutation status, tumor type, and tumor stage, in an effort to better understand key drivers in thyroid cancer.
2 |. MATERIALS AND METHODS
2.1 |. Data source
Data were obtained from The Cancer Genome Atlas (TCGA) public data repository, supported by the National Cancer Institute (NCI) and National Human Genome Research Institute (NHGRI)3 (https://www.cancer.gov/tcga). Copy number variation (CNV) data and mRNA expression data for thyroid tumors were obtained from the Firebrowse portal.4 Clinicopathological data, including histological type, tumor stage, % follicular fraction, mutation status, and BRAF/ RAS score (BRS) were also obtained from the TCGA public data repository.
CNV was determined by the TCGA Copy Number Variation Analysis Pipeline: (https://docs.gdc.cancer.gov/Data/Bioinformatics_Pipelines/CNV_Pipeline/). Briefly, the pipeline utilizes the Copy Number Liftover Workflow to obtain copy number segment files from Affymetrix SNP array data. The copy number segment files are used as input for Genomic Identification of Significant Targets in Cancer, v2 (GISTIC2) analysis. From the GISTIC2 analysis, the all_thresholded. by_genes.txt file for gene-level CNV was used for gene-level CNV analysis. mRNA expression data were obtained from the dataset of normalized RNA-sequencing read counts: (http://gdac.broadinstitute.org/) THCA.Merge_rnaseqv2__illuminahiseq_rnaseqv2__unc_edu__Le vel_3__RSEM_genes_normalized__data.Level_3.2016012800.0.0.
2.2 |. Identification of genes and CNV
CNV of TERT and BRAF was defined by a confidence level of 0.99 and a log2 ratio threshold of 0.1. If the log2 ratio was above 0.1, an amplification was called by GISTIC2, and below −0.1, a deletion was called. A value of 0 equates to no change in copy number, a positive 1 or 2 means amplification, and a negative 1 or 2 means a deletion. One or two signifies the level of the amplification of the CNV, with 2 signifying a higher level of amplification. For this study, we combined the values 1 or 2 to categorize the CNV as amplification, −1 or −2 as deletion, and 0 as no change. CNV data existed for 499 PTC tumors, with 6 tumors excluded from analysis as the tumors were metastatic samples (code 06), for a total of 493 informative, primary tumors to extract BRAF and TERT CNV data.
2.3 |. Integration of CNV data and clinical data for analysis
The data on TERT and BRAF CNV, mutation, and expression status for all thyroid tumors were integrated into a table containing the matching clinicopathological data. The categorical classes analyzed included histological subtype, AJCC stage, mutation status, and BRS score. Bar graphs showing CNV frequency in each class were generated. Gene expression was analyzed by box plot using the R package “ggboxplot”8 on R version 3.6.0.9
2.4 |. Statistical analysis
Fisher’s exact test was utilized to compare gene CNV and expression between categorical data sets (tumor histological types, tumor stage, mutation status, and BRS classification). The Mann-Whitney U test was performed to compare two groups for mRNA expression, calculated by the ggboxplot R package with the stat_compare_means function. A P-value of less than or equal to (≤) 0.05 was considered significant.
3 |. RESULTS
3.1 |. Identification of copy number variation in the TCGA data
Copy number variation data for 493 primary thyroid tumors was obtained from the TCGA database. Twenty-three tumors (4.7%) had TERT amplifications and two (0.4%) exhibited TERT deletions. Twenty-two tumors (4.5%) showed BRAF amplifications and four (0.8%) had BRAF deletions [Table 1]. While no tumors exhibited deletions in both genes, fifteen tumors (3%) had amplifications of both TERT and BRAF.
TABLE 1.
Copy number variation in the cancer genome atlas thyroid tumors
| Deletion | Amplification | |
|---|---|---|
| TERT | n = 2 (0.4%) | 23 (4.7%) |
| BRAF | n = 4 (0.8%) | 22 (4.5%) |
Note: The number of tumors classified by GISTIC2 analysis as a deletion or amplification, with overall frequency of the copy number variation in parentheses.
3.2 |. TERT and BRAF CNV and histological subtype
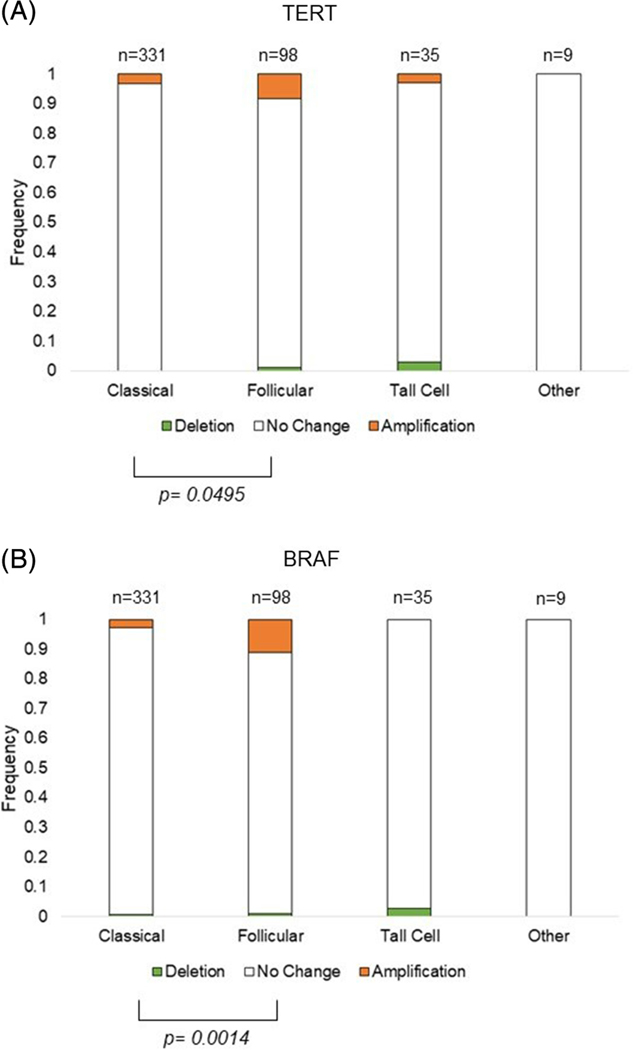
Utilizing the TCGA clinicopathological data, we compared TERT and BRAF CNV frequencies by histological subtype in 473 PTCs, excluding 20 tumors without available subtype. Interestingly, the FVPTC subtype exhibited significantly higher frequencies of both TERT (8.2%) and BRAF (11.2%) amplifications than both classical (TERT 3.3%, BRAF 2.7%) and tall cell PTC subtypes (TERT 2.9%, BRAF 0%) [Figure 1 and Supplemental Table 1].
FIGURE 1.
Frequency of TERT and BRAF CNV by histological PTC subtype. CNV is represented by a deletion in green, no change in white, or amplification in orange, of A, TERT or B BRAF. The bars show the frequency of the CNV in each histological subtype, with the number of tumors shown above the bars and the frequency to the right of the bars. Significance of P ≤ .05 of the frequency between two histological subtypes is denoted by brackets. The histological subtype “other” includes: one columnar cell variant PTC, one encapsulated FVPTC, four diffuse sclerosing variant PTC, one mixed papillary and follicular variant PTC, and two cribriform morular PTC. PTC, papillary thyroid cancer
3.3 |. BRAF and TERT CNV and tumor stage
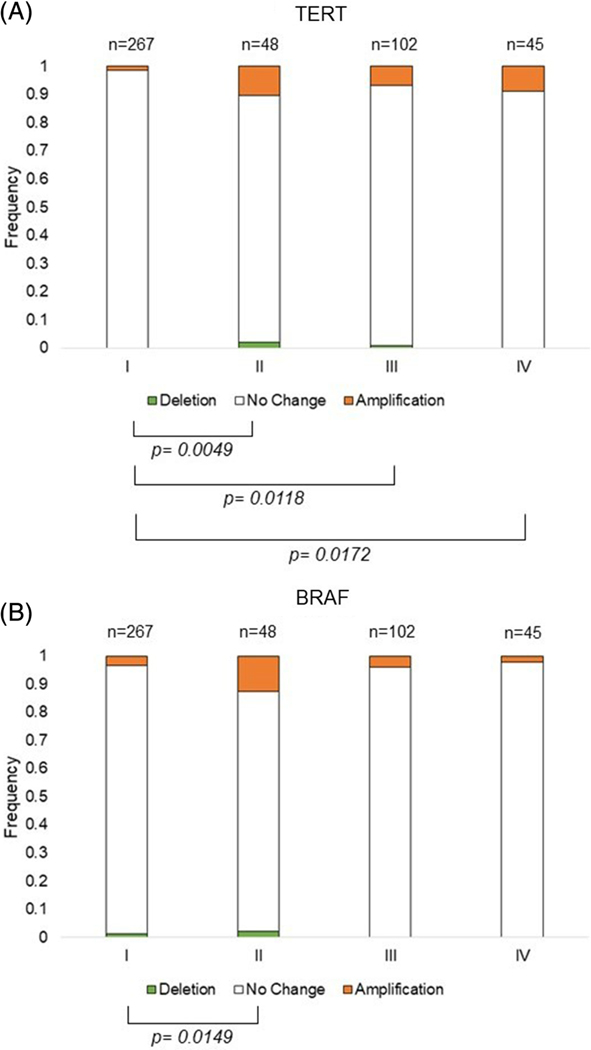
We next analyzed the CNV frequency and AJCC tumor stage. Tumors without a defined stage, n = 31, were excluded from analysis for a total of 462 informative tumors. Tumors of a later stage had significantly more TERT amplifications than early-stage tumors (Stage I = 1.5%; II = 10.4%; III = 6.9%; IV = 8.9%) [Figure 2A]. Comparison of BRAF CNV and tumor stage showed no clear trend, with an increase in BRAF CNV observed only for stage II but not later stages [Figure 2B and Supplemental Table 2].
FIGURE 2.
Frequency of TERT and BRAF CNV by tumor stage. CNV is represented by a deletion in green, no change in white, or amplification in orange, of A, TERT or B, BRAF. The bars show the frequency of the CNV in each tumor stage (I-IV), with the number of tumors shown above the bars and the frequency to the right of the bars italicized. Significance of P ≤ .05 of the frequency between two stages is denoted by brackets. CNV, copy number variation
3.4 |. TERT amplification and TERT promoter mutation status
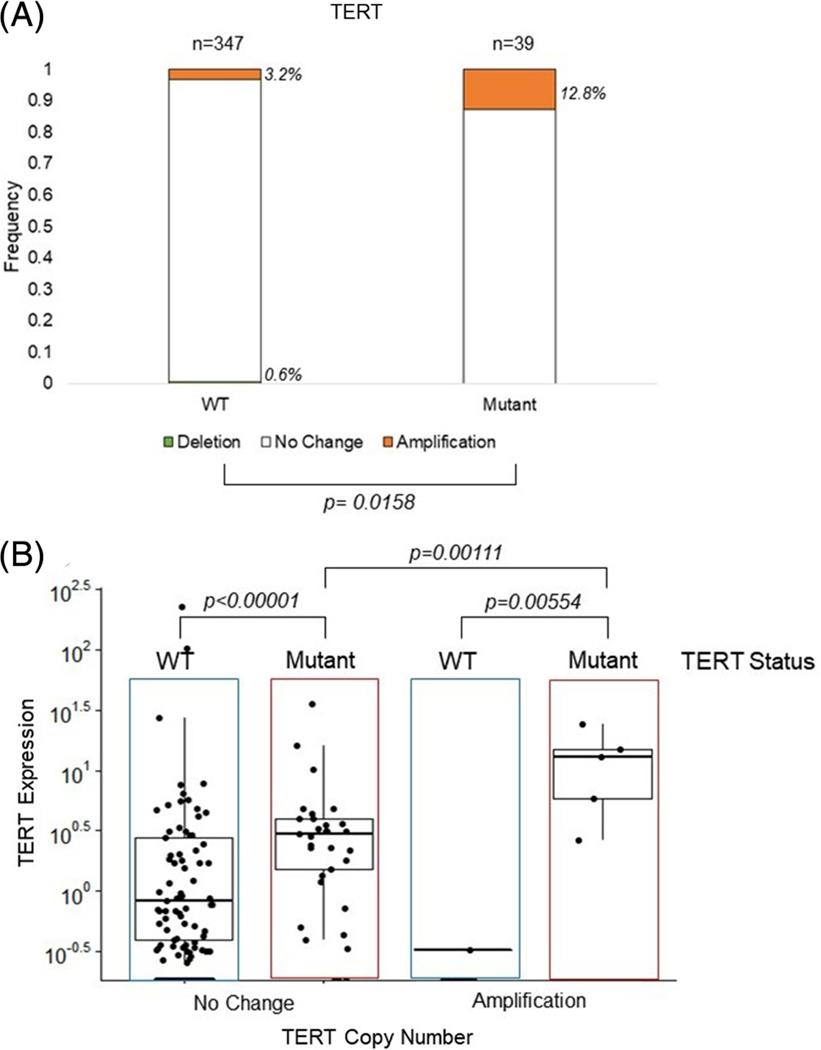
Given the association of the TERT amplification with later stage disease, we wanted to further explore the link between TERT amplification and TERT promoter mutation, since the latter is also associated with advanced disease. We first excluded those tumors where TERT mutation status was unknown (n = 107), leaving 386 informative tumors. Of note, TERT amplifications were significantly more frequent in tumors that harbored the TERT promoter mutations (12.8%) than tumors with wildtype TERT promoter (3.2%), P = .02 [Figure 3A].
FIGURE 3.
Frequency of TERT CNV by TERT mutation status and resulting TERT expression. A, TERT CNV and TERT mutation status. TERT CNV is represented by a deletion in green, no change in white, or amplification in orange. The bars show the frequency of the CNV in wildtype (WT) or TERT promoter mutant tumors, with the number of tumors shown above the bars and the frequency to the right of the bars. B, Normalized RNA-sequencing read counts of TERT expression by tumors with no change or amplification, stratified by TERT mutation status, WT or Mutant. Dots represent individual tumor expression levels, with the median and interquartile range depicted. Brackets showing a significance of P ≤ .05 are shown. CNV, copy number variation
3.5 |. TERT expression with TERT CNV and mutation
As TERT promoter mutations increase TERT expression,6 we next investigated TERT expression in these tumors. The mean normalized RNA-sequencing read counts of TERT expression of tumors with a TERT amplification showed significantly higher TERT expression than those without amplification, (3.18 vs 1.48, P = .04) [Supplemental Figure 1A]. When we further stratified the tumors by TERT amplification and TERT mutation status [Figure 3B], tumors harboring the TERT mutation showed significantly higher TERT expression (3.73) than tumors without the TERT mutation (1.44), P < .0001, while tumors with both TERT amplification and TERT mutation showed the highest TERT expression levels (12.11). The rare cases of tumors with TERT amplification without TERT mutation did not show increased TERT expression.
3.6 |. TERT CNV and BRS
The TCGA thyroid study proposed two molecular subtypes of PTC, BRAF-like or RAS-like, the former strongly associated with the classic and tall-cell variants of PTC and the BRAFV600E mutation, the latter with the FVPTC variant and RAS mutations. The TCGA project developed a BRAF/RAS score (BRS) to classify tumors based upon an expression signature as either BRAF or RAS driven.3 In the TCGA dataset, 390 tumors were scored as BRAF- or RAS-like. As expected, we found that a positive BRS (classified RAS-like) correlated with a higher follicular fraction, RAS mutations, and FVPTC histological subtype. Conversely, a negative BRS (classified BRAF-like) correlated with a lower follicular fraction, BRAF mutation, and classical or tall cell histological subtype (Supplemental Figure 2). It is worth noting, however, that by definition, any PTC with less than 99% follicular fraction is classified as classic PTC,11 some of which may therefore contain a substantial follicular component, often reflected by their BRS scores (see Supplemental Figure2).
In light of the diverging biological and clinical spectrum of these tumors, we further stratified the TERT CNV data by the BRS. BRAF-like tumors showed no significant association with TERT amplification or stage, though the later stage tumors showed a trend towards increased frequency of TERT amplification [Supplemental Figure 3A]. Conversely, RAS-like tumors showed a significant increase in frequency of TERT amplifications as tumor stage progressed [Supplemental Figure 4A]. The more common BRAF-like tumors mirrored the overall cohort with TERT amplifications occurring more frequently in the TERT mutant tumors (13.3%) compared to wildtype tumors (0.4%) [Supplemental Figure 3B], P < .001. TERT amplification may be associated with increased TERT expression (11.87) compared to the TERT mutation alone (3.75), but this did not reach statistical significance (Supplemental Figure 3C].
In contrast, RAS-like tumors showed no significant trend, with TERT amplification occurring similarly between wildtype and mutant TERT tumors [Supplemental Figure 4B].
3.7 |. BRAF CNV relationship to BRAF mutation and expression
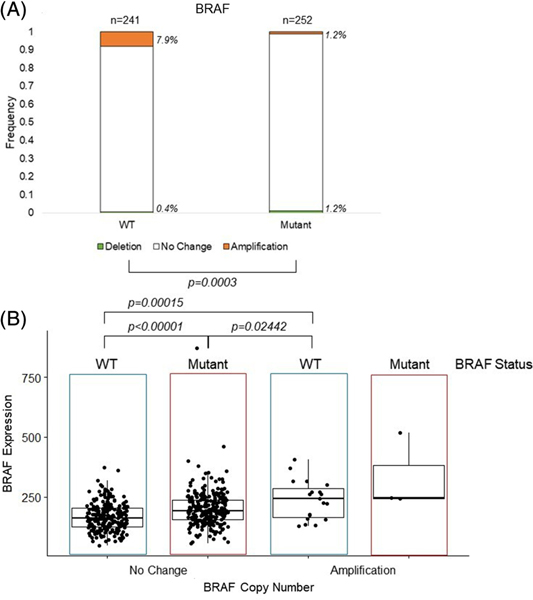
Next, we interrogated the relationship between BRAF CNV and BRAF mutation status. In contrast to our findings with TERT, BRAF amplifications were found significantly more frequently in tumors without BRAF mutations (7.9%), compared to tumors harboring BRAF mutations (1.2%), P < .001 [Figure 4A]. Amplification of BRAF in the PTC tumors resulted in a significant increase in BRAF expression in the BRAF amplified tumors (250.3) compared to tumors with no BRAF amplification (184.3), P < .001 [Supplemental Figure 1B], including BRAF mutant tumors, P = .02, while BRAF mutant tumors displayed a less pronounced, but still significant increase in expression (199.9) compared to BRAF wildtype tumors (166.9), P < .001 [Figure 4B]. Tumors with both BRAF amplification and BRAF mutation were very rare, and their BRAF expression did not significantly differ from wildtype BRAF amplified tumors (P = .36).
FIGURE 4.
Frequency of BRAF CNV by BRAF mutation status and resulting BRAF expression. A, BRAF CNV and BRAF mutation status. CNV is represented by a deletion in light grey, no change in white, or amplification in black, of BRAF. The bars show the frequency of the CNV in wildtype (WT) or BRAF mutant (Mutant) tumors, with the number of tumors shown above the bars and the frequency to the right of the bars italicized. Significance of P ≤ .05 of the frequency between two stages is denoted by brackets. B, Normalized RNA-sequencing read counts of BRAF expression by tumors with no change and amplification, stratified by BRAF mutation status, WT or Mutant. Dots represent individual tumor expression levels, with the median and interquartile range depicted. CNV, copy number variation
3.8 |. BRAF amplification and RAS-like association
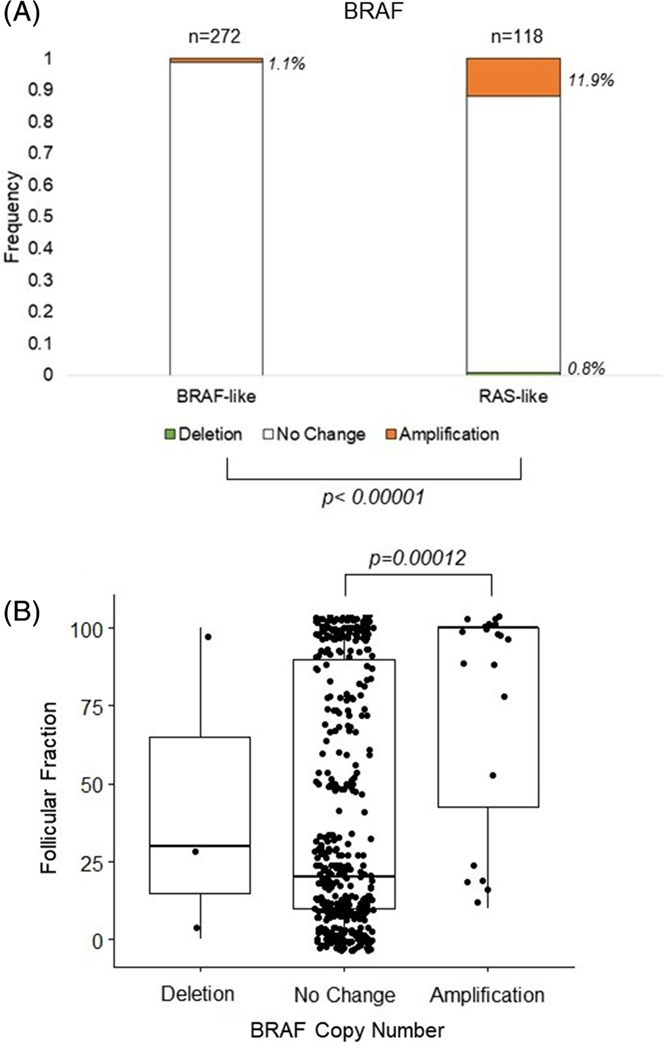
Given the significantly more frequent BRAF amplification associated with FVPTC (Figure 1B), we were interested in the relationship between BRAF amplification and the associated molecular pathway signatures. As seen in Figure 5A, the frequency of BRAF copy number amplification was significantly higher in the high BRS, RAS-like tumors than the BRAF-like tumors (11.9% vs. 1.1%, respectively, P < .001). In light of this difference, we also investigated the relationship between BRAF copy number and the histologically determined follicular fraction of the tumors. We were able to confirm a similar pattern with the BRAF amplified group, the latter showing a significantly higher follicular component (mean follicular component of 75%, median follicular component of 99%) than tumors with no change in BRAF copy number (mean 41.4, median 20, P = .00012) [Figure 5B].
FIGURE 5.
Frequency of BRAF CNV by BRS and follicular fraction, A, BRAF CNV and BRAF/RAS score (BRS) like status. CNV is represented by a deletion in light grey, no change in white, or amplification in black, of BRAF. The bars show the frequency of the CNV in BRAF-like or Ras-like tumors, with the number of tumors shown above the bars and the frequency to the right of the bars italicized. Significance of P ≤ .05 of the frequency is denoted by brackets. B, Follicular fraction in tumors with a deletion, no change, or amplification of BRAF. Dots represent individual follicular fraction amount, with the median and interquartile range depicted. CNV, copy number variation
4 |. DISCUSSION
The TCGA project provided a wealth of data on PTC, delineating different molecular pathways important in cancer regulation, and furthering our understanding of genetic drivers of malignancy in PTC. One molecular alteration examined was CNV. However, the TCGA analysis focused on arm-level alterations, rather than focal CNVs in these tumors. Further, a study of CNVs in conjunction with mutation status of key genes, TERT and BRAF, has not been performed to date. Utilizing the TCGA data, we explored the relationship between CNV, mutations, mRNA expression, and clinicopathological data.
In the TCGA PTC dataset, approximately 6% harbored focal TERT or BRAF CNVs, with amplifications more common than deletions. This is consistent with previous work showing selective growth advantages for cancer cells with oncogene amplification leading to increased oncogene expression.12 Interestingly, we found that both TERT and BRAF CNV was much more frequent in FVPTC than classical PTC. This phenomenon has been highlighted previously by Yoo et al. in their study of PTC and FTC, finding a higher percentage of somatic arm-level CNV in FVPTC than classical PTC.12 It has previously been conjectured that unlike PTC, CNV and chromosomal instability may drive FVPTC and pathogenesis,14 with CNV leading to different tumor histology.
TERT alterations may lead to activation of telomerase.15 The prevalence of both TERT mutations and TERT amplification increases in advanced stages of disease,15 and both TERT mutations, and TERT amplification are associated with increased TERT expression.16 We also found that PTCs with a TERT promoter mutation were more likely to have a TERT amplification (13%) than wildtype TERT tumors (3.2%, Figure 3), and tumors harboring both TERT alterations had the highest levels TERT expression, suggesting that the two TERT alterations may work in concert. Notably, this combination was only associated with BRAF-like tumors, while RAS-like tumors showed no such trend (Supplemental Figures 3 and 4).
Activating BRAF mutations are also a frequent alteration in PTC.17 While the BRAFV600E mutation is associated with disease severity,18 BRAF amplifications were not associated with disease stage. In contrast to our findings for TERT amplification and mutation, BRAF amplified tumors were more frequently associated with BRAF wildtype (86%) than with BRAF mutations (14%, Figure 4), and interestingly associated with a follicular morphology and RAS-like molecular signature (Figure 5), rather than BRAF-like features. Furthermore, the BRAF amplified tumors were associated with a higher follicular fraction than the wildtype BRAF tumors. This further supports the conjecture that BRAF mutations and BRAF amplifications result in divergent molecular and morphological signatures.
The TCGA PTC study established two molecular subtypes of PTC, BRAF-like or RAS-like. BRAF-like defined tumors were associated with classical PTC morphology and BRAF mutation, while RAS-like tumors were associated with FVPTC and RAS mutations.3 Indeed, we found the association of the BRS with mutation status and histological subtype to hold true. Our work further expanded this by demonstrating a correlation between the morphological follicular fraction and the BRS (Supplemental Figure 2). The lower follicular fraction tumors were associated with BRAF-like tumors, and the higher follicular fraction tumors were associated with RAS-like tumors. Tumors with an intermediate follicular fraction did not show a propensity to harbor either BRAF or RAS mutation.
It is worth noting that, unlike the TERT promoter mutation, which increases TERT transcription, the BRAFV600E mutation causes constitutive activation of the MEK/ERK signaling pathway.19 In contrast, we found BRAF amplification was associated with significantly higher BRAF expression than seen in PTCs with mutated BRAF. The resulting increased wildtype BRAF proteins, however, still require RAS-mediated activation, while the mutated BRAF proteins do not. Indeed, 23% of BRAF amplified tumors had concurrent amplifications of RAS genes, while this was observed in only 2% of BRAF mutant tumors. Therefore, BRAF amplification and BRAF mutation may result in activation of different pathways, since the former would require concurrent active RAS signaling, which would not be necessary in the latter. Further work is needed to understand the molecular pathways altered by BRAF amplification alone compared to BRAF mutation.
In summary, we have demonstrated and characterized copy number amplifications of two important cancer genes in thyroid cancer, TERT and BRAF, and shown their differing associations with mutation status. Tumors with TERT amplification were more frequently found to also harbor a TERT promoter mutation, leading to additional increased TERT expression and, were associated with later stage disease. Conversely, BRAF amplifications were found in tumors with wildtype BRAF, and were associated with FVPTC and a RAS-like molecular signature, suggesting the possibility of two divergent cellular signaling scenarios associated with either BRAF mutations or BRAF amplifications. This is the first in-depth study to look at TERT and BRAF mutation status and CNVs harboring these genes in PTCs. Continued study of TERT and BRAF activation by CNV in conjunction with mutation status will help to further elucidate thyroid tumor carcinogenesis.
Supplementary Material
ACKNOWLEDGMENTS
This work was supported by the following grants: National Institutes of Health, Grant/Award Numbers: R01CA222779, T32-GM007445; National Science Foundation, Grant/Award Number: 1746891.
Footnotes
SUPPORTING INFORMATION
Additional supporting information may be found online in the Supporting Information section at the end of this article.
DATA AVAILABILITY STATEMENT
All data are available in the TCGA public repositories references in the manuscript.
REFERENCES
- 1.Lauer S, Gresham D. An evolving view of copy number variants. Curr Genet. 2019;65(6):1287–1295. 10.1007/s00294-01900980-0. [DOI] [PubMed] [Google Scholar]
- 2.Tanaka H, Watanabe T. Mechanisms underlying recurrent genomic amplification in human cancers. Trends Cancer. 2020;6(6):462–477. 10.1016/j.trecan.2020.02.019. [DOI] [PMC free article] [PubMed] [Google Scholar]
- 3.Agrawal N, Akbani R, Aksoy BA, et al. Integrated genomic characterization of papillary thyroid carcinoma. Cell. 2014;159(3):676–690. 10.1016/j.cell.2014.09.050. [DOI] [PMC free article] [PubMed] [Google Scholar]
- 4.Broad_Institute_TCGA_Genome_Data_Analysis_Center. SNP6 Copy Number Analysis (GISTIC2). Boston, MA: Broad Institute of MIT and Harvard; 2016. [Google Scholar]
- 5.Avin BA, Umbricht CB, Zeiger MA. Human telomerase reverse transcriptase regulation by DNA methylation, transcription factor binding and alternative splicing (review). Int J Oncol. 2016;49(6):2199–2205. 10.3892/ijo.2016.3743. [DOI] [PMC free article] [PubMed] [Google Scholar]
- 6.Panebianco F, Nikitski AV, Nikiforova MN, Nikiforov YE. Spectrum of TERT promoter mutations and mechanisms of activation in thyroid cancer. Cancer Med. 2019;8(13):5831–5839. 10.1002/cam4.2467. [DOI] [PMC free article] [PubMed] [Google Scholar]
- 7.Paulsson JO, Mu N, Shabo I, et al. TERT aberrancies: a screening tool for malignancy in follicular thyroid tumours. Endocr Relat Cancer. 2018;25(7):723–733. 10.1530/ERC-18-0050. [DOI] [PubMed] [Google Scholar]
- 8.Kassambara A. ggpubr: “ggplot2” Based Publication Ready Plots.: Github. https://github.com/kassambara/ggpubr. [Google Scholar]
- 9.R_Core_Team. R: A Language and Environment for Statistical Computing. Vienna, Austria: R Foundation for Statistical Computing; 2018. https://www.R-project.org. [Google Scholar]
- 10.Ciampi R, Zhu Z, Nikiforov YE. BRAF copy number gains in thyroid tumors detected by fluorescence in situ hybridization. Endocr Pathol. 2005;16(2):99–105. 10.1385/ep:16:2:099. [DOI] [PubMed] [Google Scholar]
- 11.Rosai J, Sobin LH. Tumors of the thyroid gland. Atlas of tumor pathology. Third series, Fascicle 5 Washington. DC: Armed Forces Institute of Pathology. 1992;49–121. [Google Scholar]
- 12.Beroukhim R, Mermel H, Porter D, et al. The landscape of somatic copy-number alteration across human cancers. Nature. 2010;463 (7283):899–905. 10.1038/nature08822. [DOI] [PMC free article] [PubMed] [Google Scholar]
- 13.Yoo SK, Lee S, Kim SJ, et al. Comprehensive analysis of the transcriptional and mutational landscape of follicular and papillary thyroid cancers. PLoS Genet. 2016;12(8):e1006239. 10.1371/journal.pgen.1006239. [DOI] [PMC free article] [PubMed] [Google Scholar]
- 14.Wreesmann VB, Ghossein RA, Hezel M, et al. Follicular variant of papillary thyroid carcinoma: genome-wide appraisal of a controversial entity. Genes Chromosomes Cancer. 2004;40(4):355–364. 10.1002/gcc.20049. [DOI] [PubMed] [Google Scholar]
- 15.McKelvey BA, Umbricht CB, Zeiger MA. Telomerase reverse transcriptase (TERT) regulation in thyroid cancer: a review. Front Endocrinol (Lausanne). 2020;11:485. 10.3389/fendo.2020.00485. [DOI] [PMC free article] [PubMed] [Google Scholar]
- 16.Huang FW, Hodis E, Xu MJ, Kryukov GV, Chin L, Garraway LA. Highly recurrent TERT promoter mutations in human melanoma. Science. 2013;339(6122):957–959. 10.1126/science.1229259. [DOI] [PMC free article] [PubMed] [Google Scholar]
- 17.Xing M. Molecular pathogenesis and mechanisms of thyroid cancer. Nat Rev Cancer. 2013;13(3):184–199. 10.1038/nrc3431. [DOI] [PMC free article] [PubMed] [Google Scholar]
- 18.Kebebew E, Weng J, Bauer J, et al. The prevalence and prognostic value of BRAF mutation in thyroid cancer. Ann Surg. 2007;246(3): 466–470. 10.1097/SLA.0b013e318148563d. [DOI] [PMC free article] [PubMed] [Google Scholar]
- 19.Cantwell-Dorris ER, O’Leary JJ, Sheils OM. BRAFV600E: implications for carcinogenesis and molecular therapy. Mol Cancer Ther. 2011;10(3):385–394. 10.1158/1535-7163.MCT-10-0799. [DOI] [PubMed] [Google Scholar]
Associated Data
This section collects any data citations, data availability statements, or supplementary materials included in this article.
Supplementary Materials
Data Availability Statement
All data are available in the TCGA public repositories references in the manuscript.


