

Abstract
Monitoring of SARS-CoV-2 in wastewater (WW) is a promising tool for epidemiological surveillance, correlating not only viral RNA levels with the infection dynamics within the population, but also to viral diversity. However, the complex mixture of viral lineages in WW samples makes tracking of specific variants or lineages circulating in the population a challenging task. We sequenced sewage samples of 9 WW-catchment areas within the city of Rotterdam, used specific signature mutations from individual SARS-CoV-2 lineages to estimate their relative abundances in WW and compared them against those observed in clinical genomic surveillance of infected individuals between September 2020 and December 2021. We showed that especially for dominant lineages, the median of the frequencies of signature mutations coincides with the occurrence of those lineages in Rotterdam's clinical genomic surveillance. This, along with digital droplet RT-PCR targeting signature mutations of specific variants of concern (VOCs), showed that several VOCs emerged, became dominant and were replaced by the next VOC in Rotterdam at different time points during the study. In addition, single nucleotide variant (SNV) analysis provided evidence that spatio-temporal clusters can also be discerned from WW samples. We were able to detect specific SNVs in sewage, including one resulting in the Q183H amino acid change in the Spike gene, that was not captured by clinical genomic surveillance. Our results highlight the potential use of WW samples for genomic surveillance, increasing the set of epidemiological tools to monitor SARS-CoV-2 diversity.
Keywords: SARS-CoV-2, Wastewater genomic surveillance, Next generation sequencing, RT-ddPCR, Single nucleotide variant, Viral diversity
Graphical abstract

1. Introduction
Monitoring the diversity of the severe acute respiratory syndrome coronavirus 2 (SARS-CoV-2) has become an essential part of public health decision-making policies worldwide. In the Netherlands, a relatively large proportion of SARS-CoV-2 positive samples has been sequenced to identify circulating viral lineages, resulting in >140,000 SARS-CoV-2 genomes (https://www.gisaid.org/; accessed on October 17, 2022). Despite this unprecedented surveillance effort, the often incomplete identification and sequencing of asymptomatic, pre- and post-symptomatic cases can generate biases in clinical genomic surveillance (Suhail et al., 2021). These biases can be even larger in low-income community settings with systemic healthcare disparities and limited access to full genome sequencing. Therefore, additional surveillance and epidemiological tools would help to overcome these issues and support data-driven policies to combat the pandemic.
Although SARS-CoV-2 primarily replicates in the upper and lower respiratory tract (Rosenke et al., 2021), the virus can also replicate in the gut (Jones et al., 2020). Viral RNA can be detected in feces of around 40 % of infected people (Natarajan et al., 2022). As a consequence, viral RNA can be detected in wastewater (WW) of communities where the virus is circulating. SARS-CoV-2 RNA titers in WW have been shown to be directly proportional to the number of COVID-19 cases in the catchment area (de Graaf et al., 2022; Medema et al., 2020; Reynolds et al., 2022; Wurtzer et al., 2020), making wastewater-based surveillance a valuable monitoring tool. Furthermore, virus genome sequencing of WW, also called “wastewater genomic surveillance”, offers the possibility to monitor SARS-CoV-2 diversity. Given that both symptomatic and asymptomatic individuals contribute to the viral load in sewage, WW surveillance may provide a less biased overview of the SARS-CoV-2 diversity circulating in a community than clinical genomic surveillance alone. Currently, hundreds of variants/lineages have been reported, from which some, based on transmission efficiency, disease severity, antigenicity and prevalence are designated as either variants of concern (VOCs) or variants of interest (VOIs) (https://cov-lineages.org/) (O'Toole et al., 2021). The continuous emergence of novel VOCs, their spread and replacement by the next VOC, is generally associated with immune evasion induced by vaccination or previous infections (Chang et al., 2022; Windsor et al., 2022), highlighting the importance of continuous surveillance to anticipate potential new infection waves. Next-generation sequencing (NGS) can identify viral lineages/variants from WW samples, where the identified lineages or mutations often resemble those detected in clinical settings, with the additional advantage to identify mutations undetected by clinical genomic surveillance (Herold et al., 2021; Izquierdo-Lara et al., 2021; Pérez-Cataluña et al., 2022). However, haplotype reconstruction of SARS-CoV-2 from WW by using short-read data remains challenging as the samples are composed of a mixture of viral genomes. Tracing individual signature mutations in WW can provide valuable information on the spread of VOIs/VOCs (Farkas et al., 2020). In general, single nucleotide variant (SNV) frequencies could be linked to observations from clinical sequencing surveillance (Martin et al., 2020), providing information about the circulating viral diversity and potentially of new emerging mutations of biological and/or epidemiological relevance. In addition to NGS, digital droplet RT-PCR (RT-ddPCR) can also be used for the estimation of the prevalence of particular lineages or VOCs in WW (Heijnen et al., 2021; Ho et al., 2022). Based on probe binding kinetics, RT-ddPCR allows for accurate detection of mutations at frequencies as low as 0.5 % or >3 copies per PCR reaction (Heijnen et al., 2021), making it possible to detect low frequency mutations and discern between similar sequences (Heijnen et al., 2021; Pekin et al., 2011).
Here, we estimated the distribution of SARS-CoV-2 lineages/VOCs circulating in Rotterdam, the Netherlands, based on genome sequencing and RT-ddPCR of WW and compared this to clinical genomic surveillance data. Additionally, we detected local and temporal patterns of circulation for specific SNVs in the Spike gene that were minimally or not observed in clinical genomic surveillance during the same time period. Our results emphasize the potential role of wastewater-based genomic epidemiology, particularly regarding the tracing of novel VOCs and specific mutations.
2. Materials and methods
2.1. Wastewater sample collection and preparation
WW samples from 9 catchment areas in Rotterdam were collected and processed as previously described (Izquierdo-Lara et al., 2021; Medema et al., 2020). Briefly, 100–200 mL of sewage was collected as 24-h flow-dependent composite samples, centrifuged and the supernatant was concentrated with 100 kDa Centricon ultrafilters (Millipore Sigma); dengue virus type-2 RNA was used as an internal extraction control. RNA was extracted with the Nuclisens kit (bioMérieux) and KingFisher purification system (Thermo Fisher Scientific). RNA was screened by quantitative reverse transcription PCR (RT-qPCR) with the N2 primer/probe set targeting the SARS-CoV-2 nucleocapsid (N) gene and the internal control.
2.2. Amplicon-based genome sequencing of WW samples
Illumina sequencing was performed as described previously (Izquierdo-Lara et al., 2021) with some modifications. Amplicons were generated by multiplex PCR using either in-house overlapping primers or the QIAseq SARS-CoV-2 Primer Panel (QIAGEN). Amplicons were purified with 0.8× AMPure XP beads (Beckman Coulter) and 100 ng of DNA was used to generate each paired-end Illumina sequencing library by using the KAPA HyperPlus library preparation kit (Roche). We used the KAPA Unique Dual-Indexed Adapters Kit (Roche) to enable subsequent sequencing of multiple libraries in a single Illumina MiSeq version 3 flowcell (2 × 300 cycles) (Illumina).
2.3. Single nucleotide variant (SNV) detection and lineage reconstruction
Read processing, reference-based alignment and variant analysis were performed using a previously described workflow (Izquierdo-Lara et al., 2021), set in the Galaxy EU server (Afgan et al., 2018). Briefly, FASTQ raw reads were filtered by Fastp (Chen et al., 2018). Reads were mapped against the Wuhan-Hu-1 strain genome (Accession number: MN908947) (Wu et al., 2020) by using the default settings of BWA-MEM (Li, 2013). Reads were realigned by using the leftalign utility from FreeBayes (Garrison and Marth, 2012). Tables containing SNVs were generated with iVar variants method (Grubaugh et al., 2019), using a Phred score > 30 and a minimum of 3 reads containing the alternative nucleotide. Variant positions are based on the Wuhan-Hu-1 reference. Samples with <10 % of the genome covered with ≥50× were dismissed from further analysis.
A custom-made Python script was used to associate SNVs to signature mutations for each lineage of interest. The database containing the list of signature mutations (Supplementary Table S3) was generated from publicly available data (https://covariants.org/). The abundance of each lineage was defined as described elsewhere (Rios et al., 2021), meaning that it was calculated as the median of all unique signature mutations related to that specific lineage (mutations not shared with other lineages in our database). To estimate the circulation of each lineage in whole Rotterdam's WW, the data of all available locations in the study were pooled per time-point. WW data was weighted based on the population size of each location of the available samples. For the 3 nested locations, when more than one was available, only data of the larger catchment area was taken into account. Estimation of Delta sub-lineages (AY.*) prevalence in WW was done by using the specific signature mutations of the sub-lineages (https://www.pango.network/summary-of-designated-ay-lineages/), provided that the Delta variant was detected in the sample. Prevalent sub-lineages were defined as those that reach >5 % of the total clinical sequences in Rotterdam during a particular month.
2.4. Clinical genomic surveillance
Nasopharyngeal swabs from RT-qPCR positive (Ct < 33) individuals were used to sequence SARS-CoV-2 genomes on the Nanopore platform (Oxford Nanopore Technologies) as previously described (Oude Munnink et al., 2020). All generated genomes were uploaded to GISAID (Shu and McCauley, 2017). For the whole country dataset, all the available SARS-CoV-2 consensus genomes (105,342 sequences, genome coverage ≥95 %) were retrieved from GISAID on the 6th of June 2022. This dataset included all sequences from Rotterdam. We aligned both datasets (Netherlands and Rotterdam) using MAFFT (https://mafft.cbrc.jp/alignment/server). PANGO lineages (pangolin v4.0.6) (O'Toole et al., 2021) were assigned automatically by GISAID and this information was downloaded as metadata along with the genome sequences.
2.5. RT-ddPCR for quantitation of specific SARS-CoV-2 mutations in sewage
We have previously shown that RT-ddPCR assays can be used to simultaneously quantify the presence of the N501Y mutation and wild type sequence (assay ID dMDS731762551) (Heijnen et al., 2021). Following this approach, we expanded this method by using assays (designed by Bio-Rad Laboratories) that specifically target signature mutations T19R (assay ID dMDS657809058), G339D (assay ID dMDS682550858), N856K (assay ID dMDS900687606), LPPA24S (assay ID dMDS737327537) mutations associated with Delta, B.1.1.529 (all Omicron lineages), BA.1 and BA.2 VOCs, respectively, to determine the frequency of these signature mutations. The reaction conditions used for these assays were identical to the conditions used for the N501Y specific assay (Heijnen et al., 2021). The proportion of each targeted signature mutation in the Spike gene RNA fragments was calculated by the QuantaSoft-Analysis software as the concentration of the signature mutation in the RT-ddPCR reaction, divided by the sum of the concentration of the wild type sequence and the targeted signature in the ddPCR reaction. The 95 % confidence intervals of the proportion of the signature mutation were calculated assuming a Poisson distribution of RNA molecules in the droplets.
2.6. Datasets
The WW genomic surveillance dataset was obtained by sequencing a total of 693 sewage samples taken longitudinally from those 9 locations within Rotterdam, the Netherlands, spanning between the 16th of September 2020 and the 9th of December 2021 (Supplementary Table S1). Fig. 1A shows a map of the Rotterdam WW catchments. A group of 3 catchment areas form a cascade where upstream catchments discharge into larger downstream catchments as follows: Katendrecht, Pretorialaan and Pretorialaan-Zuidplein. Fig. 1B shows the temporal distribution per location of the WW samples. Sewage samples were frequently sequenced from the 16th of September until the 6th of August 2021. After the first detection of Omicron BA.1 in a clinical sample from Rotterdam on the 24th of November 2021 (GISAID id: EPI_ISL_7651134), and additional set of WW samples collected between the 24th of November and 6th of December 2021 were sequenced. In addition, to assess the sensitivity of WW sequencing to detect and estimate the prevalence of VOCs, we also determined the relative abundance of Alpha, Delta and Omicron BA.1 and BA.2 VOCs in Pretorialaan-Zuidplein WW by RT-ddPCR (Heijnen et al., 2021). WW samples from this location, starting from the 25th of November 2020 until the 28th of February 2022 were evaluated with RT-ddPCR, including those that were sequenced during the same period and location (magenta and cyan dots in Fig. 1B).
Fig. 1.

Geographic and temporal distribution of WW and clinical samples in Rotterdam. A) Map of Rotterdam and Bergschenhoek indicating the catchment areas. B) Temporal distribution of WW samples per location. Katendrecht, Pretorialaan and Pretorialaan-Zuidplein WWs form a cascade were an upstream catchment discharges into the next larger downstream catchment. Green, magenta and cyan dots represent WW samples that were either sequenced, evaluated by RT-ddPCR or both, respectively. C) Distribution over time of the number of sequenced clinical surveillance samples (blue line, left Y-axis) and number of SARS-CoV-2 positive cases per 100,000 individuals within Rotterdam (red line, right Y-axis). Both the number of obtained sequences and the number of positive cases over time are shown as 7-day rolling averages (date ± 3 days). (For interpretation of the references to color in this figure legend, the reader is referred to the web version of this article.)
To compare SARS-CoV-2 diversity, below ground (WW surveillance dataset) with above ground data, we used clinical genomic surveillance data from Rotterdam. This second dataset contained SARS-CoV-2 genomes from samples acquired by 3 strategies: i) random sampling of SARS-CoV-2 cases in Rotterdam obtained from the Dutch Public Health Service (GGD) from SARS-CoV-2 testing streets program (de Graaf et al., 2022); ii) by tracing outbreaks of importance and; iii) sampling of patients and healthcare workers from hospitals within Rotterdam. For outbreak tracing, we sequenced samples from cases in Rotterdam that were associated with travelling from the UK after the emergence of the Alpha variant and from South-Africa and Portugal when the Beta variant was first reported. A total of 3298 SARS-CoV-2 genomes were obtained between the 1st of September 2020 and the 28th of February 2022 (Supplementary Table S2). Fig. 1C displays the temporal distribution of the samples sequenced in our clinical genomic surveillance dataset, which are not linked to specific catchment areas. WW NGS results were compared against Rotterdam's clinical genomic surveillance dataset as a whole.
3. Results
3.1. Abundances of major circulating SARS-CoV-2 lineages in WW show similar trends to those observed in clinical genomic surveillance
We sequenced sewage samples taken longitudinally from those 9 locations within Rotterdam (Fig. 1A, Section 2.6) The corresponding populations range from 6500 to 138,280 inhabitants and, overall, they represent 70.6 % of the city's total population (Centraal Bureau voor de Statistiek, 2021; de Graaf et al., 2022). To compare SARS-CoV-2 diversity, below ground (WW surveillance dataset) with above ground data, we used clinical genomic surveillance data from Rotterdam (Section 2.6). To determine the proportion of the major lineages circulating in WW over time, we determined the relative frequencies of their unique signature mutations in each single location by performing variant analyses. Fig. 2A shows the frequencies of mutations associated to major lineages that were detected in Heemraadsplein WW, the largest catchment area in Rotterdam. The B.1 lineage emerged and became dominant quickly after the emergence of SARS-CoV-2 at the beginning of 2020 (Rambaut et al., 2020) and this lineage is the ancestor lineage of all currently circulating strains, including all VOIs and VOCs. Four signature mutations define this lineage and its descendants, including the D614G amino-acid change (A23403G) that is associated with increased infectivity of the virus (Ozono et al., 2021). Thus, as expected, all WW samples showed high frequency (>95 %) of these 4 mutations, illustrating the reliability of our method to detect SNVs in WW (Fig. 2A).
Fig. 2.

Relative abundance of SARS-CoV-2 major lineages in a single WW catchment area (Heemraadsplein). A) Heatmap showing the frequency of the unique signature mutations per lineage. B) Median of the relative frequencies of the unique signature mutations in WW samples of Heemraadsplein (red line) vs. relative abundance of the lineage in clinical samples from Rotterdam during the same time period (gray shaded area). Plots for all locations are shown in Supplementary Fig. S1. All available data per time-point were taken into account to perform the calculations. Clinical data is shown as 7-day rolling average (date ± 3 days). (For interpretation of the references to color in this figure legend, the reader is referred to the web version of this article.)
Relative abundance of SARS-CoV-2 major lineages in a single WW catchment area (Heemraadsplein). A) Heatmap showing the frequency of the unique signature mutations per lineage. B) Median of the relative frequencies of the unique signature mutations in WW samples of Heemraadsplein (red line) vs. relative abundance of the lineage in clinical samples from Rotterdam during the same time period (gray shaded area). Plots for all locations are shown in Supplementary Fig. S1. All available data per time-point were taken into account to perform the calculations. Clinical data is shown as 7-day rolling average (date ± 3 days). (For interpretation of the references to color in this figure legend, the reader is referred to the web version of this article.)
The median of the relative frequencies of all unique signature mutations associated to a lineage was used to estimate the prevalence of the lineage within the WW sample. We compared the estimated distribution of lineages in each WW location with that captured by clinical surveillance in Rotterdam (Fig. 2B and Supplementary Fig. S1). In general, relative abundances of SARS-CoV-2 major circulating lineages showed similar trends to clinical data over time in all WW locations. Between September 2020 and January 2021, the major circulating lineages both in WW and in clinical surveillance were B.1.160, B.1.177 and B.1.221. These lineages were also dominant across Europe during the same period (https://covariants.org/). From the beginning of January 2021, the Alpha variant emerged and increased in relative abundance in all WW catchments, being first detected in Pretorialaan on the 6th of January 2021 at 5.0 % prevalence, while its first detection through clinical sampling in Rotterdam was on the 12th of November 2020. Alpha remained the dominant variant for around 6 months, after which it was replaced by Delta in the Netherlands between the end of June and beginning of July 2021. The Gamma variant was first detected in WW (Heemraadsplein) on the 8th of February 2021, while the first clinical case (GISAID id: EPI_ISL_2145780) in Rotterdam was detected 9 days later. For the other major variants early detection in WW was not observed. There were differences between the locations, the Gamma variant was for instance only detected in Rozenburg, Everlo-Waalhaven and Heemraadsplein (Fig. 2B and Supplementary Fig. S1). The Lambda VOI was not detected in sewage, and only 3 Lambda sequences were found by clinical surveillance in Rotterdam during the entire study period. No Omicron BA.1 nor BA.2 variants were detected in WW by NGS during the study period.
Supplementary Fig. S1.
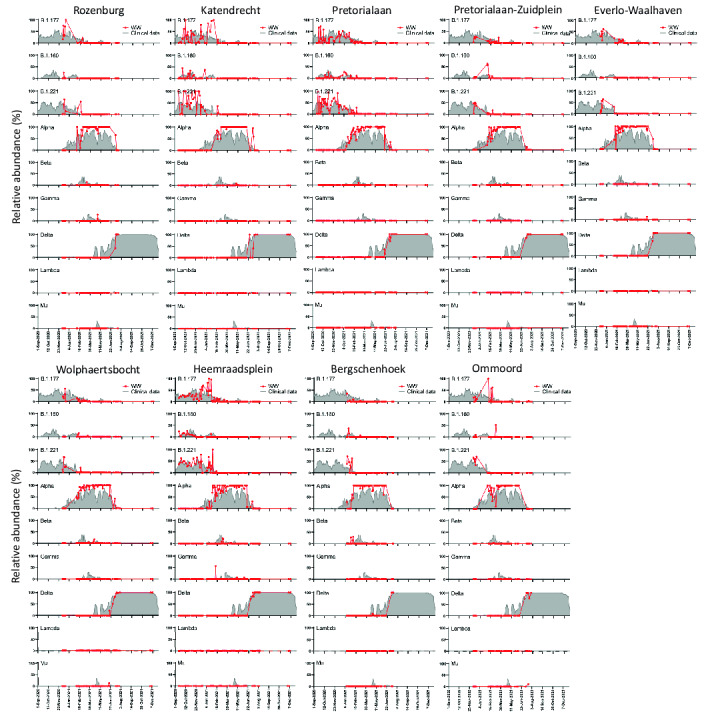
Median of the relative frequency of the unique signature mutations of specific lineages in WW samples of the 9 catchment areas in Rotterdam (red line) vs. relative abundance of the lineage in clinical samples from Rotterdam during the same time period (gray shaded area).
To estimate the average circulation of each variant in Rotterdam WW, we pooled the data of all available locations per time-point. Overall, variant dynamics coincided with that from Rotterdam's clinical surveillance (Fig. 3). However, there were some instances where VOCs were detected in clinical surveillance several weeks or even months before they were detected in WW. This is rather evident for both Alpha and Delta variants, that exhibited discontinuous peaks in their prevalence in clinical surveillance soon after their emergence (Figs. 2B and 3). The first detection of the Delta variant in clinical surveillance was on the 21st of January 2021, where only 2 sequences were detected (AY.34 sub-lineage). Then, the Delta variant was not detected for almost 3 months. A new peak of Delta was observed between the 14th and 25th of April 2021, belonging to AY.66 and AY.61 sub-lineages, reaching up to 50 % prevalence (7/14 sequences) on the 16th of April in a 7-day rolling average. During this period, the Delta variant was only detected in 2 WW locations: Bergschenhoek and Heemraadsplein, with 8.7 % and 6.1 % prevalence, respectively (Supplementary Fig. S1). Then, Delta was not detected in clinical samples during the following 18 days (0/19 samples), but afterwards, it became dominant (Supplementary Table S2). The estimated prevalence of Delta in the combined data of Rotterdam's WW at this period peaked at 2.6 % (Fig. 3). The fact that the sequences from the 1st peak belong to a different sub-lineage than the 2nd peak suggests that there were multiple introductions of the variant, and that the first lineages did not became established within the population.
Fig. 3.

Comparison of the pooled relative abundance of SARS-CoV-2 variants in Rotterdam's WW (red) versus relative occurrence in Rotterdam's clinical data (blue). The pooled relative abundance of each lineage for Rotterdam's WW was calculated by weighting the median of the unique signature mutations of a lineage in each WW location by the population size of that particular catchment area. All available data per time-point were taken into account to perform the calculations. Clinical data is shown as 7-day rolling average (date ± 3 days). (For interpretation of the references to color in this figure legend, the reader is referred to the web version of this article.)
3.2. Earlier detection of VOCs in WW using RT-ddPCR compared to WW sequencing
Next, we used RT-ddPCR to investigate the prevalence of Alpha, Delta, Omicron BA.1 and BA.2 variants in WW samples from the second largest location Pretorialaan-Zuidplein, and compared it to both clinical genomic surveillance and WW NGS datasets. NGS and RT-ddPCR of WW showed similar dynamics for Alpha and Delta variants (Fig. 4A). The first detection of the BA.1 variant by RT-ddPCR in Pretorialaan-Zuidplein WW was on the 10th of December 2021, and the relative abundance of Omicron BA.1 and BA.2 variants in WW showed similar trends to clinical genomic surveillance (Fig. 4A). WW samples after the 6th of December 2021 were not sequenced and therefore BA.1 or BA.2 variants were not detected by WW genomic surveillance. The rapid rise of BA.1 at the end of 2021 was observed by two different RT-ddPCR reactions that detect the N856K or G339D mutation (Fig. 4A), showing the robustness of the method. The former mutation is specific for the Omicron BA.1 lineage, while G339D is present in both BA.1 and BA.2.
Fig. 4.

Monitoring of SARS-CoV-2 VOCs in Pretorialaan-Zuidplein WW through RT-ddPCR. A) Comparison of the estimated relative abundance of SARS-CoV-2 VOCs in WW determined by NGS, RT-ddPCR and clinical surveillance. Error bars for WW-NGS show the interquartile range of the relative abundance of the signature mutations of a specific VOC. The relative abundance estimation of the VOCs by RT-ddPCR depended on the detection of signature mutations that generate amino-acid changes in the Spike gene: the N501Y for the Alpha variant, T19R for Delta, N856K for the Omicron BA.1 variant. Error bars for WW RT-ddPCR were calculated assuming a Poisson distribution of RNA molecules in droplets. B) Spearman correlation between the relative abundances of Alpha and Delta VOCs in sewage estimated by NGS or RT-ddPCR.
Given the specificity and sensitivity of RT-ddPCR to detect single mutations, even in the presence of large quantities of foreign nucleic acids and PCR inhibitors (Heijnen et al., 2021; Pekin et al., 2011), it was also used to determine the sensitivity of WW NGS to detect VOCs. Alpha and Delta abundances were estimated for the same samples using NGS and RT-ddPCR. From a total of 91 data point pairs, both methods were highly correlated (Spearman's R = 0.86, p-value < 0.0001) (Fig. 4B), indicating that our NGS method to estimate the distribution of VOCs from WW is reliable. A high correlation was still maintained, from 68 data point pairs, after all 0 %–0 % and 100 %–100 % pairs were removed (Spearman's R = 0.74, p-value < 0.0001) (data not shown). Nonetheless, RT-ddPCR is more sensitive to detect the presence of VOC circulating at a low relative abundance. This is evident for several points where RT-ddPCR was positive (<20 %), while the variant was not detected through NGS data (Fig. 4B). Other examples that support the higher sensitivity of RT-ddPCR are the 2 small peaks detected for Delta in Pretorialaan-Zuidplein WW, at 1 % and 1.3 %, during the 19th of April and 10th of May 2021, coinciding with peaks detected through clinical surveillance (Fig. 4A). Delta was not detected during these time periods by NGS for this WW location. However, Delta was sporadically detected during this period in other catchments (Bergschenhoek and Heemraadsplein) as mentioned in Section 3.1.
3.3. Specific mutations associated with Delta sub-lineages showed regional differences in circulation
During the circulation of the Delta VOC, multiple sub-lineages emerged, designated as “AY.*” (Focosi et al., 2022), which could be detected in WW. Typically, only 1 or 2 mutations differentiate one sub-lineage from another. Only SNVs generated from reads with high quality, high coverage and >1 % frequency were considered for the analysis. If more than one specific mutation defined a sub-lineage, we used the median of these specific mutations, provided that the Delta VOC was present in a sample, to determine the relative abundance of these sub-lineages per month per location (median of all available samples). We analyzed WW samples from all locations, and in some cases, the total percentage of the different Delta sub-lineages were slightly above 100 % (Fig. 4), likely due to experimental noise of the measurements. Since this effect was moderate, we did not correct these values to avoid overcorrection and keep data processing and interpretation simple (Rios et al., 2021). AY sub-lineages with >5 % prevalence in clinical genomic surveillance were consistently detected in WW (Fig. 5 ). Although, for some sub-lineages clear differences were observed between the two datasets, as is the case for AY.126, that was already detected in June 2021 in Wolphaertsbocht and Katendrecht WW samples before its detection in Rotterdam clinical surveillance samples in August 2021 (0.5 %). Notably, AY.126 was circulating in the Netherlands at very low relative abundance since June 2021 (0.04 %). In contrast, AY.9.2, that was the most prevalent sub-lineage in the Netherlands and Rotterdam between July and August 2021 (38.8 % and 27.8 %, respectively), was only detected at low prevalence (0 %–7.8 %) in WW samples for all locations. Interestingly, regional differences in the presence of some sub-lineages could be found between WW locations (Fig. 5). For example, the AY.66 sub-lineage, defined by the T6496C synonymous mutation, was only detected in Pretorialaan-Zuidplein catchment area, suggesting restricted local circulation within this area. On the other hand, during July 2021 the AY.122 sub-lineage, defined by the G1048T (ORF1ab: K261N) mutation, was found in most WW locations except in Bergschenhoek, which is located outside Rotterdam.
Fig. 5.

Relative abundance of SARS-CoV-2 Delta sub-lineages circulating in the Netherlands and Rotterdam city, detected by clinical genomic surveillance (two top left panels) and by genome sequencing of samples from 9 WW catchment areas in Rotterdam. The barplots show the fraction of the Delta sub-lineages (AY.*) in Rotterdam.
3.4. Detection of Spike SNVs shows circulation of cryptic mutations in WW
Given the importance of the Spike gene to changes in antigenicity and binding (Chang et al., 2022; Ding et al., 2021), we assessed the regional and temporal patterns of mutations in the Spike in WW from all locations and compared them to those found by clinical surveillance in Rotterdam and in the Netherlands. For the WW samples, a total of 656 different mutations were found in the Spike compared to the Wuhan-Hu-1 reference, from these 48 mutations that were found >30 times in our WW dataset were plotted for Heemraadsplein (Fig. 6A). The most prevalent Spike mutations found in WW were associated with dominant lineages or VOCs. For example, 23063T (N501Y) and 21618G (T19R) mutations were found frequently during the period of dominance of the Alpha and Delta VOCs, respectively. More interestingly, other SNVs consistently present in Rotterdam's WW were rarely or not detected at all by clinical sampling during the same time period. In Fig. 6B, selected SNVs were followed in WW samples for each location (red lines) and compared to their single nucleotide polymorphism (SNP) frequencies in sequenced genomes from clinical samples from Rotterdam and the Netherlands (bottom panels with blue lines). Differences in the spatio-temporal patterns of these SNVs/SNPs were observed. For 21572A (F4I), we observed an early detection in Wolphaertsbocht (1.1 %), Katendrecht (95.3 %) and Rozenburg (54.3 %) WW samples on the 19th, 26th and 28th of April 2021, respectively. In contrast, this SNP was only detected on the 8th of June 2021 in 2 sequences by clinical surveillance within Rotterdam. Nevertheless, this SNP was found at low but consistent frequency (<2 %) in Dutch sequences from the 8th of March to the 27th of June 2021. For the 22,111 T (Q183H) mutation a similar pattern was found, where the mutation was consistently found in WW, especially at Rozenburg where it was detected in 5 consecutive samples between the 5th and 22nd of February 2021, at frequencies ranging from 12.7 % to 100 % of the reads. Only 3 sequences harboring this mutation were found in Rotterdam's clinical genomic surveillance dataset, where it was first detected on the 17th of February 2021 (1/125 sequences during the same period). For 22450T and 24133T synonymous mutations spatial-temporal clusters were also observed in WW. Strikingly, the 22450T mutation was detected in 7 consecutive WW samples from Rozenburg and peaked at a 33.5 % frequency. Meanwhile, this mutation was not previously found in Rotterdam clinical sequences, nor during the 6 months after its detection in sewage, although it was detected by clinical surveillance across the country at very low frequencies (<0.5 %), suggesting cryptic circulation of viruses harboring this mutation, within Rotterdam.
Fig. 6.

Circulation of cryptic Spike mutations in Rotterdam WW catchment areas. A) Heatmap of the SNV frequency in the WW of Heemraadsplein, showing the most prevalent SNVs in the Spike gene for our dataset. B) Relative frequency of selected SNVs in the Spike gene in the 9 sewage locations (red lines) and in the clinical dataset (blue lines, bottom panels). Only SNVs with a Phred score > 30, a minimum coverage of 50× and at least 3 reads containing the alternative mutation (compared to the reference) were plotted. The SNV/SNP relative frequencies for clinical samples from Rotterdam and the Netherlands are plotted on a lower scale (up to 10 % and 2 %, respectively). (For interpretation of the references to color in this figure legend, the reader is referred to the web version of this article.)
4. Discussion
Wastewater genomic surveillance has the potential to be a valuable tool in population-wide monitoring of the diversity of SARS-CoV-2, especially in the context of emerging VOCs. Here, we show that, by using either NGS or RT-ddPCR, it is possible to estimate the distribution of specific viral lineages in the population, based on the detection of their signature mutations. Other studies support the use of WW as a monitoring tool, that reflects the diversity trends of SARS-CoV-2 circulating in a population (Heijnen et al., 2021; Herold et al., 2021; Pérez-Cataluña et al., 2022; Reynolds et al., 2022; Rios et al., 2021). By using a longitudinal dataset of Rotterdam's WW samples from different locations within the city, we were able to observe similarities and fine differences between clinical and WW surveillances at a local level. Moreover, our SNV analysis provided evidence that spatio-temporal clusters, which sometimes were not captured by clinical genomic surveillance, can also be discerned from WW samples.
WW genomic surveillance by NGS and RT-ddPCR reflects the diversity of circulating VOCs in the population. Both methods have advantages that can complement each other to overcome their respective disadvantages. RT-ddPCR can be used to track specific VOCs or relevant mutations with high sensitivity in a relatively low-cost manner (Heijnen et al., 2021). As a downside, previous knowledge of targeted signature mutations, as well as testing and validation of the primer/probe sets are required before its use. Conversely, WW NGS allows unbiased characterization of the viral diversity, and the possibility to detect novel or unknown lineages and variants. However, the sensitivity of NGS to detect low prevalence variants is lower than RT-ddPCR, as shown by our data. Therefore, depending on the aims and resources of a surveillance program, one or both tools can be used to complement clinical surveillance.
Although several studies reported early detection of VOCs in sewage (Karthikeyan et al., 2022; Nag et al., 2022; Vo et al., 2022), in most cases we did not observed this for our data. This could be related to technical reasons, such as incomplete coverage of Rotterdam's population by our WW samples, or the resolution of our assays. However, these results could also be due to the rapid and extensive Dutch COVID-19 response with regards to the sequencing of clinical samples and biases in clinical surveillance sampling, such as heterogeneous testing across the population, overrepresentation of more severe cases and a bias towards outbreaks of importance. The last can be related to the apparent high circulation of Delta during its 2nd peak (50 % of sequences) in April 2021. Whereas, a coinciding peak in WW was found only for 2 locations at relatively low prevalence in Rotterdam. Putatively, the high prevalence of Delta in clinical cases during its 2nd peak was related to disproportionally sequencing outbreak samples that were anticipated to contain Delta, due to their possible impact on variant spread. Hence, early detection of VOCs in sewage compared to clinical surveillance is influenced by the amount and strategy of clinical surveillance in a country. Understandably, the more “controlled” the pandemic is, the less patients are sampled for genomic surveillance. Therefore, WW surveillance can help to have an unbiased continuous monitoring of SARS-CoV-2 diversity in a low-cost and sustainable manner, that can substitute clinical genomic surveillance for early detection of VOCs/VOIs, helping public health responses.
WW NGS can be used to find and track mutations that are not detected by clinical surveillance and identify regional differences. We showed that SNVs can be linked to spatio-temporal clusters, and that WW can help for epidemiological tracing of SARS-CoV-2 variants. Moreover, continuous monitoring of mutations in the Spike gene related to possible immune-escape phenotypes is an important part of every SARS-CoV-2 surveillance program. Illustrating this, here we identified the Q183H amino-acid change in the Spike, that was cryptically circulating in WW, with minimal representation in clinical samples. Q183H has emerged sporadically in several lineages throughout the pandemic and it has not been specifically linked to any lineage of the virus (<70 % prevalence per lineage) (https://outbreak.info/) (Gangavarapu et al., 2022). Interestingly, this mutation has been reported as one of the mutations that arose and became fixed in an immunocompromised patient after receiving remdesivir and intravenous immunoglobulin treatments (Choi et al., 2020). However, its impact on the antigenicity or fitness of the virus needs to be determined. Recent studies from us and others have revealed that WW surveillance frequently identifies mutations that are not or rarely observed in clinical samples (Fontenele et al., 2021; Izquierdo-Lara et al., 2021; Smyth et al., 2022). Given the major contribution of human excreta to the sewer, the most likely explanation is that these cryptic mutations are coming from unsampled outbreaks within the population, but the contribution of other mammalian species cannot be ruled out (Smyth et al., 2022).
5. Conclusions
In conclusion, we have demonstrated the reliability of WW surveillance, both by NGS and RT-ddPCR, for monitoring the rise and fall of SARS-CoV-2 variants. We were able to detect specific SNVs in sewage, including mutations in the Spike gene, that were not captured by clinical genomic surveillance. Our results highlight the potential use of WW samples for genomic surveillance, allowing for comprehensive tracing of circulating lineages, emergent VOCs, spatio-temporal clusters, and specific mutations especially when clinical surveillance is scaled down. Our approaches have the potential to be expanded beyond SARS-CoV-2, to other viruses, that are shed in WW, for which there is limited clinical surveillance.
The following are the supplementary data related to this article.
Summary of the wastewater samples sequenced from Rotterdam. Samples depicted in red were not taking into account for further analysis.
Summary of the Rotterdam's clinical samples sequenced in this study.
Signature mutations associated to SARS-CoV-2 lineages, VOIs or VOCs. Only unique mutations were used for determining the relative abundance of such variants. Positions are given with respect to the Wuhan-Hu-1 genome (MN908947).
Author authorship contribution statement
Ray W. Izquierdo-Lara: Conceptualization, Methodology, data analysis, Writing – original draft. Leo Heijnen: Conceptualization, Methodology, Data analysis, Writing – review & editing. Bas B. Oude Munnink: Methodology, Data analysis, Writing – review & editing. Claudia M.E. Schapendonk: Methodology, Writing – review & editing. Goffe Elsinga: Methodology, Writing – review & editing. Jeroen Langeveld: Writing – review & editing. Johan Post: Writing – review & editing. Divyae K. Prasad: Methodology, Writing – review & editing. Christian Carrizosa: Writing – review & editing. Frederic Been: Writing – review & editing. Janko van Beek: Methodology, Writing – review & editing. Remy Schilperoort: Writing – review & editing. Rianne Vriend: Writing – review & editing. Ewout Fanoy: Writing – review & editing. Evelien I.T. de Schepper: Writing – review & editing. Reina S. Sikkema: Writing – review & editing. Richard Molenkamp: Writing – review & editing, Resources. Frank M. Aarestrup: Writing – review & editing. Gertjan Medema: Conceptualization, Writing – review & editing, Supervision. Marion P.G. Koopmans: Conceptualization, Writing – review & editing, Supervision, Resources. Miranda de Graaf: Conceptualization, data analysis, Writing – original draft, Supervision, Resources.
Declaration of competing interest
All the authors declare no competing interests. The funders had no role in the design of the study; in the collection, analyses, or interpretation of data; in the writing of the manuscript, or in the decision to publish the results.
Acknowledgements
We would like to thank I. Chestakova, A. van der Linden, M. Boter and B. Weller for excellent technical assistance. We would like to thank Dirk Eggink and Harry Vennema (Dutch Public Health Institute – RIVM) for their contribution to the Dutch clinical surveillance sequence dataset. We gratefully acknowledge the authors and laboratories originating and submitting the Dutch sequences from GISAID EpiCoV database (Shu and McCauley, 2017), which we used during this research.
This work was supported by the European Union's H2020 grants VEO (grant no. 874735) and METASTAVA (grant no. 773830), the Dutch Research Council (NWO) under the 2018 Stevin award (Koopmans), the Erasmus MC Foundation and the Adessium Foundation.
Editor: Warish Ahmed
Data availability
The raw SARS-CoV-2 sequencing files (.fastq) from Rotterdam's WW are available on the European Nucleotide Archive (ENA) under Bioproject PRJEB48206. Accession IDs and other relevant information of clinical sequencing data of Rotterdam is available in the Supplementary Table S2. All these genome sequences and their metadata are available in GISAID database.
References
- Afgan E., Baker D., Batut B., van den Beek M., Bouvier D., Cech M., Chilton J., Clements D., Coraor N., Grüning B.A., Guerler A., Hillman-Jackson J., Hiltemann S., Jalili V., Rasche H., Soranzo N., Goecks J., Taylor J., Nekrutenko A., Blankenberg D. The galaxy platform for accessible, reproducible and collaborative biomedical analyses: 2018 update. Nucleic Acids Res. 2018;46(W1):W537–W544. doi: 10.1093/nar/gky379. [DOI] [PMC free article] [PubMed] [Google Scholar]
- Centraal Bureau voor de Statistiek StatLine. 2021. https://opendata.cbs.nl/#/CBS/en/ November 6.
- Chang M.R., Ke H., Coherd C.D., Wang Y., Mashima K., Kastrunes G.M., Huang C.-Y., Marasco W.A. Analysis of a SARS-CoV-2 convalescent cohort identified a common strategy for escape of vaccine-induced anti-RBD antibodies by Beta and Omicron variants. EBioMedicine. 2022;80 doi: 10.1016/j.ebiom.2022.104025. [DOI] [PMC free article] [PubMed] [Google Scholar]
- Chen S., Zhou Y., Chen Y., Gu J. Fastp: an ultra-fast all-in-one FASTQ preprocessor. Bioinformatics (Oxford, England) 2018;34(17):i884–i890. doi: 10.1093/bioinformatics/bty560. [DOI] [PMC free article] [PubMed] [Google Scholar]
- Choi B., Choudhary M.C., Regan J., Sparks J.A., Padera R.F., Qiu X., Solomon I.H., Kuo H.-H., Boucau J., Bowman K., Adhikari U.D., Winkler M.L., Mueller A.A., Hsu T.Y.-T., Desjardins M., Baden L.R., Chan B.T., Walker B.D., Lichterfeld M., Li J.Z.… Persistence and evolution of SARS-CoV-2 in an immunocompromised host. N. Engl. J. Med. 2020;383(23):2291–2293. doi: 10.1056/NEJMc2031364. [DOI] [PMC free article] [PubMed] [Google Scholar]
- de Graaf M., Langeveld J., Post J., Carrizosa C., Franz E., Elsinga G., Heijnen L., Been F., van Beek J., Schilperoort R., Vriend R., Fanoy E., de Schepper E.I.T., Koopmans M.P.G., Medema G., Izquierdo-Lara Ray W. Infectious Diseases (Except HIV/AIDS) 2022. Capturing the SARS-CoV-2 infection pyramid within the municipality of Rotterdam using longitudinal sewage surveillance [Preprint] [DOI] [PMC free article] [PubMed] [Google Scholar]
- Ding C., He J., Zhang X., Jiang C., Sun Y., Zhang Y., Chen Q., He H., Li W., Xie J., Liu Z., Gao Y. Crucial mutations of spike protein on SARS-CoV-2 evolved to variant strains escaping neutralization of convalescent plasmas and RBD-specific monoclonal antibodies. Front. Immunol. 2021;12 doi: 10.3389/fimmu.2021.693775. https://www.frontiersin.org/article/10.3389/fimmu.2021.693775 [DOI] [PMC free article] [PubMed] [Google Scholar]
- Farkas K., Hillary L.S., Malham S.K., McDonald J.E., Jones D.L. Wastewater and public health: the potential of wastewater surveillance for monitoring COVID-19. Curr. Opin. Environ. Sci. Health. 2020;17:14–20. doi: 10.1016/j.coesh.2020.06.001. [DOI] [PMC free article] [PubMed] [Google Scholar]
- Focosi D., Maggi F., McConnell S., Casadevall A. Spike mutations in SARS-CoV-2 AY sublineages of the Delta variant of concern: implications for the future of the pandemic. Future Microbiol. 2022;17:219–221. doi: 10.2217/fmb-2021-0286. [DOI] [PMC free article] [PubMed] [Google Scholar]
- Fontenele R.S., Kraberger S., Hadfield J., Driver E.M., Bowes D., Holland L.A., Faleye T.O.C., Adhikari S., Kumar R., Inchausti R., Holmes W.K., Deitrick S., Brown P., Duty D., Smith T., Bhatnagar A., Yeager R.A., Holm R.H., von Reitzenstein N.H., Varsani A.… High-throughput sequencing of SARS-CoV-2 in wastewater provides insights into circulating variants. Water Res. 2021;205 doi: 10.1016/j.watres.2021.117710. [DOI] [PMC free article] [PubMed] [Google Scholar]
- Gangavarapu K., Latif A.A., Mullen J.L., Alkuzweny M., Hufbauer E., Tsueng G., Haag E., Zeller M., Aceves C.M., Zaiets K., Cano M., Zhou J., Qian Z., Sattler R., Matteson N.L., Levy J.I., Lee R.T., Freitas L., Maurer-Stroh S., Hughes L.D. medRxiv; 2022. Outbreak.info Genomic Reports: Scalable and Dynamic Surveillance of SARS-CoV-2 Variants and Mutations. (p. 2022.01.27.22269965) [DOI] [PMC free article] [PubMed] [Google Scholar]
- Garrison E., Marth G. ArXiv:1207.3907 [q-Bio; 2012. Haplotype-based variant detection from short-read sequencing.http://arxiv.org/abs/1207.3907 [Google Scholar]
- Grubaugh N.D., Gangavarapu K., Quick J., Matteson N.L., De Jesus J.G., Main B.J., Tan A.L., Paul L.M., Brackney D.E., Grewal S., Gurfield N., Van Rompay K.K.A., Isern S., Michael S.F., Coffey L.L., Loman N.J., Andersen K.G. An amplicon-based sequencing framework for accurately measuring intrahost virus diversity using PrimalSeq and iVar. Genome Biol. 2019;20(1):8. doi: 10.1186/s13059-018-1618-7. [DOI] [PMC free article] [PubMed] [Google Scholar]
- Heijnen L., Elsinga G., de Graaf M., Molenkamp R., Koopmans M.P.G., Medema G. Droplet digital RT-PCR to detect SARS-CoV-2 signature mutations of variants of concern in wastewater. Sci. Total Environ. 2021;799 doi: 10.1016/j.scitotenv.2021.149456. [DOI] [PMC free article] [PubMed] [Google Scholar]
- Herold M., d’Hérouël A.F., May P., Delogu F., Wienecke-Baldacchino A., Tapp J., Walczak C., Wilmes P., Cauchie H.-M., Fournier G., Ogorzaly L. Genome sequencing of SARS-CoV-2 allows monitoring of variants of concern through wastewater. Water. 2021;13(21) doi: 10.3390/w13213018. [DOI] [Google Scholar]
- Ho J., Stange C., Suhrborg R., Wurzbacher C., Drewes J.E., Tiehm A. SARS-CoV-2 wastewater surveillance in Germany: long-term RT-digital droplet PCR monitoring, suitability of primer/probe combinations and biomarker stability. Water Res. 2022;210 doi: 10.1016/j.watres.2021.117977. [DOI] [PMC free article] [PubMed] [Google Scholar]
- Izquierdo-Lara R., Elsinga G., Heijnen L., Munnink B.B.O., Schapendonk C.M.E., Nieuwenhuijse D., Kon M., Lu L., Aarestrup F.M., Lycett S., Medema G., Koopmans M.P.G., de Graaf M. Monitoring SARS-CoV-2 circulation and diversity through community wastewater sequencing, the Netherlands and Belgium. Emerg. Infect. Dis. 2021;27(5):1405–1415. doi: 10.3201/eid2705.204410. [DOI] [PMC free article] [PubMed] [Google Scholar]
- Jones D.L., Baluja M.Q., Graham D.W., Corbishley A., McDonald J.E., Malham S.K., Hillary L.S., Connor T.R., Gaze W.H., Moura I.B., Wilcox M.H., Farkas K. Shedding of SARS-CoV-2 in feces and urine and its potential role in person-to-person transmission and the environment-based spread of COVID-19. Sci. Total Environ. 2020;749 doi: 10.1016/j.scitotenv.2020.141364. [DOI] [PMC free article] [PubMed] [Google Scholar]
- Karthikeyan S., Levy J.I., Hoff P.D., Humphrey G., Birmingham A., Jepsen K., Farmer S., Tubb H.M., Valles T., Tribelhorn C.E., Tsai R., Aigner S., Sathe S., Moshiri N., Henson B., Mark A.M., Hakim A., Baer N.A., Barber T., Knight R. medRxiv; 2022. Wastewater Sequencing Uncovers Early, Cryptic SARS-CoV-2 Variant Transmission. [DOI] [PMC free article] [PubMed] [Google Scholar]
- Li H. ArXiv:1303.3997 [q-Bio]; 2013. Aligning sequence reads, clone sequences and assembly contigs with BWA-MEM.http://arxiv.org/abs/1303.3997 [Google Scholar]
- Martin J., Klapsa D., Wilton T., Zambon M., Bentley E., Bujaki E., Fritzsche M., Mate R., Majumdar M. Tracking SARS-CoV-2 in sewage: evidence of changes in virus variant predominance during COVID-19 pandemic. Viruses. 2020;12(10) doi: 10.3390/v12101144. [DOI] [PMC free article] [PubMed] [Google Scholar]
- Medema G., Heijnen L., Elsinga G., Italiaander R., Brouwer A. Presence of SARS-Coronavirus-2 RNA in sewage and correlation with reported COVID-19 prevalence in the early stage of the epidemic in the Netherlands. Environ. Sci. Technol. Lett. 2020 doi: 10.1021/acs.estlett.0c00357. [DOI] [PubMed] [Google Scholar]
- Nag A., Arora S., Sinha V., Meena E., Sutaria D., Gupta A.B., Medicherla K.M. Monitoring of SARS-CoV-2 variants by wastewater-based surveillance as a sustainable and pragmatic approach—a case study of Jaipur (India) Water. 2022;14(3) doi: 10.3390/w14030297. [DOI] [Google Scholar]
- Natarajan A., Zlitni S., Brooks E.F., Vance S.E., Dahlen A., Hedlin H., Park R.M., Han A., Schmidtke D.T., Verma R., Jacobson K.B., Parsonnet J., Bonilla H.F., Singh U., Pinsky B.A., Andrews J.R., Jagannathan P., Bhatt A.S. Gastrointestinal symptoms and fecal shedding of SARS-CoV-2 RNA suggest prolonged gastrointestinal infection. Med. (New York, N.Y.) 2022 doi: 10.1016/j.medj.2022.04.001. [DOI] [PMC free article] [PubMed] [Google Scholar]
- O’Toole Á., Hill V., Pybus O.G., Watts A., Bogoch I.I., Khan K., Messina J.P., COVID-19 Genomics UK (COG-UK) consortium. Network for Genomic Surveillance in South Africa (NGS-SA) Brazil-UK CADDE Genomic Network. Tegally H., Lessells R.R., Giandhari J., Pillay S., Tumedi K.A., Nyepetsi G., Kebabonye M., Matsheka M., Mine M., Kraemer M.U.G., N. for G. S. in S Tracking the international spread of SARS-CoV-2 lineages B.1.1.7 and B.1.351/501Y-V2 (6:121) Wellcome Open Res. 2021 doi: 10.12688/wellcomeopenres.16661.1. [DOI] [PMC free article] [PubMed] [Google Scholar]
- Oude Munnink B.B., Nieuwenhuijse D.F., Stein M., O’Toole Á., Haverkate M., Mollers M., Kamga S.K., Schapendonk C., Pronk M., Lexmond P., van der Linden A., Bestebroer T., Chestakova I., Overmars R.J., van Nieuwkoop S., Molenkamp R., van der Eijk A.A., GeurtsvanKessel C., Vennema H., Dutch-Covid-19 response team Rapid SARS-CoV-2 whole-genome sequencing and analysis for informed public health decision-making in the Netherlands. Nat. Med. 2020 doi: 10.1038/s41591-020-0997-y. (p. 2022.01.27.22269965) [DOI] [PubMed] [Google Scholar]
- Ozono S., Zhang Y., Ode H., Sano K., Tan T.S., Imai K., Miyoshi K., Kishigami S., Ueno T., Iwatani Y., Suzuki T., Tokunaga K. SARS-CoV-2 D614G spike mutation increases entry efficiency with enhanced ACE2-binding affinity. Nat. Commun. 2021;12(1) doi: 10.1038/s41467-021-21118-2. [DOI] [PMC free article] [PubMed] [Google Scholar]
- Pekin D., Skhiri Y., Baret J.-C., Le Corre D., Mazutis L., Salem C.B., Millot F., El Harrak A., Hutchison J.B., Larson J.W., Link D.R., Laurent-Puig P., Griffiths A.D., Taly V. Quantitative and sensitive detection of rare mutations using droplet-based microfluidics. Lab Chip. 2011;11(13):2156–2166. doi: 10.1039/c1lc20128j. [DOI] [PubMed] [Google Scholar]
- Pérez-Cataluña A., Chiner-Oms Á., Cuevas-Ferrando E., Díaz-Reolid A., Falcó I., Randazzo W., Girón-Guzmán I., Allende A., Bracho M.A., Comas I., Sánchez G. Spatial and temporal distribution of SARS-CoV-2 diversity circulating in wastewater. Water Res. 2022;211 doi: 10.1016/j.watres.2021.118007. [DOI] [PMC free article] [PubMed] [Google Scholar]
- Rambaut A., Holmes E.C., O’Toole Á., Hill V., McCrone J.T., Ruis C., du Plessis L., Pybus O.G. A dynamic nomenclature proposal for SARS-CoV-2 lineages to assist genomic epidemiology. Nat. Microbiol. 2020 doi: 10.1038/s41564-020-0770-5. [DOI] [PMC free article] [PubMed] [Google Scholar]
- Reynolds L.J., Gonzalez G., Sala-Comorera L., Martin N.A., Byrne A., Fennema S., Holohan N., Kuntamukkula S.R., Sarwar N., Nolan T.M., Stephens J.H., Whitty M., Bennett C., Luu Q., Morley U., Yandle Z., Dean J., Joyce E., O’Sullivan J.J., Meijer W.G.… SARS-CoV-2 variant trends in Ireland: wastewater based epidemiology and clinical surveillance. Sci. Total Environ. 2022 doi: 10.1016/j.scitotenv.2022.155828. [DOI] [PMC free article] [PubMed] [Google Scholar]
- Rios G., Lacoux C., Leclercq V., Diamant A., Lebrigand K., Lazuka A., Soyeux E., Lacroix S., Fassy J., Couesnon A., Thiery R., Mari B., Pradier C., Waldmann R., Barbry P. Monitoring SARS-CoV-2 variants alterations in Nice neighborhoods by wastewater nanopore sequencing. Lancet Reg. Health. Europe. 2021;10 doi: 10.1016/j.lanepe.2021.100202. [DOI] [PMC free article] [PubMed] [Google Scholar]
- Rosenke K., Feldmann F., Okumura A., Hansen F., Tang-Huau T.-L., Meade-White K., Kaza B., Callison J., Lewis M.C., Smith B.J., Hanley P.W., Lovaglio J., Jarvis M.A., Shaia C., Feldmann H. UK B.1.1.7 (Alpha) variant exhibits increased respiratory replication and shedding in nonhuman primates. Emerg. Microbes Infect. 2021;10(1):2173–2182. doi: 10.1080/22221751.2021.1997074. [DOI] [PMC free article] [PubMed] [Google Scholar]
- Shu Y., McCauley J. GISAID: global initiative on sharing all influenza data - from vision to reality. Euro Surveill. 2017;22(13) doi: 10.2807/1560-7917.ES.2017.22.13.30494. [DOI] [PMC free article] [PubMed] [Google Scholar]
- Smyth D.S., Trujillo M., Gregory D.A., Cheung K., Gao A., Graham M., Guan Y., Guldenpfennig C., Hoxie I., Kannoly S., Kubota N., Lyddon T.D., Markman M., Rushford C., San K.M., Sompanya G., Spagnolo F., Suarez R., Teixeiro E., Dennehy J.J. Tracking cryptic SARS-CoV-2 lineages detected in NYC wastewater. Nat. Commun. 2022;13(1) doi: 10.1038/s41467-022-28246-3. [DOI] [PMC free article] [PubMed] [Google Scholar]
- Suhail Y., Afzal J., Kshitiz Incorporating and addressing testing bias within estimates of epidemic dynamics for SARS-CoV-2. BMC Med. Res. Methodol. 2021;21(1):11. doi: 10.1186/s12874-020-01196-4. November 6. [DOI] [PMC free article] [PubMed] [Google Scholar]
- Vo V., Tillett R.L., Papp K., Shen S., Gu R., Gorzalski A., Siao D., Markland R., Chang C.-L., Baker H., Chen J., Schiller M., Betancourt W.Q., Buttery E., Pandori M., Picker M.A., Gerrity D., Oh E.C. Use of wastewater surveillance for early detection of alpha and epsilon SARS-CoV-2 variants of concern and estimation of overall COVID-19 infection burden. Sci. Total Environ. 2022;835 doi: 10.1016/j.scitotenv.2022.155410. [DOI] [PMC free article] [PubMed] [Google Scholar]
- Windsor I.W., Tong P., Lavidor O., Sanjari Moghaddam A., McKay L.G.A., Gautam A., Chen Y., MacDonald E.A., Yoo D.K., Griffiths A., Wesemann D.R., Harrison S.C. Antibodies induced by ancestral SARS-CoV-2 strain that cross-neutralize variants from alpha to omicron BA.1. Sci. Immunol. 2022 doi: 10.1126/sciimmunol.abo3425. [DOI] [PMC free article] [PubMed] [Google Scholar]
- Wu F., Zhao S., Yu B., Chen Y.-M., Wang W., Song Z.-G., Hu Y., Tao Z.-W., Tian J.-H., Pei Y.-Y., Yuan M.-L., Zhang Y.-L., Dai F.-H., Liu Y., Wang Q.-M., Zheng J.-J., Xu L., Holmes E.C., Zhang Y.-Z. A new coronavirus associated with human respiratory disease in China. Nature. 2020;579(7798):265–269. doi: 10.1038/s41586-020-2008-3. [DOI] [PMC free article] [PubMed] [Google Scholar]
- Wurtzer S., Marechal V., Mouchel J., Maday Y., Teyssou R., Richard E., Almayrac J., Moulin L. Evaluation of lockdown effect on SARS-CoV-2 dynamics through viral genome quantification in waste water, greater Paris, France, 5 March to 23 April 2020. Eurosurveillance. 2020;25(50) doi: 10.2807/1560-7917.ES.2020.25.50.2000776. [DOI] [PMC free article] [PubMed] [Google Scholar]
Associated Data
This section collects any data citations, data availability statements, or supplementary materials included in this article.
Supplementary Materials
Summary of the wastewater samples sequenced from Rotterdam. Samples depicted in red were not taking into account for further analysis.
Summary of the Rotterdam's clinical samples sequenced in this study.
Signature mutations associated to SARS-CoV-2 lineages, VOIs or VOCs. Only unique mutations were used for determining the relative abundance of such variants. Positions are given with respect to the Wuhan-Hu-1 genome (MN908947).
Data Availability Statement
The raw SARS-CoV-2 sequencing files (.fastq) from Rotterdam's WW are available on the European Nucleotide Archive (ENA) under Bioproject PRJEB48206. Accession IDs and other relevant information of clinical sequencing data of Rotterdam is available in the Supplementary Table S2. All these genome sequences and their metadata are available in GISAID database.