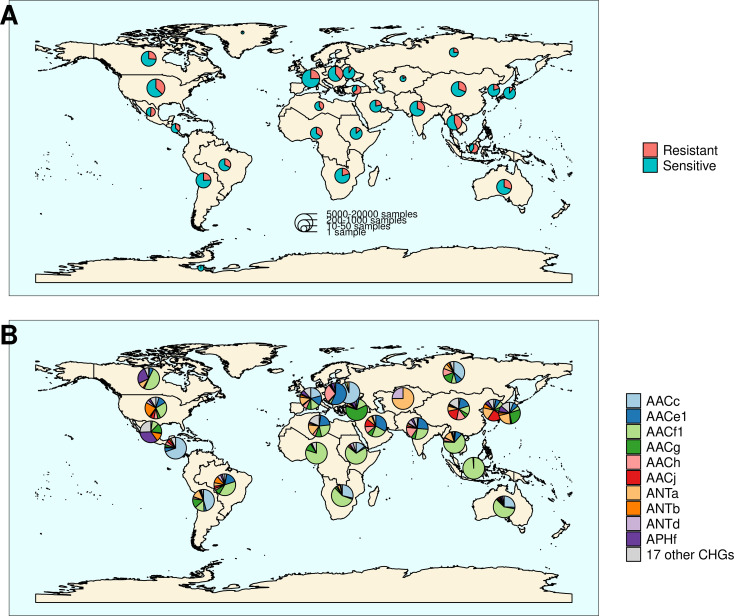
Figure 2. Distribution of aminoglycoside-resistant bacteria and AME-encoding genes over the world.
(A) Distribution of sampled aminoglycoside-resistant bacteria in the world. The frequencies of resistant and sensitive bacteria are displayed in red and blue, and the size of pies represents the number of genomes sampled in a given region. (B) Distribution of sampled AME genes in the world. Pie size is irrelevant to the number of samples.

