

Abstract
Objectives
Noise is one of the most common exposures, and occupational noise-induced hearing loss (NIHL) is highly prevalent. In addition to NIHL, noise is linked to numerous non-auditory health effects. The Occupational Safety and Health Administration (OSHA) maintains the Integrated Management Information System (IMIS) database of compliance-related measurements performed in various industries across the US. The goal of the current study was to describe and analyze personal noise measurements available through the OSHA IMIS, identifying industries with elevated personal noise levels or increasing trends in worker exposure over time.
Methods
Through a Freedom of Information Act request, we obtained OSHA’s noise measurements collected and stored in IMIS between 1979 and 2013, and analyzed Permissible Exposure Limit (PEL) and Action Level (AL) criteria measurements by to two-digit industry code.
Results
The manufacturing industry represented 87.8% of the 93,920 PEL measurements and 84.6% of the 58,073 AL measurements. The highest mean noise levels were found among the agriculture, forestry, fishing and hunting industry for PEL (93.1 dBA) and the mining, quarrying, and oil and gas extraction group for AL (93.3 dBA). Overall, measurements generally showed a decreasing trend in noise levels and exceedances of AL and PEL by year, though this was not true for all industries.
Conclusions
Our results suggest that, despite reductions in noise over time, further noise control interventions are warranted both inside and outside of the manufacturing industry. Further reductions in occupational noise exposures across many industries are necessary to continue to reduce the risk of occupational NIHL.
Keywords: Occupational noise, Noise-Induced Hearing Loss, NIHL, noise exposure, industry, OSHA
INTRODUCTION
Noise is one of the most common environmental [1,2] and occupational [3] exposures, and noise-induced hearing loss (NIHL) is highly prevalent worldwide,[4] with enormous associated costs.[5–8] While NIHL is one of the leading occupational diseases in industrialized nations,[9] noise is increasingly being linked to non-auditory health effects such as coronary heart disease,[10,11] hypertension,[12,13] and myocardial infarction.[14,15] Noise has also been linked to other problems such as sleep disturbance, perceived stress, and reduced quality of life,[16,17] as well as possible mental health issues.[18] These non-auditory effects represent substantial and recognized threats to public health [19] (e.g., cardiovascular disease is the number one cause of death in the US [20]), in contrast to NIHL, which has historically received little attention.
The 1970 Occupational Safety and Health Act established a Permissible Exposure Limit (PEL) for noise of 90 A-weighted decibels (dBA) as an 8-hr time weighted average (TWA). Workers exposed above this level were required to be protected from noise using noise controls (i.e. hearing protection). In 1983, OSHA adopted an Action Level (AL) of 85 dBA TWA; workers exposed above this level had to be enrolled in a hearing conservation program (HCP), in which they are provided hearing protection, audiograms, training, and noise exposure monitoring, among other requirements.[21] To ensure employer compliance with the PEL and AL, OSHA conducts noise monitoring of US workplaces. Measurement criteria is determined at the inspector’s discretion (PEL vs. AL) and is likely based on perceived noise values and noise monitoring equipment settings. Although these metrics share use of A-weighting, a slow time constant, an 8-hour criterion duration, and a time-intensity exchange rate of 5 dB; they use different criterion levels (the level which results in 100% dose for the associated criterion duration, 90 dBA for PEL and 85 dBA for AL) and threshold levels (90 dBA for the PEL vs 80 dBA for the AL). The lower threshold used in the AL results in AL measurements always being equal to or exceeding corresponding PEL measurements, as the AL incorporates noise levels from 80–90 dBA where the PEL treats values below 90 dBA as zero noise.
OSHA has maintained PEL measurement data since 1979, and AL measurement data since 1983, in its Integrated Management Information System (IMIS). PEL and AL noise data collected between 1979 and 1999 have been analyzed previously by Middendorf, who found that most of the then-available 155,378 PEL and AL measurements occurred within the manufacturing industry.[22] Overall, Middendorf showed a decrease in non-compliant measurements (those exceeding 90 dBA using PEL criteria, and 85 dBA using AL criteria) between 1989 and 1998, but the final five years of the analysis indicated increasing PEL levels within manufacturing.[22] Other than the work by Middendorf, no large-scale longitudinal analyses of trends in occupational noise exposures in the US have been published, and comprehensive industry-specific temporal analyses appear to be available for only two industries: construction [23] and metals manufacturing.[24]
The goal of the current study was to provide an update on the previous analyses presented by Middendorf [22] through the inclusion of additional personal noise measurements made between 2000 and 2013. We also sought to identify industries with limited personal noise exposure data, elevated personal noise levels, or stagnant or increasing trends in worker exposure over time.
METHODS
Data Collection
Personal noise exposure records from full-shift dosimeter measurements made in US workplaces by OSHA compliance officers between 1979 and 2013 were obtained through a Freedom of Information Act Request (Tracking No. 733737) from OSHA. A total of 114,903 PEL measurements and 78,372 AL measurements were received. Datasets were obtained from OSHA as Microsoft Excel (Redmond, WA) files and were then transferred to STATA Version 14 (College Station, TX) for further cleaning and analysis. Data received did not include variables describing the reason for the measurement, geographical region, size of establishment, or union presence.
Data Cleaning and Management
Records were evaluated and removed if any of the following criteria were met: no dose value provided, average sound pressure level (LAVG) ≤60 dBA or ≥120 dBA, full-shift sampling duration <6 hrs or >16 hrs. Additionally, any measurements with invalid (i.e. the recorded information indicated that the measurement was “blood”, “bulk”, or otherwise inconsistent with a noise measurement), unclear, missing industry or occupation coding, or was represented as an area measurement instead of personal sample, were eliminated. These cleaning criteria differ slightly from those used previously by Middendorf,[22] who excluded inconsistently coded measurements and those measurements where the average sound pressure level was greater than 1% different from the TWA (limiting measurements to those that were approximately eight hours). Notably, Middendorf did not specify how area measurements were handled in the data, while this present analysis only focused on personal noise measurements. In addition, the number of measurements that were received was less than what was reported by Middendorf despite the fact that this analysis takes place more than a decade later. Noise exposure measurements recorded in accumulated noise dose were converted to equivalent full-shift Time-Weighted Average (TWA) using Equation 1:
| Equation 1: |
Industry information was coded according to the 2012 North American Industry Classification System (NAICS).[25] Industry information was harmonized using publicly available cross-walks published by the U.S. Census Bureau [26]. The industry information for each measurement was collapsed to the first two digits of the NAICS codes (industry group) in order to maintain a moderate degree of industry specificity at the expense of job-level details. Codes for manufacturing (NAICS 31–33) were combined into one code (30); retail trade categories were also combined (NAICS 44–45 renumbered as 43), as were transportation and warehousing (NAICS 48–49 renumbered as 47). All other two-digit industry categories remained as provided. NAICS 55 (Management of Companies and Enterprises) was excluded due to the small available number of samples.
Data Analysis
Data cleaning and analysis were completed using STATA Version 14 (College Station, TX). After data cleaning, descriptive statistics on noise TWA and non-compliance (i.e., exceedance) for the PEL and AL measurements were calculated by year and in five-year bins overall and stratified by two-digit NAICS code.
Model validation
Ordinary least squares (OLS) linear regression models were constructed to estimate 8-hour mean PEL and AL noise TWA exposures. These models used either the PEL or AL as the outcome variable and the two-digit NAICS code and year (in five-year bins) as predictor variables. As we have done previously,[27] we used the single “hold-out” method described by Kohavi and Arlot [28,29] to validate the estimates from our models. To do so, prior to running the regression models, we randomly (using a fixed seed to ensure replicability) divided both the AL and PEL measurements into a test set (75% of the dataset) and a validation set (the remaining 25% of our data). We compared these results to the results of using 10-fold cross-validation [29]. The AL and PEL estimates from models based on our training dataset were stratified by two-digit NAICS code and compared to measurements in the validation set that were not used in modeling. Because of the large number of measurements in some two-digit NAICS codes, normal hypothesis testing would be overpowered and produce results that are statistically significant but not practically different.[30] Therefore, we compared the 10th, 50th, and 90th percentiles of the estimated values and the hold-out values for each two-digit NAICS code. We considered the measurement tolerance of a type 2 sound level meter (+/− 2 dB) as our threshold of meaningful difference when comparing the estimated results from the model and the hold-out values.[31,32] This method is more conservative than standard hypothesis testing considering the large number of measurements.
RESULTS
Descriptive Analysis
Overall, a total of 20,983 PEL and 20,299 AL measurements were discarded during data cleaning, leaving a total of 93,920 PEL and 58,073 AL measurements for use in analysis (Table 1). Most PEL and AL measurements were removed for not representing full-shift noise data (33,543 measurements). Measurements were also removed if an SIC or NAICS code could not be assigned (4,687), when the noise level fell outside of the range 60–120 dBA (1,277), or when the original data file from OSHA indicated that a measurement was an area measurement (1,774). One AL measurement was deleted because it was recorded prior to the promulgation of the AL measurement criteria in 1983. An examination of the distribution of PEL and AL measurements indicated that the distributions were roughly normal albeit with a longer tail on the left side of the distribution.
Table 1.
Description of received and valid OSHA IMIS noise measurements by metric (PEL and AL) for the years 1979–2013.
| PEL | AL | |
|---|---|---|
|
| ||
| Measurements received | 114,903 | 78,372 |
| Total removed | 20,983 | 20,299 |
| Not full-shift | 16,560 | 16,983 |
| NAICS or SIC code could not be assigned | 1,520 | 2,167 |
| Measurement >120 or < 60 dBA | 1,073 | 204 |
| Area samples | 830 | 944 |
| AL measurement before 1983 | - | 1 |
| Valid measurements used for analyses | 93,920 | 58,073 |
Noise over Time
From 1979 to 2013, overall PEL and AL averages were 88.7 dBA and 91.6 dBA respectively, with PEL measurement variability being generally higher than AL variability (standard deviations ranged from 6.2–9.5 dB for PEL vs 6.1–7.5 dB for AL measurements). The highest PEL and AL levels were recorded during the first five-year bin (1979–1984), with a PEL of 90.8 ± 6.2 dBA, and an AL of 94.2 ± 6.3 dBA, although AL measurements were only available for a fraction of that time window (from 1983–1984). For the most recent year group (2010–2013), approximately one-third of all PEL measurements exceeded 90 dBA, while nearly four-fifths of AL measurements exceeded 85 dBA (Table 2). Both PEL and AL measurements showed an overall decreasing trend in noise levels and exceedances of the respective exposure standard by year, with the exception of a small increase in PEL averages from 2011–2013 (Figure 1). This trend is also demonstrated in Table 2, where each five-year bin average is lower than the previous five-year bin for both PEL and AL measurements; the small uptick in 2011–2013 in the PEL values in Figure 1 is absent in the year bins presented in Table 2. On average, both the PEL and the AL decreased at an average rate of 0.13 dBA per year (data not shown).
Table 2.
Description of OSHA compliance noise measurements by two-digit NAICS industry code, year group, and metric (PEL and AL) for the years 1979–2013.
| PEL (N=93,920) |
AL (N=58,073) |
|||||
|---|---|---|---|---|---|---|
| NAICS two-digit Industry (Code)1 | N | Mean (SD) | >90 dBA (%) | N | Mean (SD) | >85 dBA (%) |
|
| ||||||
| Overall | 93,920 | 88.7 (8.2) | 50.5 | 58,073 | 91.6 (6.8) | 85.7 |
| Accommodation and food services (72) | 309 | 83.1 (8.9) | 22.3 | 305 | 86.9 (7.1) | 71.5 |
| Administrative and support and waste management and remediation services (56) | 720 | 86.9 (9.9) | 42.1 | 643 | 89.4 (8.4) | 76.4 |
| Agriculture, forestry, fishing and hunting (11) | 345 | 93.1 (6.8) | 77.7 | 148 | 93.1 (8.3) | 87.2 |
| Arts, entertainment, and recreation (71) | 179 | 82.8 (8.8) | 19.0 | 208 | 86.4 (7.3) | 60.6 |
| Construction (23) | 2,377 | 90.6 (9.1) | 57.8 | 965 | 91.3 (8.4) | 79.8 |
| Educational services (61) | 154 | 78.6 (8.5) | 8.4 | 233 | 84.2 (7.1) | 45.5 |
| Finance and insurance (52) | 14 | 78.0 (9.8) | 14.3 | 19 | 81.6 (5.4) | 26.3 |
| Health care and social assistance (62) | 94 | 80.8 (9.5) | 17.0 | 127 | 85.9 (8.7) | 56.7 |
| Information (51) | 434 | 86.0 (8.1) | 35.2 | 277 | 89.4 (7.2) | 77.3 |
| Management of companies and enterprises (55) | 4 | 90.5 (3.2) | 25.0 | 0 | - | - |
| Manufacturing (31–33) | 82,456 | 88.9 (7.9) | 51.7 | 49,157 | 92.0 (6.4) | 87.9 |
| Mining, quarrying, and oil & gas extraction (21) | 86 | 89.2 (6.7) | 54.7 | 38 | 93.3 (3.5) | 97.4 |
| Other services (except public administration) (81) | 1,779 | 85.8 (9.2) | 35.4 | 1,591 | 89.4 (7.3) | 76.4 |
| Professional, scientific and technical services (54) | 699 | 86.6 (9.6) | 42.4 | 489 | 88.5 (8.5) | 69.7 |
| Public administration (92) | 424 | 84.2 (9.5) | 32.3 | 494 | 88.3 (8.2) | 69.8 |
| Real estate rental and leasing (53) | 111 | 86.9 (9.6) | 43.2 | 80 | 87.7 (7.6) | 71.3 |
| Retail trade (44–45) | 1,186 | 85.0 (9.0) | 32.2 | 1,154 | 88.3 (8.1) | 71.3 |
| Transportation and warehousing (48–49) | 946 | 85.3 (10.2) | 36.3 | 834 | 87.6 (8.0) | 66.2 |
| Utilities (22) | 165 | 83.2 (8.2) | 20.6 | 137 | 86.4 (7.3) | 61.3 |
| Wholesale trade (42) | 1,438 | 87.8 (8.5) | 45.4 | 1,174 | 90.8 (6.6) | 84.2 |
|
| ||||||
| Year Group | N | Mean (SD) | >90 dBA (%) | N | Mean (SD) | >85 dBA (%) |
|
| ||||||
| 1979–1984 | 41,720 | 90.8 (6.2) | 60.6 | 1,8322 | 94.2 (6.3) | 93.2 |
| 1985–1989 | 14,856 | 89.0 (8.2) | 52.2 | 13,865 | 93.0 (6.1) | 91.2 |
| 1990–1994 | 9,736 | 86.8 (8.8) | 41.1 | 10,283 | 91.9 (6.6) | 88.1 |
| 1995–1999 | 6,248 | 86.6 (9.2) | 41.6 | 7,082 | 91.1 (6.9) | 83.5 |
| 2000–2004 | 8,114 | 86.0 (9.3) | 38.7 | 9,469 | 90.8 (6.7) | 83.5 |
| 2005–2009 | 8,402 | 85.7 (9.3) | 36.5 | 9,879 | 90.7 (7.0) | 82.1 |
| 2010–2013 | 4,844 | 85.1 (9.5) | 32.7 | 5,663 | 89.8 (7.5) | 78.2 |
NAICS code 55 (Management of Companies and Enterprises) was excluded because there were too few measurements for modeling.
AL measurements only included for years 1983–1984.
Figure 1.
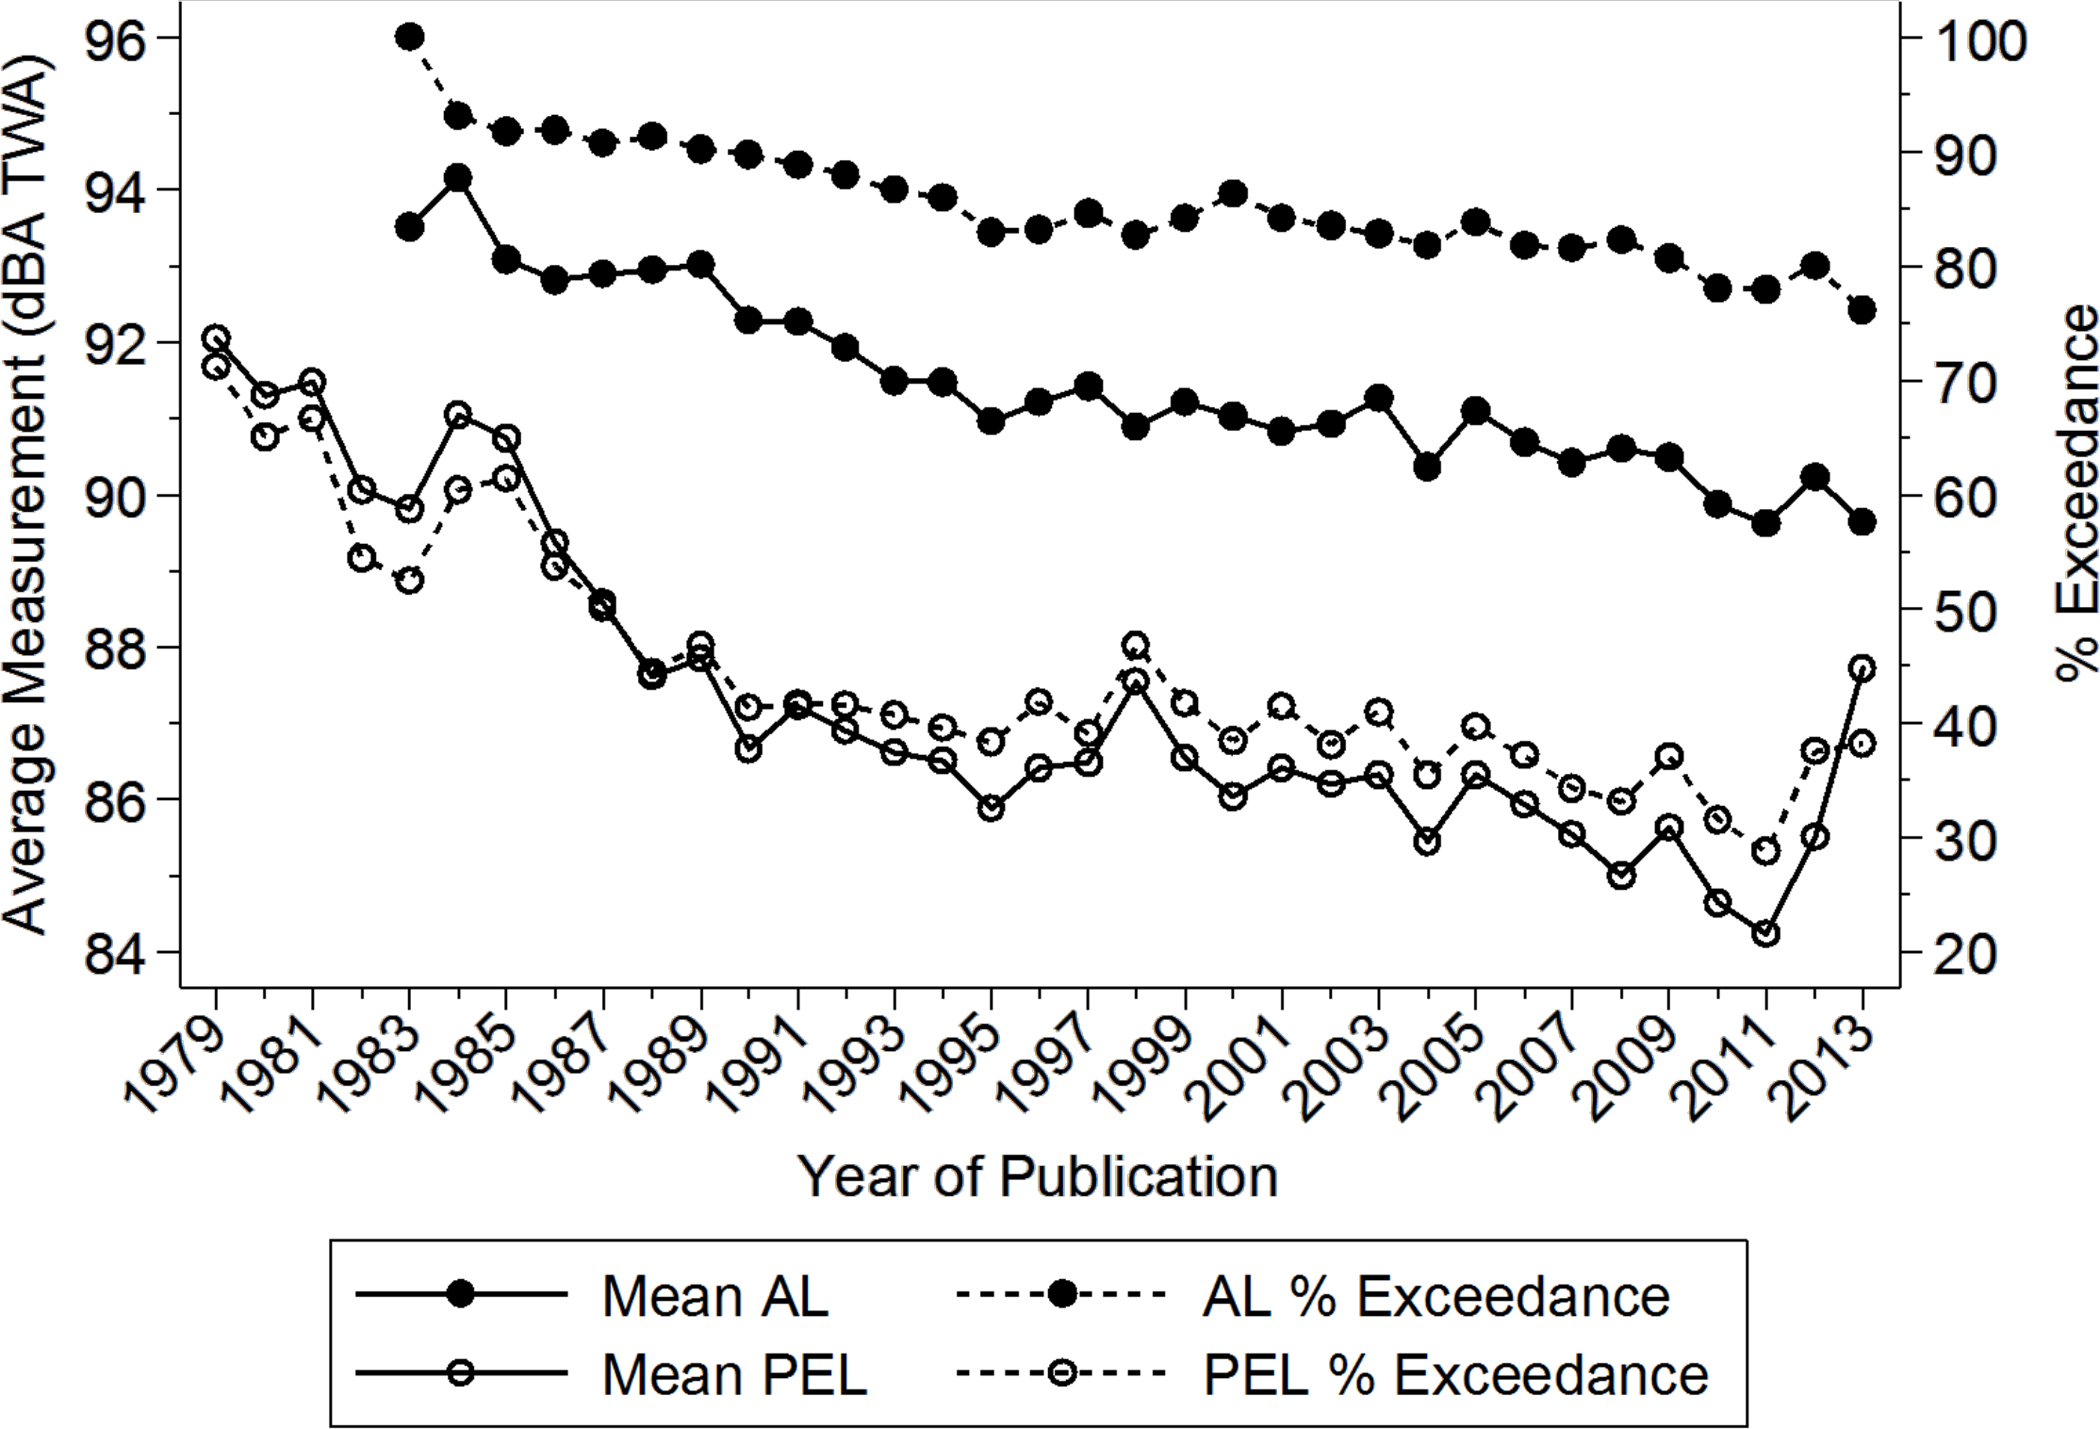
Time-weighted average (TWA) and exceedance of Permissible Exposure Limit (PEL, 90 dBA) and Action Level (AL, 85 dBA) for OSHA IMIS noise measurements by year (1979–2013).
Noise by Industry
Measurements were available for 24 different two-digit NAICS codes, which were reduced to 20 categories after collapsing the manufacturing, retail trade, and transportation and warehousing industries as previously described (Table 2). The manufacturing industry (NAICS 31–33) was overwhelmingly represented in the dataset, encompassing 87.8% of the PEL measurements and 84.6% of the AL measurements. The highest noise levels were found in the agriculture, forestry, fishing and hunting industry (NAICS 11) with a mean PEL level of 93.1 ± 6.8 dBA, and in the mining, quarrying, and oil and gas extraction industry (NAICS 21) with a mean AL level of 93.3 ± 3.5 dBA. The finance and insurance industry (NAICS 52) had the lowest PEL and AL measurements, 78.0 ± 9.8 and 81.6 ± 5.4 dBA, respectively, although these estimates are based on only 33 measurements taken over 35 years. Similarly, the management of companies and enterprises industry (NAICS 55) only had four full-shift noise measurements in the entire dataset. Almost 70% of AL measurements taken in the manufacturing sector exceeded 90 dBA (Table 2). Among the six industries with the largest number of measurements, the transportation and warehousing industry (NAICS 48–49) had the lowest mean AL and the second lowest mean PEL, along with the largest proportion of measurements under 85 dBA.
Regression Analysis
The results of the regression models are presented in Table 3. Both the PEL and AL models had poor model fit (R2ADJ=8.7% and 5.8%, respectively), which would be expected for a large dataset of exposure measurements from diverse industries. Using NAICS 52 (finance and insurance) and first five-year bin (1979–1984) as the reference levels (PEL=79.1 dBA, AL=84.6 dBA), all PEL and AL model coefficients were statistically significant, with the exception of the health care and social assistance (NAICS 62) and educational services (NAICS 61) industries. Coefficients for industry ranged from 3.0–15.9 dBA for the PEL (SE: 2.5–2.7 dBA) and 2.1–11.0 dBA for the AL (SE: 1.7–2.0 dBA), while five-year group coefficients and errors were significantly lower overall than industry coefficients (−1.8 through −5.6 dBA for PEL and −1.1 through −4.0 dBA for AL, SE: 0.1–0.2 dBA). The largest reductions in noise levels (i.e., differences in the negative slope coefficients by each year bin) occurred during earlier year groups, and decreases grew increasingly smaller with each subsequent year group for both PEL and AL (Table 3).
Table 3.
Linear regression model predicting mean OSHA noise level by measurement criteria (Permissible Exposure Limit [PEL] and Action Level [AL]) using two-digit NAICS industry code and year range as predictors for the years 1979–2013.
| PEL (R2
ADJ=8.7%) |
AL (R2
ADJ=5.8%) |
|||||
|---|---|---|---|---|---|---|
| NAICS two-digit Industry (Code)1 | β | SE | p | β | SE | p |
|
| ||||||
| Intercept | 79.1 | 2.5 | <0.001 | 84.6 | 1.7 | <0.001 |
| Finance and insurance (52) | Reference | Reference | ||||
| Accommodation and food services (72) | 7.8 | 2.5 | 0.002 | 4.7 | 1.8 | 0.007 |
| Administrative and support and waste management and remediation services (56) | 11.7 | 2.5 | <0.001 | 7.7 | 1.7 | <0.001 |
| Agriculture, forestry, fishing and hunting (11) | 15.9 | 2.5 | <0.001 | 10.5 | 1.8 | <0.001 |
| Arts, entertainment, and recreation (71) | 7.7 | 2.6 | 0.003 | 4.2 | 1.8 | 0.019 |
| Construction (23) | 14.9 | 2.5 | <0.001 | 9.5 | 1.7 | <0.001 |
| Educational services (61) | 3.0 | 2.6 | 0.240 | 2.1 | 1.8 | 0.243 |
| Health care and social assistance (62) | 3.8 | 2.6 | 0.151 | 3.2 | 1.8 | 0.079 |
| Information (51) | 8.6 | 2.5 | 0.001 | 7.0 | 1.8 | <0.001 |
| Manufacturing (31–33) | 11.8 | 2.5 | <0.001 | 9.7 | 1.7 | <0.001 |
| Mining, quarrying, and oil and gas extraction (21) | 13.3 | 2.7 | <0.001 | 11.0 | 2.0 | <0.001 |
| Other services (except public administration) (81) | 9.6 | 2.5 | <0.001 | 7.2 | 1.7 | <0.001 |
| Professional, scientific and technical services (54) | 10.2 | 2.5 | <0.001 | 5.4 | 1.7 | <0.001 |
| Public administration (92) | 8.7 | 2.5 | 0.001 | 6.4 | 1.7 | <0.001 |
| Real estate rental and leasing (53) | 12.4 | 2.6 | <0.001 | 5.1 | 1.9 | <0.001 |
| Retail trade (44–45) | 9.4 | 2.5 | <0.001 | 6.7 | 1.7 | <0.001 |
| Transportation and warehousing (48–49) | 8.7 | 2.5 | <0.001 | 5.3 | 1.7 | 0.002 |
| Utilities (22) | 6.7 | 2.6 | 0.009 | 4.2 | 1.8 | 0.021 |
| Wholesale trade (42) | 11.7 | 2.5 | <0.001 | 8.8 | 1.7 | <0.001 |
|
| ||||||
| Year Group | ||||||
|
| ||||||
| 1979–1984 | Reference | Reference | ||||
| 1985–1989 | −1.8 | 0.1 | <0.001 | −1.1 | 0.2 | <0.001 |
| 1990–1994 | −3.9 | 0.1 | <0.001 | −1.9 | 0.2 | <0.001 |
| 1995–1999 | −4.2 | 0.1 | <0.001 | −2.7 | 0.2 | <0.001 |
| 2000–2004 | −4.9 | 0.1 | <0.001 | −3.1 | 0.2 | <0.001 |
| 2005–2009 | −5.2 | 0.1 | <0.001 | −3.2 | 0.2 | <0.001 |
| 2010–2013 | −5.6 | 0.1 | <0.001 | −4.0 | 0.2 | <0.001 |
NAICS code 55 (Management of Companies and Enterprises) was excluded because there were too few measurements for modeling.
While overall noise levels generally decreased over time, when accounting for both time and industry, we observed a wide degree of variability by NAICS code (Figure 2). Some industries showed stable noise levels (e.g., PELs in the utilities and construction industries), while other industries had increasing noise levels over time (e.g., PELS in the agricultural industry, and ALs in the transportation and warehousing and utilities industries). Because the largest number of measurements were present in NAICS 31–33 (i.e. manufacturing) we conducted a sub-analysis to examine whether the observed decrease in noise levels in time was driven solely by the manufacturing industry or occurred across all industries (data not shown). The adjusted PEL model excluding NAICS 31–33, found that since the 1985 to 1989 year group there has not been a statistically significant decrease in noise levels. This is surprising given that the large number of measurements in the model would be expected to be overpowered and produce statistically significant results. By comparison, the AL model did not find a consentient decrease in noise levels over time when manufacturing industries were excluded.
Figure 2.
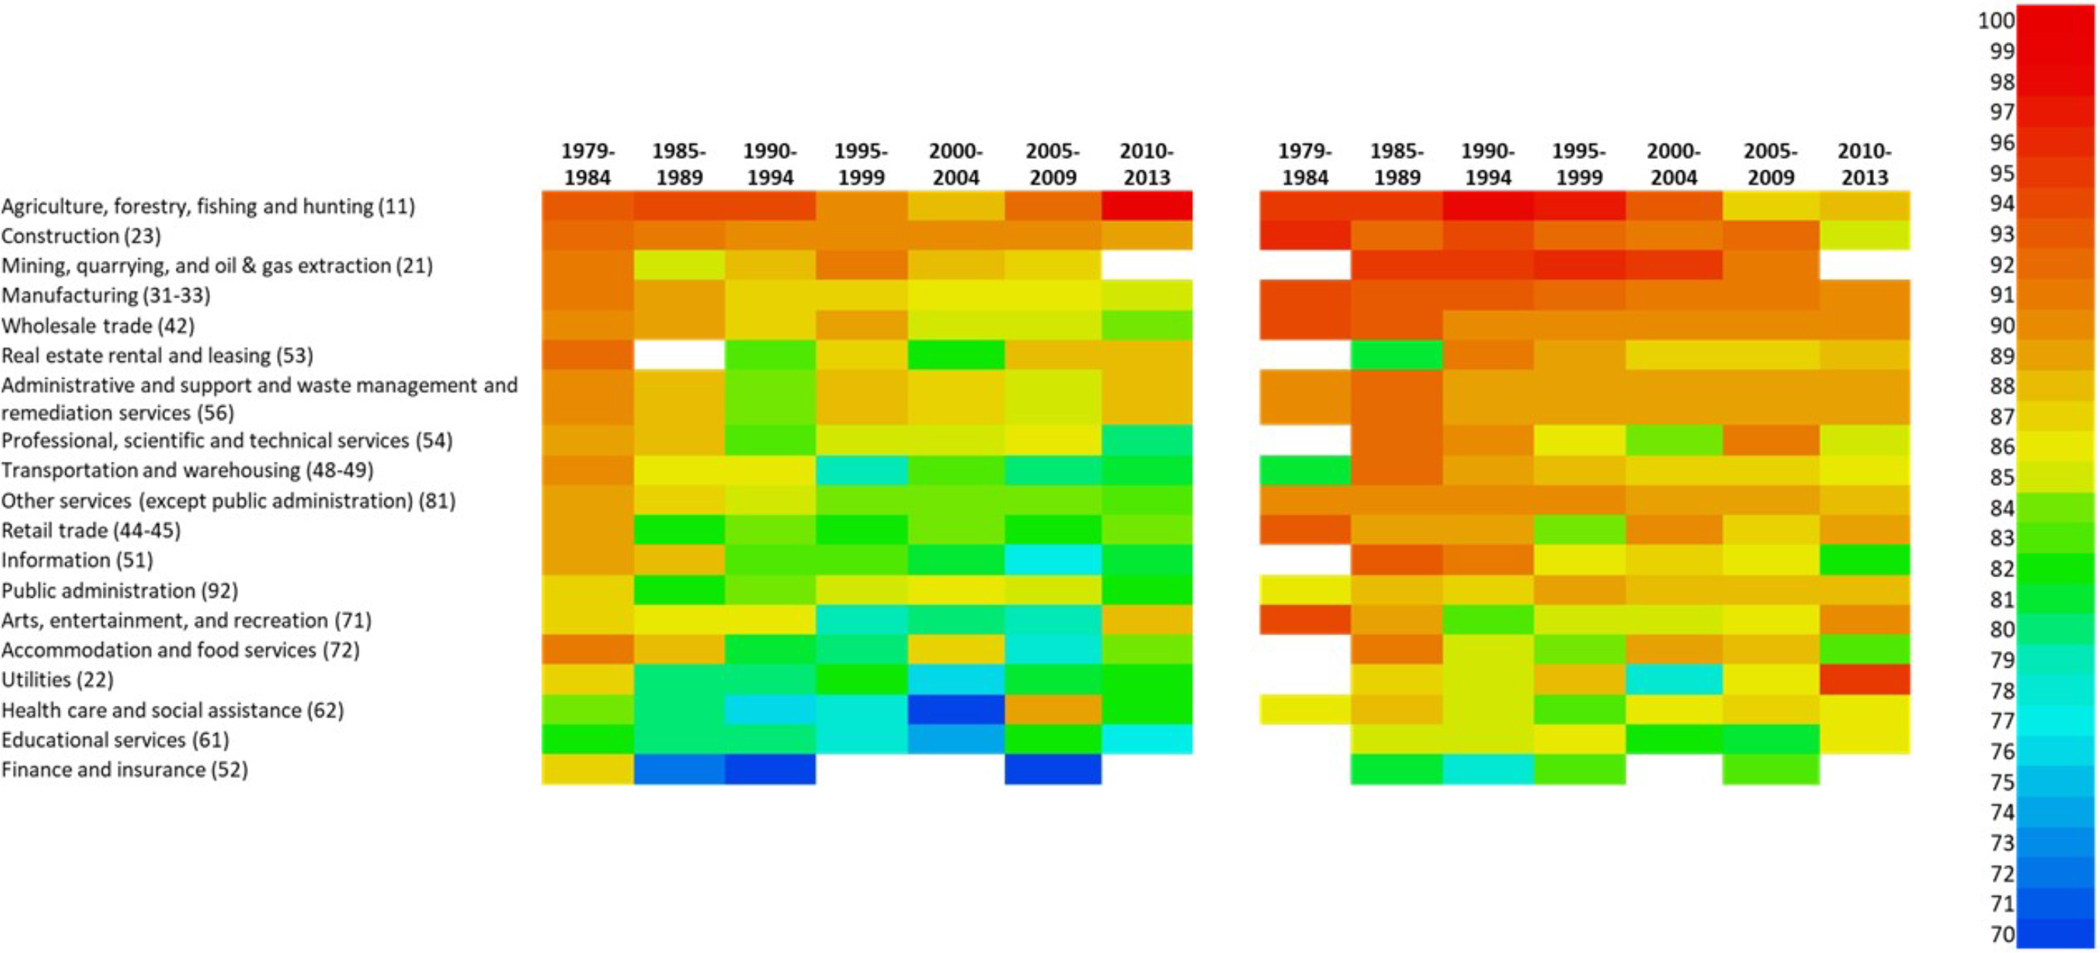
Gradient map illustrating the OSHA IMIS average noise time-weighted average (TWA, in dBA) for Permissible Exposure Limit (PEL, left) and Action Level (AL, right) by two-digit NAICS industry category and year range for the years 1979–2013, where white blocks indicate < 5 noise measurements. NAICS 55 (Management of Companies and Enterprises) excluded from figure due to small sample size.
Due to the large portion of data from the manufacturing industry, we also conducted the regression analysis using 3-digit NAICS code for measurements from manufacturing NAICS (31–33, Supplemental Table 3). Overall, the predicted measurements are very similar; however, this analysis allows one to distinguish between noise levels in different manufacturing environments. The explanatory power of the models (as measured by an adjusted-R2) increased slightly as well as would be expected when adding additional fixed effects to a model. When model fit (i.e. AIC) was compared between the corresponding models both the PEL and AL, models that included 3-digit NAICS codes for manufacturing had significantly better model fit than the models with only the 2-digit codes (ΔPEL = 3425.6; ΔAL = 1888.3).
Model validation
The difference between the 10th, 50th, and 90th percentiles of the predicted values from the PEL model developed from the training dataset are compared to the observed values from the holdout set in Supplemental Table 1. Ten out of 21 (4719 (52.6%) two-digit NAICS codes were found to have a 50th percentile difference greater than 2.0 dBA. All of the two-digit NAICS codes had a 10th percentile difference greater than 2.0 dBA while 14 (73.6%) had 90th percentile that differed by more than 2.0 dBA. The difference between the 10th, 50th, and 90th percentiles of the predicted values from the AL model developed from the training dataset are compared to the observed values from the holdout dataset in Supplemental Table 2. Four out of 19 (21.1%) of the two-digit NAICS codes were found to have a 50th percentile difference greater than 2.0 dBA. Similar to the PEL model, all of the 10th percentile differences were greater than 2.0 dBA and 15 out of 19 (78.9%) of the 90th percentile differences were greater than 2.0 dBA. Model validation using 10-fold cross-validation as opposed to the hold out method on average, found slightly poorer agreement between the model predictions and the observed values (see Supplemental Tables 4–5). Additionally, validation of the models for PEL and AL that include 3-digit manufacturing codes using both the hold-out (Supplemental Tables 6–7, respectively) and 10-fold methods (Supplemental Tables 8–9, respectively) was performed and results are available in the supplementary tables.
DISCUSSION
Our study evaluated over 150,000 OSHA compliance noise measurements and found significant differences in noise exposures by industry and over time. We found differences in noise exposure trends over time within each industry, indicating that not all industries are benefitting from increasing awareness of noise controls and noise-related health effects. The manufacturing industry represented a large percentage of OSHA noise measurements (86.6%), which has also been observed in a study of the lead IMIS exposure data.[33] Given the decreasing number of workers in this industry over the time period assessed (1979–2013),[34] this suggests that OSHA compliance efforts regarding noise exposure may not be adequately targeted towards other noisy industries. Additionally, the large proportion of recent measurements that exceeded the PEL and AL (32.7% and 85.7%, respectively) indicate the continued need for surveillance and regulatory enforcement of noise exposure limits, as well as continued opportunities for noise control and abatement.
The model validation indicated that the PEL model was able to predict the median noise exposure within 2.0 dBA of the observed values for 11 out of 21 two-digit NAICS codes, while the AL model predicted the median noise exposure for 19 out of 21 two-digit NAICS codes. One likely reason for the difference in model performance is that AL measurements are more evenly spread out over the measurement period; while the PEL measurements are clustered in the earlier time groups. As indicated in Table 2, over 41,720 PEL measurements were made between 1979 and 1984 compared to just 1,832 AL measurements. Because noise levels were found to generally decrease over time (Figure 1), it would be expected that the large number of PEL measurements earlier in time would increase the variance of noise levels and lead to poorer agreement between the model estimates and hold out data. The increased discordance between the models’ estimates for the 10th and 90th percentile reflects the fact that the model predictions will cluster around a mean, while the holdout data does not. This indicates that while the models can be used to make fairly accurate predictions of the median exposure for a worker in a certain industry during a certain time period, the model predictions should not be used in place of personal noise monitoring.
The modeling performed after removing the manufacturing cohort demonstrates that a large degree of the reduction in occupational noise measurements over time in the OSHA IMIS database may be the result of reductions of noise levels in the manufacturing industry. Figure 2 illustrates that some industries (e.g., utilities and construction) appear to have minimal reductions in noise levels over time, and some even have apparent increases (e.g., transportation and warehousing and agricultural industries). These results are consistent with those found by Middendorf in his earlier assessment of OSHA compliance noise levels,[22] as well as evaluations of noise levels in construction [23] and manufacturing.[24] This is of particular concern, since the prevalence of NIHL in many industries remains high (agriculture, forestry, fishing, and hunting: 11.1%, construction: 16.3%, manufacturing: 13.7%, transportation, warehousing, and utilities: 7.9%).[35]
Trends in employment must be considered when reviewing these results. For example, the US construction industry represented approximately 5,933,000 workers at the end of 2013, and that number has been generally increasing since 1979. By comparison, the number of manufacturing workers in the US decreased markedly over that same time period, and represented about 12,083,000 workers at the end of 2013.[34] Therefore, although the construction industry workforce was approximately half the size of the manufacturing workforce in 2013, it only represented 3% of the measurements taken that year, compared with 83% for manufacturing. Similar disparities in the IMIS database related to rates of noise sampling and NIHL as well as employment numbers were also noted by Middendorf for the years 1979–1999.[22]
LIMITATIONS
Although the dataset analyzed was large, over 40,000 measurements (21%) received from the OSHA IMIS system were removed prior to analysis. Additionally, the number of measurements obtained from our FOIA request was smaller than the number of noise measurements received by Middendorf (193,275 vs. 209,750, respectively).[22] This resulted in a similar number of measurements as those analyzed by Middendorf [22], although our study covered additional years of OSHA compliance measurements for noise. While we received fewer measurements, our averages across many of the fields were consistent with those found by Middendorf, who also found low levels in the retail, transportation, and finance industries, and comparably high levels in construction and mining.[22] Unfortunately, we were not able to identify the cause of differences between the noise dataset we received from OSHA and that received by Middendorf from a prior FOIA request, and the large discrepancy is problematic and requires further correspondence with OSHA in order to determine if data cleaning is currently done prior to the release of the FOIA data which was not completed in the past. Additionally, our FOIA request contained no information on geographical region, size of establishment, or union presence, which may have been useful in further assessing reasons for excessive noise exposure in certain industries. This is likely one of the reasons for the poor reported model fit. In addition, the decision to reduce industry specificity by using the 2-digit NAICS codes in order to maximize the number of measurements within each NAICS group is likely another source of poor model fit. Finally, by not including fixed effects for job title or job task there is a significant amount of relevant information that is not included in the model.
Aside from receiving fewer cases, our data cleaning methods, and specifically our elimination of measurements <6 hours in duration, reduced the number of measurements available for industries that may rely more heavily on short-term, task-based noise monitoring (e.g., construction). We believe our approach is valid, since it is not appropriate to compare task-based measurements to 8-hour exposure limits, as task-based exposure predictions can introduce substantial error into noise exposure estimates.[36] However, this approach may have yielded non-random bias, where industries that rely heavily on task-based monitoring for certain jobs contained an over-sampling of jobs where full-shift monitoring is more frequently performed. These industries may also have a reduced number of measurements overall where task-based noise monitoring is more heavily utilized by OSHA inspectors.
The sampling strategy used by OSHA compliance officers to collect the OSHA IMIS data analyzed here adds a degree of uncertainty to our results. While the specific sampling strategy employed for capturing these noise measurements is not known due to the limitations of the FOIA request, previous research on chemicals suggests that IMIS measurements likely represent worst-case exposures that are not typical of the overall industry.[33,37,38] However, worst-case monitoring provides valuable information regarding the top percentiles of noise-exposed workers, as these individuals are those most likely to be affected by NIHL and other adverse noise-related health outcomes. Research on chemical compounds has additionally noted significant under-reporting in the IMIS database, and many regard the IMIS data as not representative exposure of the working population in the US.[39] The research team attempted to address this issue statistically through the inclusion of modelling validation across the distribution of exposures (10th, 50th, and 90th percentiles). Non-random bias may also exist in OSHA inspection and sampling practices temporally, where jobs or industries are specifically targeted due to government initiatives or public interest at the time. Additionally, measurement criteria is determined at the inspector’s discretion (PEL vs. AL) and is likely based on perceived noise values and noise monitoring equipment settings, and may contribute to random or non-random bias in the data set.
CONCLUSIONS
Although our analysis indicated overall reductions in measured OSHA compliance noise levels over time, these reductions appear to be driven by the manufacturing industry, which represents a disproportionately large number of the OSHA IMIS noise measurements. While the exposure reductions in the manufacturing industry are significant and should not be ignored, additional OSHA noise monitoring appears to be warranted in other industries with high rates of NIHL and a large number of employed workers (e.g., construction).
Supplementary Material
KEY MESSAGES.
What is already known about the subject?
Noise is one of the most common environmental and occupational exposures which results in high rates of noise-induced hearing loss (NIHL) and other adverse, systemic health effects in exposed populations. The Occupational Safety and Health Administration (OSHA) has established a 90 dBA Permissible Exposure Limit (PEL) and an 85 dBA Action Level (AL) for noise exposure, and maintains the Integrated Management Information System (IMIS) database of PEL and AL compliance measurements for regulated industries. Previous research on this large dataset has shown a decrease in noise levels over time, but varying trends in noise exposure by industry.
What are the new findings?
Although our analysis indicated overall reductions in measured OSHA compliance noise levels over time, these reductions appear to be driven by the manufacturing industry, which represents a disproportionately large number of the OSHA IMIS noise measurements.
How might this impact policy or clinical practice in the foreseeable future?
Our research suggests that further reductions in occupational exposure to noise across all industries may be necessary to reduce noise exposures to levels below which workers are at an increased risk of NIHL. Additionally, we suggest OSHA monitoring that encompasses a broader range of industries, outside of manufacturing, and performing sampling on the basis of current employment trends.
AKCKNOWLEDGEMENTS, COMPETING INTERESTS, & FUNDING
This study was funded by the National Institute for Occupational Safety and Health, grant number R21OH0 10482: Development of a US/Canadian Job Exposure Matrix (JEM) for Noise. The authors report no conflict of interest.
REFERENCES
- [1].EPA. Information on levels of environmental noise requisite to protect public health and welfare with an adequate margin of safety. EPA Report 550/9–74–004 1974.
- [2].WHO. Guidelines for Community Noise. In: Berglund B, T. L, Schwela D, editors., Geneva: World Health Organization; 1999. [Google Scholar]
- [3].NIOSH. Criteria for a Recommended Standard: Occupational Noise Exposure, Revised Criteria 1998. 1998:105. [Google Scholar]
- [4].Nelson D, Nelson R, Concha-Barrientos M, Fingerhut M. The global burden of occupational noise-induced hearing loss. Am J Ind Med 2005;48:446–58. [DOI] [PubMed] [Google Scholar]
- [5].Dobie R Economic compensation for hearing loss. Occup Med 1995;10:663–8. [PubMed] [Google Scholar]
- [6].Neitzel RL, Swinburn TK, Hammer MS, Eisenberg D. Economic Impact of Hearing Loss and Reduction of Noise-Induced Hearing Loss in the United States. J Speech Lang Hear Res 2017;60:182–9. doi: 10.1044/2016_JSLHR-H-15-0365. [DOI] [PubMed] [Google Scholar]
- [7].Tufts JB, Weathersby PK, Rodriguez FA. Modeling the Unites States government’s economic cost of noise-induced hearing loss for a military population. Scand J Work Env Heal 2010;36:242–9. [DOI] [PubMed] [Google Scholar]
- [8].WHO. Prevention of Noise-Induced Hearing Loss: Report of an Informal Consultation Held at the World Health Organization. Geneva: 1997.
- [9].Sataloff R, Sataloff J. Occupational Hearing Loss. 3rd ed. New York: Taylor and Francis; 1996. [Google Scholar]
- [10].Gan W, Davies H, Demers P. Exposure to occupational noise and cardiovascular disease in the United States: the National Health and Nutrition Examination Survey 1999–2004. Occup Env Med 2011;68:183–90. [DOI] [PubMed] [Google Scholar]
- [11].Virkkunen H, Kauppinen T, Tenkanen L. Long-term effect of occupational noise on the risk of coronary heart disease. Scand J Work Env Heal 2005;31:291–9. [DOI] [PubMed] [Google Scholar]
- [12].Katsouyanni K, Cadum E, Dudley, Marie-Louise Savigny P, Seiffert I, Al E. Hypertension and exposure to noise near airports: the HYENA study. Env Heal Perspect 2008;116:329–33. [DOI] [PMC free article] [PubMed] [Google Scholar]
- [13].Bluhm G, Berglind N, Nordling E, Rosenlund M. Road traffic noise and hypertension. Occup Env Med 2007;64:122–6. [DOI] [PMC free article] [PubMed] [Google Scholar]
- [14].Ising H, Babisch W, Kruppa B, Lindthammer A, Wiens D. Subjective work noise: a major risk factor in myocardial infarction. Soz Praventivmed 1997;42:216–22. [DOI] [PubMed] [Google Scholar]
- [15].Selander J, Nilsson ME, Bluhm G, Rosenlund M, Lindqvist M, Nise G, et al. Long-term exposure to road traffic noise and myocardial infarction. Epidemiology 2009;20:272–9. [DOI] [PubMed] [Google Scholar]
- [16].Passchier-Vermeer W, Passchier WF. Noise Exposure and Public Health. Environ Heal Perspect 2000;108:123–31. [DOI] [PMC free article] [PubMed] [Google Scholar]
- [17].Seidman MD, Standring RT. Noise and quality of life. Int J Environ Res Public Health 2010;7:3730–8. doi: 10.3390/ijerph7103730. [DOI] [PMC free article] [PubMed] [Google Scholar]
- [18].Lercher P, Evans G, Meis M, Kofler W. Ambient neighbourhood noise and children’s mental health. Occup Env Med 2002;59:380–6. [DOI] [PMC free article] [PubMed] [Google Scholar]
- [19].Hammer MS, Swinburn TK, Neitzel RL. Environmental Noise Pollution in the United States: Developing an Effective Public Health Response. Environ Health Perspect 2014;122:115–9. doi: 10.1289/ehp.1307272. [DOI] [PMC free article] [PubMed] [Google Scholar]
- [20].CDC. Prevalence of heart disease--United States. MMWR Morb Mortal Wkly Rep 2007;56:113–8. [PubMed] [Google Scholar]
- [21].OSHA. Occupational Noise Exposure: Hearing Conservation Amendment; Final Rule. Fed Reg 1983;48:9738–85. [Google Scholar]
- [22].Middendorf PJ. Surveillance of occupational noise exposures using OSHA’s Integrated Management Information System. Am J Ind Med 2004;46:492–504. doi: 10.1002/ajim.20092. [DOI] [PubMed] [Google Scholar]
- [23].Neitzel RL, Stover B, Seixas NS. Longitudinal assessment of noise exposure in a cohort of construction workers. Ann Occup Hyg 2011;55:906–16. doi: 10.1093/annhyg/mer050. [DOI] [PMC free article] [PubMed] [Google Scholar]
- [24].Neitzel R, Galusha D, Dixon-Ernst C, Rabinowitz P. Methods for evaluating temporal trends in noise exposure. Int J Audiol 2014;53 Suppl 2:S76–83. doi: 10.3109/14992027.2013.857438. [DOI] [PMC free article] [PubMed] [Google Scholar]
- [25].Office of Management and Budget. 2007 North American Industry Classification System (NAICS) - Updates for 2012. National Archives and Records Administration; 2009. [Google Scholar]
- [26].US Census Bureau. North American Industry Classification System Concordances n.d. https://www.census.gov/eos/www/naics/concordances/concordances.html.
- [27].Roberts B, Sun K, Neitzel RL. What can 35 years and over 700,000 measurements tell us about noise exposure in the mining industry? Int J Audiol 2017;56:4–12. doi: 10.1080/14992027.2016.1255358. [DOI] [PMC free article] [PubMed] [Google Scholar]
- [28].Kohavi R A study of cross-validation and bootstrap for accuracy estimation and model selection. Int Jt Conf Artif Intell 1995. [Google Scholar]
- [29].Arlot S, Celisse A. A survey of cross-validation procedures for model selection. Stat Surv 2010;4:40–79. doi: 10.1214/09-SS054. [DOI] [Google Scholar]
- [30].Gelman A P Values and Statistical Practice. Epidemiology 2013;24:69–72. doi: 10.1097/EDE.0b013e31827886f7. [DOI] [PubMed] [Google Scholar]
- [31].ANSI. ANSI S1.4–1-2014 Electroacoustics - Sound Level Meters - Part 1: Specifications 2014.
- [32].OSHA. Chapter VI - Noise Survey Data. OSHA Ind. Hyg. Tech. Manual, OSHA Instr. CPL 2–2.20A, Washington DC: Office of Health Compliance Assistance, US DOL, Occupational Safety and Health Administration; 1984. [Google Scholar]
- [33].Henn SA, Sussell AL, Li J, Shire JD, Alarcon WA, Tak S. Characterization of lead in US workplaces using data from OSHA’s integrated management information system. Am J Ind Med 2011;54:356–65. doi: 10.1002/ajim.20926. [DOI] [PubMed] [Google Scholar]
- [34].Bureau of Labor Statistics. Employment, hours, and earnings from the current employment statistics survey (national). US Dep Labor n.d. https://data.bls.gov/pdq/SurveyOutputServlet (accessed October 5, 2017). [Google Scholar]
- [35].Masterson EA, Bushnell PT, Themann CL, Morata TC. Hearing Impairment Among Noise- Exposed Workers — United States, 2003–2012. Cent Dis Control Prev Morb Mortal Wkly Rep 2016;65:389–405. doi: 10.1111/j.1468-0009.2011.00648.x. [DOI] [PubMed] [Google Scholar]
- [36].Seixas NS, Sheppard L, Neitzel R. Comparison of Task-Based Estimates With Full-Shift Measurements of Noise Exposure. AIHA J 2003;64:823–9. doi: 10.1080/15428110308984878. [DOI] [PubMed] [Google Scholar]
- [37].Hamm MP, Burstyn I. Estimating Occupational Beryllium Exposure from Compliance Monitoring Data. Arch Environ Occup Health 2011;66:75–86. doi: 10.1080/19338244.2010.511309. [DOI] [PubMed] [Google Scholar]
- [38].Sarazin P, Burstyn I, Kincl L, Lavoué J. Trends in OSHA Compliance Monitoring Data 1979–2011: Statistical Modeling of Ancillary Information across 77 Chemicals. Ann Occup Hyg 2016;60:432–52. doi: 10.1093/annhyg/mev092. [DOI] [PubMed] [Google Scholar]
- [39].Lavoue J, Friesen M, Burstyn I. Workplace Measurements by the US Occupational Safety and Health Administration since 1979: Descriptive Analysis and Potential Uses for Exposure Assessment. Ann Occup Hyg 2013;57:77–97. doi: 10.1093/annhyg/mes055. [DOI] [PMC free article] [PubMed] [Google Scholar]
Associated Data
This section collects any data citations, data availability statements, or supplementary materials included in this article.