

Abstract
Given the prevalence of cardiovascular diseases (CVDs), the segmentation of the heart on cardiac computed tomography (CT) remains of great importance. Manual segmentation is time-consuming and intra-and inter-observer variabilities yield inconsistent and inaccurate results. Computer-assisted, and in particular, deep learning approaches to segmentation continue to potentially offer an accurate, efficient alternative to manual segmentation. However, fully automated methods for cardiac segmentation have yet to achieve accurate enough results to compete with expert segmentation. Thus, we focus on a semi-automated deep learning approach to cardiac segmentation that bridges the divide between a higher accuracy from manual segmentation and higher efficiency from fully automated methods. In this approach, we selected a fixed number of points along the surface of the cardiac region to mimic user interaction. Points-distance maps were then generated from these points selections, and a three-dimensional (3D) fully convolutional neural network (FCNN) was trained using points-distance maps to provide a segmentation prediction. Testing our method with different numbers of selected points, we achieved a Dice score from 0.742 to 0.917 across the four chambers. Specifically. Dice scores averaged 0.846 ± 0.059, 0.857 ± 0.052, 0.826 ± 0.062, and 0.824 ± 0.062 for the left atrium, left ventricle, right atrium, and right ventricle, respectively across all points selections. This point-guided, image-independent, deep learning segmentation approach illustrated a promising performance for chamber-by-chamber delineation of the heart in CT images.
Keywords: Heart, cardiovascular diseases, computed tomography (CT), image segmentation, deep learning
INTRODUCTION
Medical imaging has played an integral role in the diagnosis and treatment of cardiovascular diseases (CVDs), with modern techniques such as computed tomography (CT), magnetic resonance imaging (MRI), and ultrasound being widely used. These methods offer non-invasive quantitative and qualitative information of cardiac anatomy and physiology.1
Image segmentation of the heart offers a useful application for aiding in diagnosis. Measures such as myocardial mass, wall thickness, chamber volume, ventricle ejection fraction (EF), etc. can be extracted after segmentation. Clinically, cardiac images, including CT, are usually segmented by an expert radiologist. Different segmentation methods have been applied to automate the process. Deep learning has risen as a popular technique for cardiac segmentation by using a convolutional neural network (CNN) to segment two-dimensional (2D) or three-dimensional (3D) cardiac images.2,3,4 In general, 3D segmentation is comparatively more complicated than 2D segmentation1. However, 3D segmentation yields the benefit of providing more accurate volume-related metrics.1 Additionally, both fully automated and semi-automated segmentation methods have been utilized5. Semi-automated methods offer a middle ground between fully automated and manual segmentation by maintaining a higher accuracy while preserving efficiency, time, and labor.
Previous deep learning studies have been conducted to segment cardiac images. Li et. al6 used an 8-layer residual U-Net with deep supervision for left ventricle segmentation of cardiac CT images. Morris et. al7 applied a 3D U-Net architecture to segment all four myocardial chambers by utilizing MRI’s soft tissue contrast and coupling it with CT imaging. While both methods achieved a high segmentation accuracy, the use of a semi-automated approach gives the physician more flexibility and control over the model’s segmentation by allowing them to interact with the segmentation process.8
In this study, we attempt to accurately segment 3D cardiac CT images semi-automatically by utilizing a fixed number of points information that is randomly distributed on the surface of the region of interest. The randomly selected input points are mimicking a user interaction in this study. Our novel method of utilizing points information for semi-automated segmentation introduces the prospect of giving the physician input over the model’s segmentation by allowing them to determine the points information that the model uses. Additionally, it reduces labor and time costs while improving ease of use compared to the clinical gold standard of manual segmentation.
MATERIALS AND METHODS
2.1. Data
Our dataset contained 64 3D cardiac CT scans from 64 patients. Each image consisted of 46 to 172 2D transverse slices. The area of each slice was originally 512 × 512 pixels. All 64 images underwent preprocessing steps to remove some background portions of the image. Gold standard segmentations were provided by an expert radiologist. All the images were acquired and used under the IRB-approved protocols.
2.2. Preprocessing
All the 3D volumes were first zero-padded to a size of 192 slices per image to maintain a consistent slice number across the dataset. Then, each slice was cropped from 512 × 512 pixels to 384 × 384 pixels to remove some background pixels. Next, the images were down-sampled by a factor of 3 to reduce the total memory occupied by the data while training and testing. After all the preprocessing steps, the final size of each 3D image was 128 × 128 × 64.
Following the preprocessing of each image, a fixed number of randomly distributed points were selected along the myocardial chamber’s surface. For each 3D image, four binary volumes of the points were generated (one per chamber). To improve the model’s recognition and visibility of the points, a points-distance map of each image was generated as well. In the points-distance map, each pixel where a point was present was given a value of zero. Pixels, where points were not located, were given values based on their Euclidian distance from the nearest point. This final points-distance map based on the points selection was used as input data for the model. Points-distance maps were generated for each CT image. Figure 2 shows 2D slices of four points-distance maps of all four chambers as a sample case.
Figure 2.
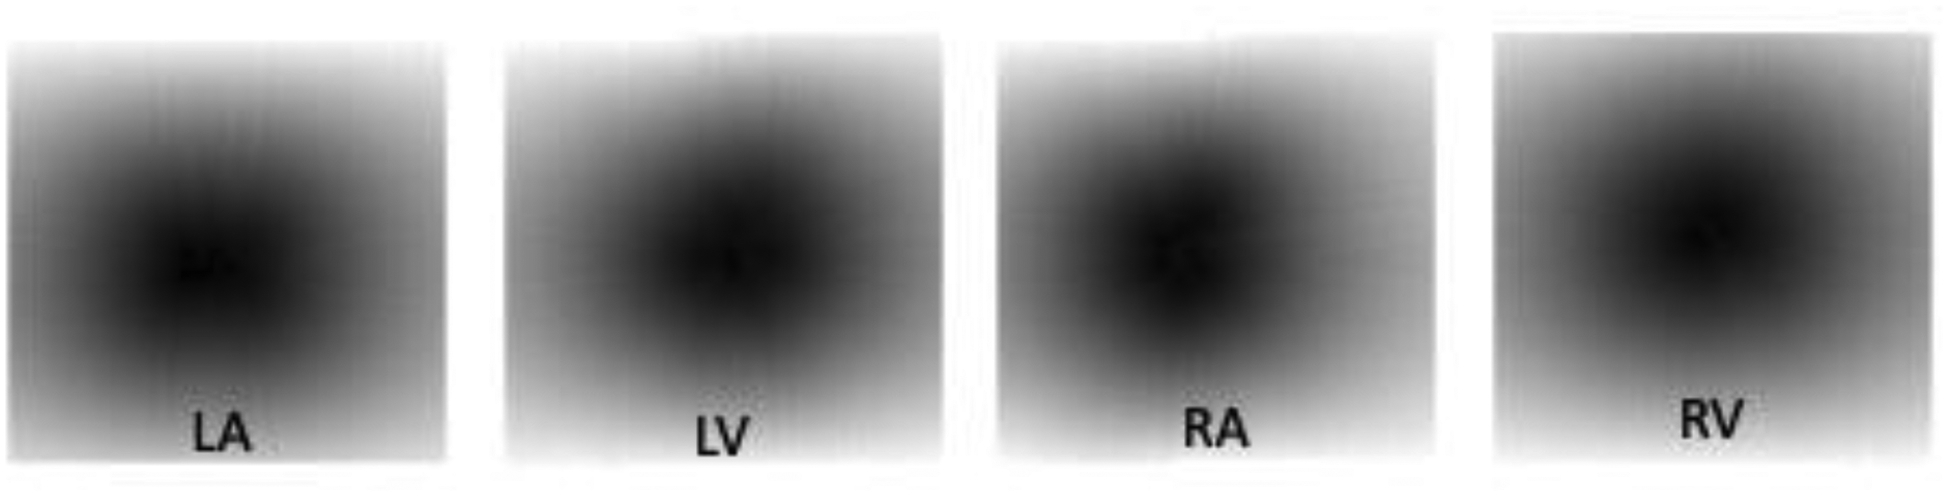
Points-distance maps for each chamber for a single CT slice.
Data augmentation of the images was performed by generating 10 repetitions of random points selections for each image. Thus, for each image, 10 points-distance maps were generated. A total of 640 points-distance maps were generated out of the 64 3D cardiac CT images.
2.3. Network Architecture
In this study, we used a customized version of U-Net9, a fully convolutional neural network (FCNN) based on a modified U-Net architecture. Figure 3 shows the structure of the four-level 3D-UNet architecture used to train the model. This network was based upon a previous similar study for 3D prostate segmentation.10 The inputs to train the network were the points-distance maps, and these were compared to ground-truth manual segmentation labels, which were used as the desired output during the training.
Figure 3.

Four-layer 3D U-Net architecture for the segmentation of four chambers of the heart on CT images.
2.4. Implementation details
We used TensorFlow11 and Keras libraries to implement the CNN models in Python on a high-performance computer containing 512 GB of memory and an NVIDIA TITAN Xp GPU. The 64 cardiac CT images were divided randomly into training (N=42), validation (N=6), and testing (N=16) sets. The network was trained for a total of 200 epochs. We trained a total of 24 models, with a separate model for each of the 4 cardiac regions trained using 6 different numbers of input points per image (i.e., 10, 15, 20, 30, 50, and 100 points). The network was optimized by first training the network on a prostate dataset used from a similar previous project and then using transfer learning to refine the model for the heart data. From this optimization, we decided to use the Adadelta12 optimizer with an initial learning rate of 0.1 and batch size of two. A loss function based on Dice similarity coefficient (DSC)13 was used to optimize the training of the network.14
2.5. Evaluation
The CNN performance evaluation was conducted using the Dice similarity coefficient.15 The network’s predictions for the validation and testing set were compared to the corresponding ground-truth manual segmentations. For each network prediction, a pixel-wise probability map was generated, and this was then used to generate a binary prediction based on a probability threshold of 0.5.
RESULTS
3.1. Training
The CNN was trained for a total of 200 epochs with the best model selected for testing based on the validation loss. The validation loss calculated based on Dice similarity coefficient achieved a final value of less than 0.25 for all 24 models. Furthermore, for each chamber, as the number of points selected on the surface was increased, the validation loss decreased.
3.2. Testing
The Dice score on the testing set for each highest-performing model ranged from 0.742 to 0.917, averaging a total Dice score of 0.839. Chamber-specific Dice scores averaged 0.846 ± 0.059, 0.857 ± 0.052, 0.826 ± 0.062, and 0.824 ± 0.062 for the LA, LV, RA, and RV respectively across all points selections. These scores also ranged from 0.776 to 0.917, 0.797 to 0.915, 0.744 to 0.900, and 0.742 to 0.901 for the LA, LV, RA, and RV respectively across all points selections. The range in testing performance was a result of the varying number of points used as inputs for the model. The models with 100 selected points performed notably better than the models with 10 points selected (see Table 1).
Table 1.
Test segmentation accuracy for 3D U-Net on all four myocardial chambers in terms of DSC.
| No. of Points | ||||
|---|---|---|---|---|
| LA | LV | RA | RV | |
| 10 | 0.776 ± 0.059 | 0.797 ± 0.06 | 0.744 ± 0.046 | 0.742 ± 0.053 |
| 15 | 0.811 ± 0.046 | 0.827 ± 0.038 | 0.783 ± 0.042 | 0.792 ± 0.043 |
| 20 | 0.836 ± 0.03 | 0.844 ± 0.036 | 0.816 ± 0.034 | 0.81 ± 0.034 |
| 30 | 0.851 ± 0.027 | 0.866 ± 0.023 | 0.846 ± 0.027 | 0.833 ± 0.026 |
| 50 | 0.886 ± 0.024 | 0.889 ± 0.017 | 0.869 ± 0.025 | 0.864 ± 0.021 |
| 100 | 0.917 ± 0.014 | 0.915 ± 0.013 | 0.9 ± 0.022 | 0.901 ± 0.016 |
| Average | 0.846 ± 0.059 | 0.857 ± 0.052 | 0.826 ± 0.062 | 0.824 ± 0.062 |
Similar to the validation results, the testing results demonstrate that as the number of points selected was increased, the segmentation accuracy increased, as shown in Figure 5. Across all the four chambers, the testing Dice score increased as the model had more information to make a segmentation prediction.
Figure 5:

DSC scores of each model on the testing dataset plotted against the number of points selected. The plot indicates that as the number of points was increased, the model’s accuracy improved.
DISCUSSION AND CONCLUSIONS
We proposed a new, clinically viable method for cardiac segmentation of CT images. Previous methods utilize the whole 3D cardiac CT images to segment, which can be time-consuming and require large amounts of computing power. Moreover, the automatic segmentation approaches are not accurate enough to be used for clinical assessments with no post-segmentation editing. However, we demonstrated that only points information from the region of interest could be used to segment the chambers with an accuracy comparable to the manual segmentation when enough points are selected. To the best of our knowledge, this image-independent, deep learning-based method for segmentation has not been performed before on cardiac CT images.
Our highest performing models with more points selected (50 to 100 points per chamber) are comparable to previously published results by Dormer et. al15 on the same dataset using deep CNN for cardiac CT segmentation. They achieved an overall chamber accuracy of 0.856 ± 0.061. We achieve similar results without using the images as CNN inputs, rather using only a random selection of points on the borders. Using the original U-Net, Li et. al6 achieved a Dice similarity coefficient of 0.878 ± 0.230 for left ventricle segmentation. Using input points information rather than the entire image information, resulted in improvements to the segmentation accuracy when at least 50 points were selected. While our method showed increased performance by using only points randomly selected from the ground truth, in clinical practice, the tradeoff between performance and point selection is limited by the practitioner’s level of input time and quality of point selection. For example, the physician may select fewer, but more relevant points than our randomly distributed points. The selection of highly relevant points may reduce the required number of points for accurate segmentation. Further training and testing must be done to benchmark the performance tradeoff with various labor and time costs in a clinical setting.
A similar tradeoff exists for including whole image information and computational efficiency. While we mentioned that an entire input image requires a large amount of computational power, we also recognize important information is provided by a full image. Because the only input data for the network is the points-distance map based on the points selection, the results may be constrained by a lack of additional information provided by the full CT image. In the future, we will consider training the network by using both the points-distance maps and whole CT images as input to improve the segmentation accuracy and compare the results to other studies that use images as input.
Furthermore, another potential improvement to increase the clinical viability of this segmentation approach is to apply this approach to all four chambers of the myocardium simultaneously. Specifically, this requires integrating the points-based information of all four myocardial chambers into a singular network to conduct a multi-class segmentation of all four chambers. This approach would provide several benefits. For example, it could improve the accuracy of the model because the CNN would be able to utilize information from all four points-distance maps to formulate a prediction, rather than rely on a singular points-distance map. Moreover, it will be more efficient and clinically applicable to train one singular model for the segmentation of the images.
Figure 1.

A 2D transverse slice of an original CT image (left) and reference standard segmentations for the left atrium (LA), left ventricle (LV), right ventricle (RV), and right atrium (RA) (right).
Figure 4.

High-performing and low-performing qualitative segmentation results for one slice of an image for the LA, LV, RA, and RV from left to right. The model segmentation (blue) is compared to the ground-truth segmentation (red). Each patient number is denoted on the left of the figure with the corresponding average Dice score for the four segmentations.
ACKNOWLEDGMENTS
This research was supported in part by the U.S. National Institutes of Health (NIH) grants (R01CA156775, R01CA204254, R01HL140325, and R21CA231911) and by the Cancer Prevention and Research Institute of Texas (CPRIT) grant RP190588,
REFERENCES
- [1].Chen C, Qin C, Qiu H, Tarroni G, Duan J, Bai W, Rueckert D, “Deep Learning for Cardiac Image Segmentation: A Review,” Front. Cardiovasc. Med 7(25), (2020). [DOI] [PMC free article] [PubMed] [Google Scholar]
- [2].Luo C, Shi C, Li X, Gao D, “Cardiac MR segmentation based on sequence propagation by deep learning,” PloS one, 15(4), (2020). [DOI] [PMC free article] [PubMed] [Google Scholar]
- [3].Abdeltawab H, Khalifa F, Taher F, Alghamdi NS, Ghazal M, Beache G, Mohamed T, Keynton R, El-Baz A, “A deep learning-based approach for automatic segmentation and quantification of the left ventricle from cardiac cine MR images,” Computerized medical imaging and graphics, 81, 101717(2020). 10.1016/j.compmedimag.2020.101717 [DOI] [PMC free article] [PubMed] [Google Scholar]
- [4].Bruns S, Wolterink JM, Takx RAP, van Hamersvelt RW, Suchá D, Viergever MA, Leiner T, Išgum I, “Deep learning from dual-energy information for whole-heart segmentation in dual-energy and single-energy non-contrast-enhanced cardiac CT,” Med Phys, 47(10). 5048–5060(2020). [DOI] [PubMed] [Google Scholar]
- [5].Petitjean C, Dacher JN, “A review of segmentation methods in short axis cardiac MR images,” Medical Image Analysis, 15(2), 169–184(2011). [DOI] [PubMed] [Google Scholar]
- [6].Li C, Song X, Zhao H, Feng L, Hu T, Zhang Y, Jiang J, Wang J, Xiang J, “An 8-layer residual U-Net with deep supervision for segmentation of the left ventricle in cardiac CT angiography,” Comput Methods Programs Biomed, 200(105876), (2021). [DOI] [PubMed] [Google Scholar]
- [7].Morris E, Ghanem A, Dong M, Pantelic M, Walker E, Glide-Hurst C, “Cardiac substructure segmentation with deep learning for improved cardiac sparing,” Med Phys 47(2), 576–596(2020). [DOI] [PMC free article] [PubMed] [Google Scholar]
- [8].Habijan M, Babin D, Galić I et al. , “Overview of the Whole Heart and Heart Chamber Segmentation Methods,” Cardiovasc Eng Tech 11, 725–747(2020). [DOI] [PubMed] [Google Scholar]
- [9].Ronneberger O, Fischer P, and Brox T, “U-Net: Convolutional Networks for Biomedical Image Segmentation,” MICCAI, 234–241(2015). [Google Scholar]
- [10].Caughlin K, Shahedi M, Shaog J, Barbieri C, Margolis D, Fei B, “Three-dimensional prostate CT segmentation through fine-tuning of a pre-trained neural network using no reference labeling,” Proc. SPIE 11598, 115980L(2021). [DOI] [PMC free article] [PubMed] [Google Scholar]
- [11].Abadi M et al. , “TensorFlow: A system for large-scale machine learning,” OSDI, 265–283(2016). [Google Scholar]
- [12].Zeiler M, “ADADELTA: an adaptive learning rate method.” arxiv, 1212. 5701(2012) [Google Scholar]
- [13].Dice LR, “Measures of the amount of ecologic association between species,” Ecology, 26, 297–302(1945). [Google Scholar]
- [14].Shahedi M, Halicek M, Dormer J, Schuster D, Fei BW, “Deep learning-based three-dimensional segmentation of the prostate on computed tomography images,” J. Med. Imag 6(2), 025003(2019) [DOI] [PMC free article] [PubMed] [Google Scholar]
- [15].Shahedi M, Dormer J, T T A, Do D, Xi Y, Lewis M, Madhuranthakam A, Twickler D, Fei B, “Segmentation of uterus and placenta in MR images using a fully convolutional neural network.” Proc. SPIE 11314, 113141R(2020) [DOI] [PMC free article] [PubMed] [Google Scholar]
- [16].Dormer J, Ma L, Halicek M, Reilly C, Schreibmann. E, Fei B, “Heart chamber segmentation from CT using convolutional neural networks,” Proc. SPIE 10578, 105782S(2018). [DOI] [PMC free article] [PubMed] [Google Scholar]