

Abstract
In metazoans, the expression of key phenotypic traits is sensitive to two- and three-way interactions between variation in mitochondrial DNA, nuclear DNA and the external environment. Whether gene-by-environment interactions affect phenotypes in single-celled eukaryotes is poorly studied, except in a few species of yeast and fungi. We developed a genetic panel of the unicellular slime mould, Physarum polycephalum containing strains differing in mitochondrial and nuclear DNA haplotypes. The panel also included two strains harbouring a selfishly replicating mitochondrial-fusion (mF) plasmid that could affect phenotype expression. We assayed movement and growth rate differences among the strains across two temperature regimes: 24° and 28°C. We found that the slime mould's growth rate, but not movement, is affected by G × G × E interactions. Predictably, mtDNA × nDNA interactions significantly affected both traits. The inter-trait correlation across the strains in each temperature regime was positive. Surprisingly, the mF plasmid had no negative effects on our chosen traits. Our study is the first to demonstrate genetic regulation of phenotype expression in a unicellular slime mould. The genetic effect on phenotypes manifests via epistatic interactions with the thermal environment, thus shedding new light on the role of G × G × E interactions in trait evolution in protists.
Keywords: climatic selection, mitochondrial–nuclear interactions, mitonuclear ecology, organism functioning, pleiotropy, single-celled eukaryotes
1. Introduction
A key prediction of the mitonuclear ecology theory is that coevolution between mitochondrial DNA (mtDNA) and nuclear DNA (nDNA) encoded proteins is essential for organismal function [1]. In particular, the mitochondrial electron transport system (mETS) in metazoans depends on mitochondrial–nuclear (mitonuclear) coevolution because complexes I, III, IV and V (i.e. except II, which is mtDNA-encoded) of the mETS are made of enzymes encoded by nDNA and mtDNA [2–4]. Consequently, errors in mitonuclear protein interactions negatively affect mETS function [5] and are known to affect whole-organism physiology and life history in bilaterians [6–9] and fertility in plants [10]. Furthermore, theory predicts that coevolved mitonuclear alleles must match the environment in which they are expressed to optimize phenotype function [11]. Environmental influences on mitonuclear interactions include temperature [12], diet [13] and hypoxia [14]. Of particular relevance to our study is the thermal sensitivity of key enzymes involved in the mETS [15,16]. In some metazoans, studies have mapped the thermal sensitivity of mETS' energetic output to mtDNA genetic variation (e.g. seed beetles [17] and fruit flies [18,19]) and to nuclear genes that affect mitochondrial function (e.g. marine copepods [20] and eastern yellow robins [21]). There is thus increasing evidence for selection on mtDNA–nDNA–environment interactions via organismal functioning in metazoans. Nevertheless, despite the growing body of evidence that shows standing genetic variation in the mitochondrial genome accumulates via natural selection [18,22–24], studies continue to assume strict neutrality of mitochondrial gene sequences. A possible reason for this salient omission could be that the mitonuclear effect on phenotypes is mostly reported in conventional model organisms, like fruit flies and beetles [8,16,17,25]. So the generality of the mitonuclear genetic effects must be tested across different models.
Except for a few studies on yeast [26] and fungi [27], the influence of mitonuclear genomes and their interactions with the environment on phenotype expression in other unicellular eukaryotes is poorly understood. Protists, such as slime moulds, are rarely used as a model in the field of mitonuclear ecology. Like animal cells, slime moulds bear nuclei and membrane-bound mitochondria packed into sub-cellular structures called mitochondrial nucleoids [28]. The slime moulds' mitochondrial genome (e.g. approximately 60 kb in Physarum polycephalum [29]) is larger, recombines frequently, and has retained several nuclear-encoded mitochondrial genes compared to a typical animal mtDNA [30]. Given that slime mould's mtDNA differs considerably from animal mtDNA, mitonuclear interactions and their effect on phenotypes might manifest differently than the previously reported patterns in metazoans. However, there is no experimental support because although slime moulds are studied for their decision-making abilities [31,32], earlier studies did not account for genotype effects on behavioural phenotypes.
Here, we studied all possible two- and three-way interactions between mtDNA, nDNA and temperature for phenotype expression in the slime mould P. polycephalum. We developed a genetic panel of six strains that expressed distinct mtDNA and nDNA haplotypes. The panel included two strains expressing TU111 nuclear haplotype that carries a approximately 16 kb mitochondrial-fusion (mF) plasmid in their cytoplasm. The mF plasmid can rapidly integrate into every mtDNA molecule and recombine mtDNA fragments within the individual [33]. Except for an earlier study that demonstrated significant effect of a mitochondrial plasmid on the longevity of a Physarum strain [34], less is known about mF plasmid's effect on the expression of other key phenotypes in slime moulds. We assayed for growth rate and movement of the strains across two temperature regimes: 24° and 28°C. Since Physarum is usually reared at 24°C, introducing the strains to a warmer temperature (28°C) was expected to invoke epistatic interactions between mitonuclear genes and the thermal environment. Therefore, we studied (1) whether the phenotype difference is explained by two-way mtDNA × nDNA (G × G), nDNA or mtDNA × temperature (G × E) interactions and three-way mtDNA × nDNA × temperature (G × G × E) interactions, and (2) whether the strains expressing the mF plasmid move and grow slower than other strains. Lastly, (3) we analysed the direction and magnitude of inter-trait correlation across the strains.
2. Material and methods
(a) . Slime mould mitonuclear genetic panel
We established the panel of six mitonuclear strains by crossing haploid myxamoebae (i.e. primordial germ cells) of two mitochondria donors (AI35 and TU9) with three nuclei donors (DP89, DP246 and TU111) [33,35]. Briefly, the myxamoebae of respective pairs were mixed in 100 µl sterile water and laced on the surface of sterile SM-30 agar plates (containing 10.5 mM citric acid monohydrate, 19.5 mM trisodium citrate dihydrate, 10.0 mM MgSO4 and 2.5% agarose) to facilitate mating [35]. The SM-30 plates were incubated at 24°C in complete darkness for 48 h or until young diploid macroplasmodia were observed on the surface of the agar medium. The macroplasmodia emerging from the crosses were individually transferred to a sterile Petri dish containing MEA medium (made of malt extract, peptone, 1.5% non-nutrient agar and haemin solution) [36]. The macroplasmodia of each strain was propagated on MEA for two weeks at 24°C and in complete darkness. Mature macroplasmodia were then transferred to 2% w/v oatmeal agar (made of 2% powdered rolled oats and 1.5% non-nutrient agar), on which they were kept for the rest of the study.
(b) . Mitonuclear strain genotyping
Because mitonuclear strains used in this study have never been sequenced, we determined the strains' mitochondrial and nuclear genetic identity from sequences of three mitochondrial genes—cytochrome oxidase (COX) subunit 1, COX3 and cytochrome b mitochondrial and the 26S rRNA nuclear gene. We first isolated whole genomic DNA from macroplasmodia of each of the six strains using the QIAGEN DNeasy kit, including an RNAse treatment step at 37°C. PCR amplification of the four genes was then performed using the method described by Nomura et al. [37] (see the electronic supplementary material for more information). The purified PCR products were sent for Sanger sequencing in Macrogen (South Korea). Twenty-four partial-length gene sequences were uploaded to the NCBI Genbank database and are available under accession numbers COX1 (ON632012 to ON632017), COX3 (ON632018 to ON632023), CYTB (ON632024 to ON632029) and 26S rRNA (ON632030 to ON632035). Lastly, using PCR oligonucleotides designed explicitly for detecting mF plasmid integration with the mtDNA [37], we confirmed that AI35.TU111 and TU9.TU111 strains expressed recombined mF-mtDNA molecules.
(c) . Racetrack assay
In the first experimental assay, we determined differences in the distance moved (in cm) by strains across 24° and 28°C temperature regimes. Strains were acclimated to search for food on a non-nutrient agar medium before the assay, which minimized the effect of agar medium on their movement. Sterile plastic containers (11.8 × 2.8 cm, 50 ml polystyrene reservoir, Axygen, USA) filled with 1.5% non-nutrient agar served as custom racetracks (electronic supplementary material, figure S1). We placed a 1 × 1 cm plasmodial fragment from each strain on the racetrack. We allowed the macroplasmodia to move from a ‘start line’ (drawn at 1.5 cm from the container's leading edge) toward a ‘finish line’ (drawn at 1 cm from the container's trailing edge). The racetrack assay was run for 8 h at the respective temperature regimes in dark conditions. On each day at the end of the 8 h assay, we photographed the racetracks alongside a ruler (scale = 0.1 mm) in the background using a digital camera (EOS 1300D, EFS 18–55 mm lens, Canon). Any individual that did not move past the start line was omitted from further analysis (electronic supplementary material, table S2). We scaled the number of pixels to a 10 cm reference length drawn on the ruler in ImageJ software and estimated the distance moved by the plasmodia in centimetres. We ran the racetrack assay for 31 consecutive days, using four plasmodial fragments from each strain per temperature treatment per day. Hence, we assayed a total of 124 plasmodial fragments per strain per temperature.
(d) . Growth rate assay
In the second assay, we estimated surface area of growth (in cm2) of strains across the same 24° and 28°C temperature regimes. In this assay, we placed individual 2 × 2 cm plasmodial fragments from each strain on the centre of sterile Petri dish (14.5 cm diameter × 2 cm depth, Greiner Bio-one, Hungary) containing 2% w/v oatmeal agar (electronic supplementary material, figure S2). We allowed the macroplasmodia to grow for 36 h at either 24° or 28°C in the dark, after which we photographed each Petri dish with a ruler (scale = 0.1 mm) in the background. As a proxy for growth rate, we estimated the total surface area covered by each slime mould using ImageJ software. Then, we scaled the number of pixels (representing macroplasmodia) to a 10 cm reference length and estimated the surface area in cm2. Across 12 experimental days, we sampled five plasmodial fragments per strain per temperature daily. In total, we assayed 60 plasmodial fragments per strain per temperature.
(e) . Statistical analyses
We analysed data from the racetrack and growth rate assays using linear mixed-effect (lmer) models in the lme4 package in R studio (v. 2019.09.1, build 372) [38]. Raw data and R codes used for analyses are available in the Figshare repository [39]. We made separate lmer models for each response variable (i.e. movement and growth rate) with mitochondrial haplotype (two levels), nuclear haplotype (three levels), assay temperature (two levels) and the interactions between these factors as fixed effects. Further, the full models also included plasmodia (plasmodial fragments nested within experimental days) as a random intercept and interactions between plasmodia and fixed effect terms (viz., mtDNA, nDNA and temperature) as nested random effects. We used step function implementing Kenward–Roger's method of estimating degrees of freedom to arrive at the simplified model. The model simplification process removed non-significant fixed and random effect terms from the full models (electronic supplementary material, table S3). We then derived parameter estimates for fixed and random effects from the simplified models using the restricted maximum-likelihood method. We used Wald's type III chi-squared test to estimate degrees of freedom and p-value significance for each fixed effect in the models. The standard deviation in the response variable attributed to each random effect was calculated from summary of the models. In addition, we estimated the p-value significance of each random effect using ranova function in the lmerTest package [40]. Lastly, using Pearson's correlation test, we estimated inter-trait correlation between the mean distance moved and mean growth rate across the strains.
3. Results
We found a significant effect of three-way interactions between mtDNA, nDNA and temperature only on the strains' growth rate (LMER analysis: χ2 = 43.778, p < 0.0001; table 1 and figure 1) but not distance moved by the strains (electronic supplementary material, table S3). Similarly, only growth rate was significantly affected by the mtDNA × temperature interaction (table 1 and electronic supplementary material, figure S3), but not movement of strains (electronic supplementary material, table S3). Both traits were affected significantly by mtDNA × nDNA and nDNA × temperature two-way interactions (table 1 and electronic supplementary material, figures S4 and S5). Generally, there was no negative effect of mF plasmid on both traits across temperatures (figure 1), except that a higher percentage of individuals with mF plasmid did not cross the start line in racetrack assay (electronic supplementary material, table s2). Further, we found a positive inter-trait correlation across the strains (figure 2, Pearson's correlation test: rp (95% CI) = 0.60 (0.04, 0.87), p = 0.039).
Table 1.
Results from linear mixed-regression model analysis of (A) growth rate and (B) movement data. The final models included mtDNA haplotype, nDNA haplotype, temperature and interactions between these factors as fixed effects, along with plasmodia as a random intercept and the interaction between mtDNA, nDNA and plasmodia modelled as a random effect. Finally, the parameter estimates, including degrees of freedom and p-value for fixed effects, and standard deviation and p-value for random effects, were estimated using Wald's type III chi-squared test and restricted maximum-likelihood method in R.
| fixed effects | d.f. | chi-square | p |
|---|---|---|---|
| (A) results from the final lmer model analysing growth rate data: [surface area∼mtDNA + nDNA + temperature + mtDNA × nDNA + mtDNA × temperature + nDNA × temperature + mtDNA × nDNA × temperature + (1|plasmodia) + (1|plasmodia × mtDNA × nDNA)] | |||
| mtDNA haplotype | 1 | 108.508 | <0.0001 |
| nDNA haplotype | 2 | 141.541 | <0.0001 |
| assay temperature | 1 | 1.297 | 0.255 |
| mtDNA × nDNA | 2 | 96.949 | <0.0001 |
| mtDNA × temperature | 1 | 25.017 | <0.0001 |
| nDNA × temperature | 2 | 16.301 | <0.001 |
| mtDNA × nDNA × temperature | 2 | 43.778 | <0.0001 |
| random effects | s.d. | p | |
| plasmodia × mtDNA × nDNA | 5.115 | <0.001 | |
| plasmodia | 4.516 | <0.0001 | |
| residual | 10.34 | ||
| (B) results from the final lmer model analysing movement data: [distance moved∼mtDNA + nDNA + temperature + mtDNA × nDNA + nDNA × temperature + (1|plasmodia) + (1|plasmodia × mtDNA × nDNA)] | |||
| mtDNA genotype | 1 | 221.622 | <0.0001 |
| nDNA genotype | 2 | 73.026 | <0.0001 |
| assay temperature | 1 | 1.777 | 0.183 |
| mtDNA × nDNA | 2 | 110.313 | <0.0001 |
| nDNA × temperature | 2 | 8.015 | 0.018 |
| random effects | s.d. | p | |
| plasmodia × mtDNA × nDNA | 0.757 | 0.025 | |
| plasmodia | 0.771 | <0.001 | |
| residual | 2.369 | ||
Figure 1.
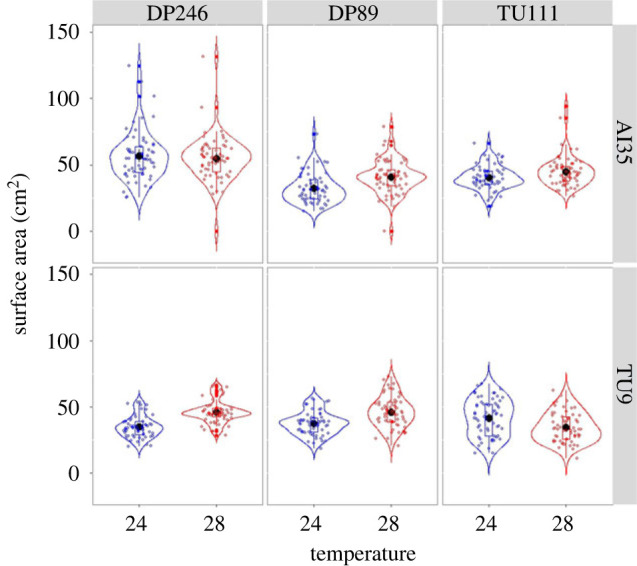
Violin plot showing G × G × E effect on the growth rate of slime mould strains. Each facet in the graph represents a combination of nDNA haplotypes (DP246, DP89 and TU111) and mtDNA haplotypes (AI35 and TU111). Assaying temperatures of 24° and 28°C were used in growth rate assay.
Figure 2.
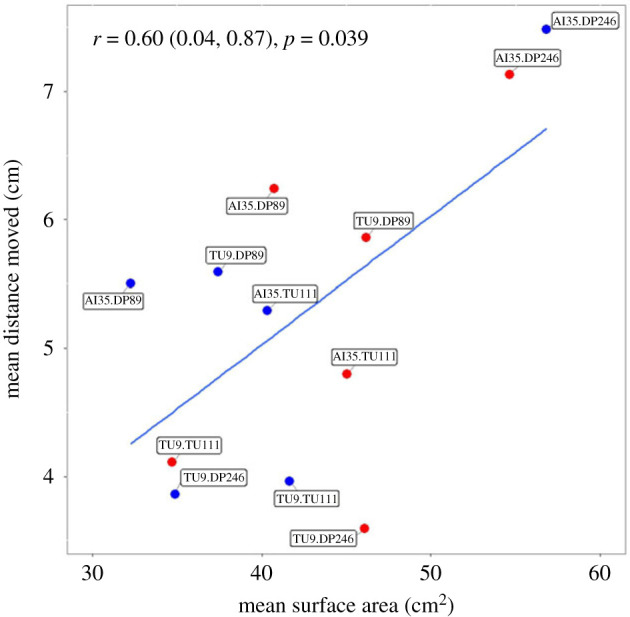
Inter-trait correlation for the slime mould mitonuclear genetic panel across two temperature treatments. Data points representing estimates from 24°C are shown in blue, and estimates from 28°C are shown in red. The inter-trait correlation across the strains was positive (Pearson's correlation test: rp (95% CI) = 0.60 (0.04, 0.87), p = 0.039).
4. Discussion
Our study is the first to demonstrate (1) mtDNA × nDNA × temperature and mtDNA × temperature interactions for growth and (2) mtDNA × nDNA and nDNA × temperature interactions for growth and movement in a non-conventional model organism, the unicellular slime mould P. polycephalum. The functioning of strains expressing TU9-mtDNA depended on nuclear haplotype and temperature, while the AI35 strains remained robust to changes in both. Consequently, strains with TU9-haplotype showed reduced growth and movement across both temperatures and thus were observed below the regression line in the inter-trait correlation. The most significant difference between the two mtDNA haplotypes is the 2 kb deletion mutation found in TU9's mtDNA [35]. Given that deletions in human mtDNA affect mETS functioning and are linked to mitochondrial myopathies and congenital diseases [41,42], the deletion mutation likely renders TU9-mtDNA more sensitive to changes in the nuclear background and temperature compared to AI35-haplotype. However, the exact list of genes missing in TU9-mtDNA remains undefined, and only future sequencing efforts can shed light on the true genetic differences between the two haplotypes. Mitochondrial haplotypes in other species also react differently to nDNA and environmental backgrounds [43,44]. For instance, the extensively studied Brownsville haplotype in Drosophila melanogaster carries a mutation (Ala278->Thr) in the mt:Cyt-b gene that makes the male fruit flies completely sterile when expressed alongside the w1118 nDNA background at approximately 25–27°C [43], confers reduced fertility in Dahomey nDNA at 18°C, but restores fertility in Coffs Harbour nDNA at 22°C [44].
Mitonuclear interactions and their effects on phenotypes have gained traction in recent years. Evidence for mitonuclear effect on phenotype is found in standard laboratory models [7,17,45,46], humans [47] and single-celled eukaryotes [26,27]. Even implementing the recently developed mitochondrial replacement therapy arguably hinges on proper mitonuclear interactions [48]. The finding that mitonuclear genotype affects growth and movement of slime mould strains adds support to the notion that interactions between mitochondrial and nuclear-encoded proteins, particularly the ones involved in mETS that provide energy in the form of 5′-adenosine triphosphate (ATP), are quintessential for cellular functions in diverse eukaryotes.
The magnitude of mtDNA × temperature effect was more profound on growth rate, but we found no significant effect on movement, suggesting that the mitochondrial functioning required for slime mould's growth on oatmeal agar is temperature sensitive. Thus, we predicted the significant G × G × E interactions for growth rate might be driven by the mtDNA-encoded proteins' response to temperature. Quantifying slime mould's mETS functioning across temperature treatments and growth media will be an exciting avenue to explore. Surprisingly, we found no stronger negative effect of the mF plasmid on movement and growth of strains across both temperatures suggesting that the selfishly replicating nature of the plasmid might not exert a cost on the individual. However, we note that the phenotype effect of mF-plasmid might be contingent on the mtDNA and nDNA backgrounds, given that an earlier study found a significant effect of a approximately 8 kb plasmid on plasmodial senescence in the aux-2 Physarum strain [34]. Unfortunately, we could not test other mtDNA and nDNA haplotypes in this study because of the limited availability of strains in the laboratory.
Finding gene-by-gene-by-environment interactions for phenotypes is a crucial first step in understanding how species might respond to environmental changes. Only recently, evolutionary biologists realized the potential contribution of mitonuclear interactions on phenotype expression across different environmental contexts in eukaryotes, moving past the age-old assumption of strict neutrality of mtDNA [4,6,49]. Thermal selection particularly affects the functioning of mETS proteins [50] and thus can shape within-species regional distribution of mitonuclear haplotypes [22,24,51]. Therefore, given the strong G × G × E effect on growth rate, it is conceivable that the genetic variation in slime mould is sensitive to thermal selection. Harnessing other mtDNA and nDNA haplotypes and testing phenotypes across different environmental contexts are avenues for future research to tease out how genes and environmental perturbations affect phenotype expression in single-celled protists.
Data accessibility
Raw data from the experiments and R codes for analysis are freely available in the Figshare repository https://figshare.com/s/47c5b860b8dd1a415f54 [39]. Twenty-four partial-length gene sequences are available in NCBI Genbank with the accession numbers: ON632012 to ON632035 and on the Figshare page.
The data are provided in the electronic supplementary material [39].
Authors' contributions
V.N.R.: conceptualization, investigation, methodology, data curation, formal analysis, software, validation, visualization, writing—original draft, writing—review and editing; M.B.: conceptualization, methodology, funding acquisition, resources, project administration, writing—review and editing.
All authors gave final approval for publication and agreed to be held accountable for the work performed therein.
Conflict of interest declaration
We declare we have no competing interests
Funding
The study was funded by an Australian Research Council's Discovery Project (grant no. DP190101583) to M.B.
Acknowledgements
We thank Julie Lim for her help with the experiments.
References
- 1.Hill GE, Havird JC, Sloan DB, Burton RS, Greening C, Dowling DK. 2019. Assessing the fitness consequences of mitonuclear interactions in natural populations. Biol. Rev. Camb. Philos. Soc. 94, 1089-1104. ( 10.1111/brv.12493) [DOI] [PMC free article] [PubMed] [Google Scholar]
- 2.Rand DM, Haney RA, Fry AJ. 2004. Cytonuclear coevolution: the genomics of cooperation. Trends Ecol. Evol. 19, 645-653. ( 10.1016/j.tree.2004.10.003) [DOI] [PubMed] [Google Scholar]
- 3.Bar-Yaacov D, Blumberg A, Mishmar D. 2012. Mitochondrial–nuclear co-evolution and its effects on OXPHOS activity and regulation. Bba-Gene Regul. Mech. 1819, 1107-1111. ( 10.1016/j.bbagrm.2011.10.008) [DOI] [PubMed] [Google Scholar]
- 4.Hill GE. 2019. Mitonuclear ecology. Oxford, UK: Oxford University Press. [Google Scholar]
- 5.Ellison CK, Burton RS. 2006. Disruption of mitochondrial function in interpopulation hybrids of Tigriopus californicus. Evolution 60, 1382-1391. [PubMed] [Google Scholar]
- 6.Meiklejohn CD, Holmbeck MA, Siddiq MA, Abt DN, Rand DM, Montooth KL. 2013. An incompatibility between a mitochondrial tRNA and its nuclear-encoded tRNA synthetase compromises development and fitness in Drosophila. PLoS Genet. 9, e1003238. ( 10.1371/journal.pgen.1003238) [DOI] [PMC free article] [PubMed] [Google Scholar]
- 7.Rand DM, Fry A, Sheldahl L. 2006. Nuclear-mitochondrial epistasis and Drosophila aging: introgression of Drosophila simulans mtDNA modifies longevity in D. melanogaster nuclear backgrounds. Genetics 172, 329-341. [DOI] [PMC free article] [PubMed] [Google Scholar]
- 8.Rank NE, Mardulyn P, Heidl SJ, Roberts KT, Zavala NA, Smiley JT, Dahlhoff EP. 2020. Mitonuclear mismatch alters performance and reproductive success in naturally introgressed populations of a montane leaf beetle. Evolution 74, 1724-1740. ( 10.1111/evo.13962) [DOI] [PubMed] [Google Scholar]
- 9.Burton RS, Pereira RJ, Barreto FS. 2013. Cytonuclear genomic interactions and hybrid breakdown. Ann. Rev. Ecol. Evol. Syst. 44, 281-302. ( 10.1146/annurev-ecolsys-110512-135758) [DOI] [Google Scholar]
- 10.Chase CD. 2007. Cytoplasmic male sterility: a window to the world of plant mitochondrial–nuclear interactions. Trends Genet. 23, 81-90. ( 10.1016/j.tig.2006.12.004) [DOI] [PubMed] [Google Scholar]
- 11.Rand DM, Mossman JA. 2020. Mitonuclear conflict and cooperation govern the integration of genotypes, phenotypes and environments. Phil. Trans. R. Soc. B 375, 20190188. ( 10.1098/rstb.2019.0188) [DOI] [PMC free article] [PubMed] [Google Scholar]
- 12.Hoekstra LA, Siddiq MA, Montooth KL. 2013. Pleiotropic effects of a mitochondrial–nuclear incompatibility depend upon the accelerating effect of temperature in Drosophila. Genetics 195, 1129-1139. ( 10.1534/genetics.113.154914) [DOI] [PMC free article] [PubMed] [Google Scholar]
- 13.Zhu CT, Ingelmo P, Rand DM. 2014. G × G × E for lifespan in Drosophila: mitochondrial, nuclear, and dietary interactions that modify longevity. PLoS Genet. 10, e1004354. ( 10.1371/journal.pgen.1004354) [DOI] [PMC free article] [PubMed] [Google Scholar]
- 14.Hamanaka RB, Weinberg SE, Reczek CR, Chandel NS. 2016. The mitochondrial respiratory chain is required for organismal adaptation to hypoxia. Cell Rep. 15, 451-459. ( 10.1016/j.celrep.2016.03.044) [DOI] [PMC free article] [PubMed] [Google Scholar]
- 15.Harada AE, Healy TM, Burton RS. 2019. Variation in thermal tolerance and its relationship to mitochondrial function across populations of Tigriopus californicus. Front. Physiol. 10, 213. ( 10.3389/fphys.2019.00213) [DOI] [PMC free article] [PubMed] [Google Scholar]
- 16.Pichaud N, Chatelain EH, Ballard JWO, Tanguay R, Morrow G, Blier PU. 2010. Thermal sensitivity of mitochondrial metabolism in two distinct mitotypes of Drosophila simulans: evaluation of mitochondrial plasticity. J. Exp. Biol. 213, 1665-1675. ( 10.1242/jeb.040261) [DOI] [PubMed] [Google Scholar]
- 17.Arnqvist G, Dowling DK, Eady P, Gay L, Tregenza T, Tuda M, Hosken DJ. 2010. Genetic architecture of metabolic rate: environment specific epistasis between mitochondrial and nuclear genes in an insect. Evolution 64, 3354-3363. ( 10.1111/j.1558-5646.2010.01135.x) [DOI] [PubMed] [Google Scholar]
- 18.Camus MF, Wolff JN, Sgro CM, Dowling DK. 2017. Experimental support that natural selection has shaped the latitudinal distribution of mitochondrial haplotypes in Australian Drosophila melanogaster. Mol. Biol. Evol. 34, 2600-2612. ( 10.1093/molbev/msx184) [DOI] [PubMed] [Google Scholar]
- 19.Pichaud N, Ballard JWO, Tanguay RM, Blier PU. 2012. Naturally occurring mitochondrial DNA haplotypes exhibit metabolic differences: insight into functional properties of mitochondria. Evolution 66, 3189-3197. ( 10.1111/j.1558-5646.2012.01683.x) [DOI] [PubMed] [Google Scholar]
- 20.Barreto FS, Watson ET, Lima TG, Willett CS, Edmands S, Li W, Burton RS. 2018. Genomic signatures of mitonuclear coevolution across populations of Tigriopus californicus. Nat. Ecol. Evol. 2, 1250-1257. ( 10.1038/s41559-018-0588-1) [DOI] [PubMed] [Google Scholar]
- 21.Morales HE, Pavlova A, Amos N, Major R, Kilian A, Greening C, Sunnucks P. 2018. Concordant divergence of mitogenomes and a mitonuclear gene cluster in bird lineages inhabiting different climates. Nat. Ecol. Evol. 2, 1258-1267. ( 10.1038/s41559-018-0606-3) [DOI] [PubMed] [Google Scholar]
- 22.Mishmar D, et al. 2003. Natural selection shaped regional mtDNA variation in humans. Proc. Natl Acad. Sci. USA 100, 171-176. ( 10.1073/pnas.0136972100) [DOI] [PMC free article] [PubMed] [Google Scholar]
- 23.Morales HE, Pavlova A, Joseph L, Sunnucks P. 2015. Positive and purifying selection in mitochondrial genomes of a bird with mitonuclear discordance. Mol. Ecol. 24, 2820-2837. ( 10.1111/mec.13203) [DOI] [PubMed] [Google Scholar]
- 24.Ruiz-Pesini E, Mishmar D, Brandon M, Procaccio V, Wallace DC. 2004. Effects of purifying and adaptive selection on regional variation in human mtDNA. Science 303, 223-226. ( 10.1126/science.1088434) [DOI] [PubMed] [Google Scholar]
- 25.Erić P, Patenković A, Erić K, Tanasković M, Davidović S, Rakić M, Savić Veselinović M, Stamenković-Radak M, Jelić M. 2022. Temperature-specific and sex-specific fitness effects of sympatric mitochondrial and mito-nuclear variation in Drosophila obscura. Insects 13, 139. [DOI] [PMC free article] [PubMed] [Google Scholar]
- 26.Lee HY, Chou JY, Cheong L, Chang NH, Yang SY, Leu JY. 2008. Incompatibility of nuclear and mitochondrial genomes causes hybrid sterility between two yeast species. Cell 135, 1065-1073. ( 10.1016/j.cell.2008.10.047) [DOI] [PubMed] [Google Scholar]
- 27.Clergeot P-H, Olson Å. 2021. Mitonuclear genetic interactions in the basidiomycete Heterobasidion parviporum involve a non-conserved mitochondrial open reading frame. Front. Fungal Biol. 2, 64. ( 10.3389/ffunb.2021.779337) [DOI] [PMC free article] [PubMed] [Google Scholar]
- 28.Gray MW, Lang BF, Burger G. 2004. Mitochondria of protists. Annu. Rev. Genet. 38, 477-524. ( 10.1146/annurev.genet.37.110801.142526) [DOI] [PubMed] [Google Scholar]
- 29.Takano H, Abe T, Sakurai R, Moriyama Y, Miyazawa Y, Nozaki H, Kawano S, Sasaki N, Kuroiwa T. 2001. The complete DNA sequence of the mitochondrial genome of Physarum polycephalum. Mol. Gen. Genet. 264, 539-545. ( 10.1007/s004380000357) [DOI] [PubMed] [Google Scholar]
- 30.Gray MW, Burger G, Lang BF. 1999. Mitochondrial evolution. Science 283, 1476-1481. [DOI] [PubMed] [Google Scholar]
- 31.Reid CR, Beekman M. 2013. Solving the towers of Hanoi—how an amoeboid organism efficiently constructs transport networks. J. Exp. Biol. 216, 1546-1551. ( 10.1242/jeb.081158) [DOI] [PubMed] [Google Scholar]
- 32.Dussutour A, Latty T, Beekman M, Simpson SJ. 2010. Amoeboid organism solves complex nutritional challenges. Proc. Natl Acad. Sci. USA 107, 4607-4611. ( 10.1073/pnas.0912198107) [DOI] [PMC free article] [PubMed] [Google Scholar]
- 33.Sakurai R, Nomura H, Moriyam Y, Kawano S. 2004. The mitochondrial plasmid of the true slime mold Physarum polycephalum bypasses uniparental inheritance by promoting mitochondrial fusion. Curr. Genet. 46, 103-114. ( 10.1007/s00294-004-0512-x) [DOI] [PubMed] [Google Scholar]
- 34.Nakagawa CC, Jones EP, Miller DL. 1998. Mitochondrial DNA rearrangements associated with mF plasmid integration and plasmodial longevity in Physarum polycephalum. Curr. Genet. 33, 178-187. ( 10.1007/s002940050325) [DOI] [PubMed] [Google Scholar]
- 35.Moriyama Y, Kawano S. 2003. Rapid, selective digestion of mitochondrial DNA in accordance with the matA hierarchy of multiallelic mating types in the mitochondrial inheritance of Physarum polycephalum. Genetics 164, 963-975. [DOI] [PMC free article] [PubMed] [Google Scholar]
- 36.Kawano S, Anderson RW, Nanba T, Kuroiwa T. 1987. Polymorphism and uniparental inheritance of mitochondrial DNA in Physarum polycephalum. J. Gen. Microbiol. 133, 3175-3182. ( 10.1099/00221287-133-11-3175) [DOI] [PubMed] [Google Scholar]
- 37.Nomura H, Moriyama Y, Kawano S. 2005. Rearrangements in the Physarum polycephalum mitochondrial genome associated with a transition from linear mF-mtDNA recombinants to circular molecules. Curr. Genet. 47, 100-110. ( 10.1007/s00294-004-0540-6) [DOI] [PubMed] [Google Scholar]
- 38.R Development Core Team. 2020. R: a language and environment for statistical computing. Vienna, Austria: R Foundation for Statistical Computing. https://www.R-project.org. [Google Scholar]
- 39.Nagarajan-Radha V, Beekman M. 2022. Data from: G × G × E effect on phenotype expression in a non-conventional model organism, the unicellular slime mould Physarum polycephalum. Figshare. ( 10.6084/m9.figshare.21407934) [DOI] [PMC free article] [PubMed]
- 40.Kuznetsova A, Brockhoff PB, Christensen RHB. 2017. lmerTest Package: tests in linear mixed effects models. J. Stat. Softw. 82, 1-26. ( 10.18637/jss.v082.i13) [DOI] [Google Scholar]
- 41.Poulton J, Deadman ME, Ramacharan S, Gardiner RM. 1991. Germ-line deletions of mtDNA in mitochondrial myopathy. Am. J. Hum. Genet. 48, 649-653. [PMC free article] [PubMed] [Google Scholar]
- 42.Holt IJ, Harding AE, Morgan-Hughes JA. 1988. Deletions of muscle mitochondrial DNA in patients with mitochondrial myopathies. Nature 331, 717-719. ( 10.1038/331717a0) [DOI] [PubMed] [Google Scholar]
- 43.Clancy DJ, Hime GR, Shirras AD. 2011. Cytoplasmic male sterility in Drosophila melanogaster associated with a mitochondrial CYTB variant. Heredity 107, 374-376. ( 10.1038/hdy.2011.12) [DOI] [PMC free article] [PubMed] [Google Scholar]
- 44.Wolff JN, Tompkins DM, Gemmell NJ, Dowling DK. 2016. Mitonuclear interactions, mtDNA-mediated thermal plasticity, and implications for the Trojan Female Technique for pest control. Sci. Rep. 6, ARTN 30016. ( 10.1038/srep30016) [DOI] [PMC free article] [PubMed] [Google Scholar]
- 45.Edmands S, Burton RS. 1999. Cytochrome C oxidase activity in interpopulation hybrids of a marine copepod: a test for nuclear–nuclear or nuclear–cytoplasmic coadaptation. Evolution 53, 1972-1978. ( 10.1111/j.1558-5646.1999.tb04578.x) [DOI] [PubMed] [Google Scholar]
- 46.Houtkooper RH, Mouchiroud L, Ryu D, Moullan N, Katsyuba E, Knott G, Williams RW, Auwerx J. 2013. Mitonuclear protein imbalance as a conserved longevity mechanism. Nature 497, 451-457. ( 10.1038/Nature12188) [DOI] [PMC free article] [PubMed] [Google Scholar]
- 47.Zaidi AA, Makova KD. 2019. Investigating mitonuclear interactions in human admixed populations. Nat. Ecol. Evol. 3, 213-222. ( 10.1038/s41559-018-0766-1) [DOI] [PMC free article] [PubMed] [Google Scholar]
- 48.Morrow EH, Reinhardt K, Wolff JN, Dowling DK. 2015. Risks inherent to mitochondrial replacement. EMBO Rep. 16, 541-544. ( 10.15252/embr.201439110) [DOI] [PMC free article] [PubMed] [Google Scholar]
- 49.Ballard JWO, Kreitman M. 1995. Is mitochondrial-DNA a strictly neutral marker. Trends Ecol. Evol. 10, 485-488. [DOI] [PubMed] [Google Scholar]
- 50.Pichaud N, Ballard JWO, Tanguay RM, Blier PU. 2011. Thermal sensitivity of mitochondrial functions in permeabilized muscle fibers from two populations of Drosophila simulans with divergent mitotypes. Am. J. Physiol.-Reg. I 301, R48-R59. ( 10.1152/ajpregu.00542.2010) [DOI] [PubMed] [Google Scholar]
- 51.Foote AD, Morin PA, Durban JW, Pitman RL, Wade P, Willerslev E, Gilbert MTP, da Fonseca RR. 2011. Positive selection on the killer whale mitogenome. Biol. Lett. 7, 116-118. ( 10.1098/rsbl.2010.0638) [DOI] [PMC free article] [PubMed] [Google Scholar]
Associated Data
This section collects any data citations, data availability statements, or supplementary materials included in this article.
Data Citations
- Nagarajan-Radha V, Beekman M. 2022. Data from: G × G × E effect on phenotype expression in a non-conventional model organism, the unicellular slime mould Physarum polycephalum. Figshare. ( 10.6084/m9.figshare.21407934) [DOI] [PMC free article] [PubMed]
Data Availability Statement
Raw data from the experiments and R codes for analysis are freely available in the Figshare repository https://figshare.com/s/47c5b860b8dd1a415f54 [39]. Twenty-four partial-length gene sequences are available in NCBI Genbank with the accession numbers: ON632012 to ON632035 and on the Figshare page.
The data are provided in the electronic supplementary material [39].