Abstract
Conventional three-electrode systems used in electrochemical measurement demand time-consuming and maintenance intensive procedures to enable accurate and repeatable electrochemical measurements. Traditionally, different metal configurations are used to establish the electrochemical gradient required to acquire the redox activity, and vary between different electrochemical measurement platforms. However, in this work, we report using the same metal (gold) for the counter, working and reference electrodes fabricated on a miniaturized printed circuit board (PCB) for a much simpler design. Potassium ferricyanide, widely used as a redox probe for electrochemical characterization, was utilized to acquire cyclic voltametric profiles using both the printed circuit board-based gold–gold–gold three-electrode and conventional three-electrode systems (glassy carbon electrode or graphite foil as the working electrode, platinum wire as the counter electrode, and Ag/AgCl as the reference electrode). The results show that both types of electrode systems generated similar cyclic voltammograms within the same potential window (−0.5 to +0.7 V). However, the novel PCB-based same-metal three-electrode electrochemical cell only required a few activation cycles and exhibited impressive cyclic voltametric repeatability with higher redox sensitivity and detection window, while using only trace amounts of solutions/analytes.
Conventional three-electrode systems used in electrochemical measurement demand time-consuming and maintenance intensive procedures to enable accurate and repeatable electrochemical measurements.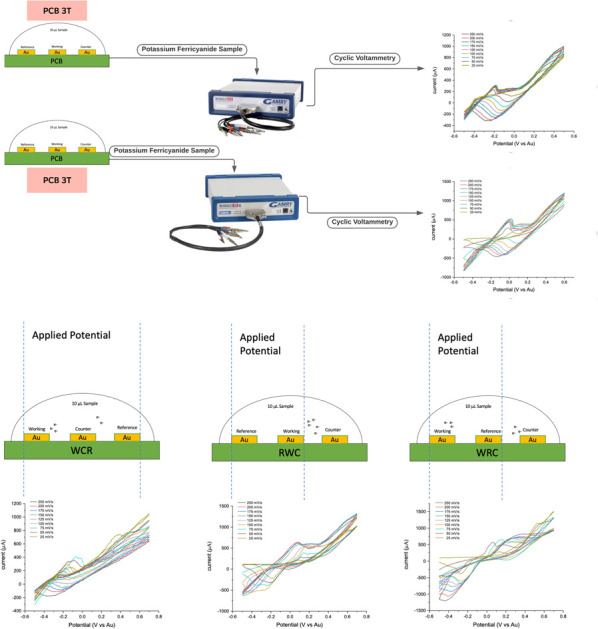
1. Introduction
Cyclic voltammetry (CV) is a commonly employed gold-standard electrochemical measurement technique extensively used for investigating the electron transfer mechanism by observing the reduction and oxidation process of a molecular species.1,2 The CV method involves the application of a linearly cycled potential sweep to measure the current response of a redox active solution, therefore providing a tool for investigating the mechanisms of the redox processes. This is achieved by means of a forward and reverse scan cycle where the former generates a species while the latter forces regeneration through a series of cyclic scans which allows for effectively studying its oxidation and reduction activities through a reversible oxidation–reduction reaction, respectively.1,3,4 Interrogation of this reaction provides a practical tool for studying and monitoring biofilm formations (such as for bacterial attachments),5 measuring oxidative stress in clinical settings,6 biofouling processes,7 and others.8,9 While reactions may also exhibit quasi-reversible or irreversible cycles, these changes that appear on repetitive cycles also provide indirect information regarding the reaction mechanisms involved.
For efficient electrochemical reactions, a three-electrodes configuration which includes a counter electrode (CE), reference electrode (RE) and a working electrode (WE) is employed. Normal two electrodes arrangement is generally unable to maintain a sufficiently constant potential to allow primary measurement of resistance across the working electrode and the solution's interface while at the same time passing the current counteracting redox events occurring at the surface of the working electrode. Therefore, the role of the reference electrode in the three-electrodes technique is to act as a reference to measure and control the potential of the working electrode without a current flow.3,10,11 The potential changes of the working electrode can then be obtained without being influenced by the changes occurring at the counter electrode. Generally, a potential sweep results in a current rise to a peak, which is then followed by a decay in a regular manner. The current generation is fundamentally a two steps process where mass transfer of the electroactive material occurs towards the surface of the working electrode which then results in electron transfer reaction.
Various types of common electrodes have been utilized for the three-electrode setup such as carbon or carbon-based working electrodes,5,12 platinum counter electrode7,13 and Ag/AgCl reference electrode.11,14 While these common electrodes are well known, many researchers' have reported using modified electrodes in their electrochemical studies.3,9,15 Niranjana et al.4 for example reported using a carbon paste electrode (CPE) modified by sodium dodecyl sulphate (SDS) working electrode in conjunction with a platinum wire counter electrode and saturated calomel reference electrode. Enhanced detection of potassium ferricyanide and dopamine was observed using the improved CV response acquired as compared to bare CPE.4,16
Conventional three-electrode system for CV experiments on potassium ferricyanide has been extensively studied and reported,3,17 for example Hu et al.17 measured CV properties of modified acetyl trimethyl ammonium bromide carbon paste electrode using potassium ferricyanide as the standard.17 Potassium ferricyanide exhibits one electron reduction of ferricyanide to ferrocyanide; which is a nearly reversible electrochemical reaction at solution redox potential of E0 between 0.36 V to 0.45 V at 30 °C based on molar concentration.18 Thus, potassium ferricyanide has been a popular choice to demonstrate standard CV.19 The performances and accuracy of three-electrode systems can also be obtained by means of using standard material such as the potassium ferricyanide.20 Potassium ferricyanide, a bright red chemical compound is soluble in water and in this state has a green-yellow fluorescence.21 It is generally used in physiological studies intended to increase the redox potential of a solution of interest.
In recent studies, screen printing technology has been employed to prepare miniaturized screen-printed electrodes (SPEs) similar to conventional three-electrode configuration.8,11,14 While most encompass three different electrode materials, Koç et al.3 reported using two carbon electrodes in combination with the reference electrode Ag/AgCl to study the electrochemical behaviour of potassium ferricyanide/ferrocyanide redox probes.3 The authors used CV method to study the behaviour of SPEs, potential windows and background currents. There has also been much progress in the development of microfluidic and optical biosensors coupled lithographically defined micrometre spaced metallic electrodes acting as the working and counter electrodes.22–24 Using gold25,26 and platinum electrodes and an external Ag/AgCl reference electrode fabricated in a compact electrochemical sensing device form, Hirbodvash et al.9 conducted CV measurements to extract concentration curves for potassium ferricyanide as a function of scan rates.9 These examples and other works4,6,10 however were mainly operational via conventional electrochemical methods and procedures where different electrode materials were required for carrying out CV measurements.
In the current study however, we demonstrate for the first time the acquisition of voltammograms using an unconventional three-electrode configuration where the same metal (gold) was utilized as the counter, working and reference electrodes fabricated on a printed circuit board (PCB). In our recent works, we have demonstrated the use of a novel two-electrode PCB for characterization of proteins27 and studies of Polynucleotides using Schottky Junctions.28 This two-terminal PCB design sensor was extended into a three-terminal PCB sensor and used as a replacement sensor for the conventional CV measurements in this study.
Potassium ferricyanide in KCl was employed as the standard solution to measure the CV profiles generated when using both the conventional three-electrode system and our patented same-metal PCB-based three-terminal (PCB-3T) system [Patent Pending, PI2020001607, PCT/MY2020/050097]. The PCB-based electrodes do not require extensive cleaning or pre-treatment prior to experiments and could be simply discarded for a new one without the need for cleaning due to its significantly lower cost of production. Further, these electrodes only require a significantly lower amount of solution of 10 μl allowing acquisition of highly repeatable voltammograms from trace amounts of analytes.
2. Materials and methods
2.1. Reagents and chemicals
Potassium ferricyanide (K3[Fe(CN)6]) and potassium chloride (KCl) used were of analytical grade sourced from Sigma Aldrich with 99% for both chemicals. Standard solution of 0.1 M KCl was prepared using double distilled water as the base solvent. 1 mM, 2 mM, 3 mM, 4 mM and 5 mM solutions of potassium ferricyanide meanwhile was prepared by dissolving in 0.1 M KCl solvent at room temperature.
2.2. Fabrication of PCB-3T platform
The PCB-3T with a dimension of 15 × 15 mm used in this study as shown in Fig. 1 was designed in-house while mass production was carried out by Asia Printed Circuits, Malaysia. Gold (Au) was the choice of metal for the electrodes due to its inert nature and common usage in electrochemistry. A single-sided 1.6 mm fiberglass-resin laminate (FR4) with a copper thickness of 36 μm was panelised for the imaging process. The panel was laminated with an ultra-violet (UV) light-sensitive dry polymer film. The plotted-out circuit film was laid and aligned on top of the laminated panel, followed by exposure to UV to bind it to the panel. Following this, the panel goes through a chemical photo-developing process to wash away the unexposed dry polymer film areas underneath the circuit lines and pads. A 4 to 5 μm layer of nickel (Ni) was electrolytically plated on top of the circuit lines and pads followed by electrolytic plating of Au (0.049–0.052 μm or 2 μin). After stripping and etching processes to remove the unwanted dry polymer and copper areas, the panel was printed with epoxy solder mask ink to cover the circuit lines leaving only the electrode and connecting pads exposed.
Fig. 1. Image showing the photograph of the proprietary PCB-3T electrode.
2.3. Cleaning process for PCB-3T platform
PCB-3T electrodes were first rinsed in distilled water using a clean glass beaker, following which the sensors were fully submerged in acetone filled in a beaker and sonicated at room temperature for 15 min. After the sonication, the acetone was discarded, and the electrodes were rinsed again in double distilled water followed by rinsing in ethyl alcohol. The electrodes were then dried with a clean tissue and blow-dried using nitrogen gas. Finally, the electrodes were dried in an oven for 10 min at 50 °C. The sample loading area (white-square in the PCB) with the gold-plated regions were never touched or scraped physically while cleaning to ensure no damage is caused and to avoid contamination.
2.4. Experimental procedure for conventional three-electrode setup
The experiments were conducted across two different electrochemical platforms for assessing reproducibility using Interface 1010 and Interface 1010E potentiostats from Gamry Instruments, USA. Platinum wire and Ag/AgCl reference electrodes were prepared for the experiments by first rinsing them in distilled water followed by wiping them dry with a clean tissue and further rinsing in ethyl alcohol. 1 mM solution of potassium ferricyanide in KCl solution at room temperature was used as the standard solution for comparing the performance of both the conventional electrodes and PCB-3T electrode. CV measurements were carried-out using the following parameters; 0 V start and stop potential, in the potential range of −0.5 to +0.70 V, 2 mV step size at scan rates starting from 25, 50, 75, 100, 125, 150, 175, 200 and 250 mV s−1 for each cycle using Gamry Interface 1000 and Gamry Interface 1010E. Glassy Carbon Electrode (GCE) and graphite foil were used as the working electrodes while maintaining platinum wire as the counter-electrode and Ag/AgCl electrode as the reference electrode in the two separate experiments. 10 ml of the electrolyte solution was stored in a thick bottom V-shaped glass cup and the electrodes immersed at appropriate angles to ensure no contacts made between them. Electrochemical activation for 20 cycles at 20 mV s−1 in the potential range of −0.5 V to +0.7 V at 2 mV steps was performed to activate the sample. CV at scan rates of 25, 50, 75, 100, 125, 150, 175, 200 and 250 mV s−1 were conducted. Electrochemical activation of 20 cycles at 20 mV s−1 in the potential range of −0.6 V to +0.6 V at 2 mV steps was then performed to activate the sample.
2.5. Experimental procedure for PCB-3T setup
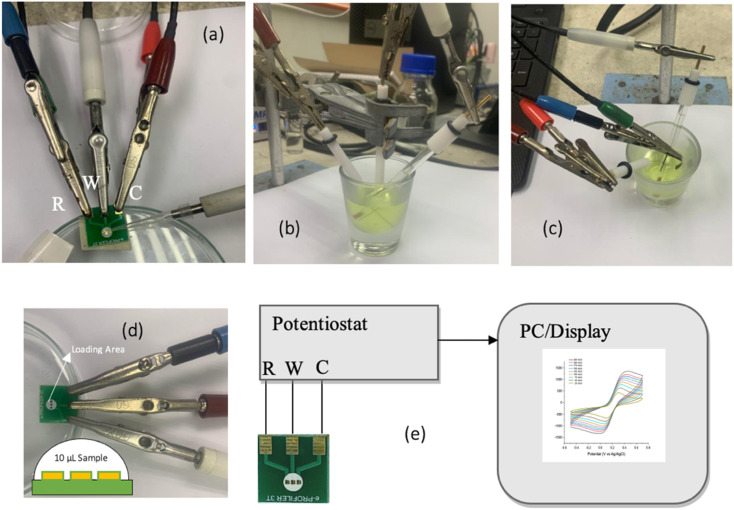
The experiments were again conducted across the two different electrochemical platforms with the RWC (Reference–Working–Counter) connection as shown in the layout in Fig. 2(a). The three gold plated electrodes in the PCB-3T were used as the reference (R), working (W), and counter (C) electrodes. A trace amount of 10 μl of the potassium ferricyanide in KCl solution was then placed on the loading area on the PCB using a micropipette and an incubation time of 1 min were allowed to stabilize the droplet at room temperature. This contrasts with the significantly higher amount (1000 times more) required for conventional setups (Fig. 2(b and c)). CV measurements based on the WRC, WCR and RWC connection layout experiments were performed and the RWC connection schematic was found to be the most optimal configuration based on the results (Section 3.3). Electrochemical activation of 4 cycles at 20 mV s−1 in the potential range of −0.5 to +0.7 V at 2 mV steps was then performed to activate the sample before acquiring CV profiles at scan rates of 25 to 250 mV s−1. The used PCB-3T sensors were simply discarded and new ones were utilized for each consecutive experiment, in contrast to the labour intensive and complicated three-electrode cleaning procedure employed for the conventional setup.
Fig. 2. (a) The miniaturized PCB-3T while being loaded with 10 μl of potassium chloride in KCL solution using a micropipette. This is shown in comparison with the amount needed for the conventional three-electrode setups with (b) GCE and (c) graphite foil counter electrodes which requires significantly more (10 ml) solution. The image in (d) shows the connection layout and (e) the schematic diagram of the PCB-3T electrochemical setup employed in this study. The insert illustration in (d) meanwhile shows the cross-sectional view of the PCB-3T system after application of the solution on the sample loading site (square white area).
3. Results and discussion
3.1. Acquisition of CV using graphite foil as working electrode
As shown in Fig. 3, the CV of potassium ferricyanide were acquired by scanning in a positive cycle from 0 to 0.7 V and in a reverse cycle from 0 to −0.5 V. The following voltammograms were received for scan rates of 25, 50, 75, 100, 125, 150, 175, 200 and 250 mV s−1 using graphite foil as working electrode, platinum wire as counter and Ag/AgCl as reference electrodes.
Fig. 3. CV profiles for 19 mM K3[Fe(CN)6] using graphite foil as the working electrode acquired from (a) Gamry Instruments Interface 1000 and (b) 1010E potentiostats.
The anodic oxidation peak of ferricyanide to ferrocyanide was observed within a potential window of 250 to 500 mV in agreement with literature.4,16 Similarly, the reversible reduction was observed in the reverse potential sweep within a window of −100 to 100 mV. It was also found that the graphite foil displayed values of current intensities depending on submerged length of the foil into the solution. As a result of different researchers submerging the electrodes to varying lengths, values of the current intensities largely differ. Current intensities were also observed to be higher when using the 1010E potentiostat since the probe connector used for this instrument is shorter confirming the effects of attenuation of current due to increasing internal resistance in longer probe length in the Gamry 1000 instrument.
3.2. Acquisition of CV using GCE as working electrode
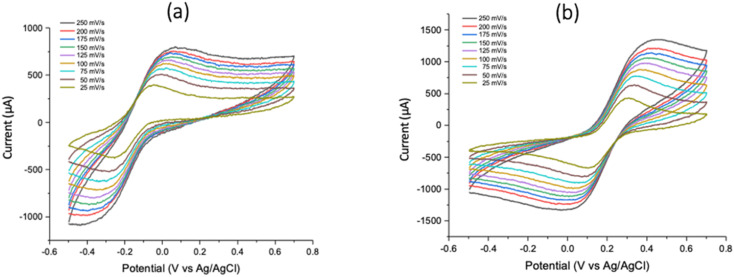
Fig. 4 shows the voltammograms acquired for scan rates of 25, 50, 75, 100, 125, 150, 175, 200 and 250 mV s−1 using GCE as the working electrode, platinum wire as counter and Ag/AgCl as reference electrodes. Results for the current working electrode choice (and for the PCB-3T) were obtained by varying the potentiostat only while maintaining the potassium ferricyanide solution and other electrodes common among the two setups. Results from 1000 and 1010E were however identical and the peak potentials exhibited for the oxidation (400 to 700 mV) and reduction (−200 to 0 mV) of ferricyanide to ferrocyanide were similar in both experiments (Fig. 4). As in the previous setup, current intensities were also observed to be lower when measured using the 1000 potentiostat due to the longer probe connector. Distorted voltammograms as shown in the figure were due to the interfacial nature of GCE interface to the solution in our experiments and the obtained CV curves do confirm to the readings as per the experiments done in other similar experiments.29,30
Fig. 4. CV profiles for 19 mM K3[Fe(CN)6] using GCE as the working electrode derived from (a) Gamry Instruments Interface 1000 and (b) 1010E potentiostats.
3.3. Acquisition and optimization of CV for PCB-3T based on terminal connections
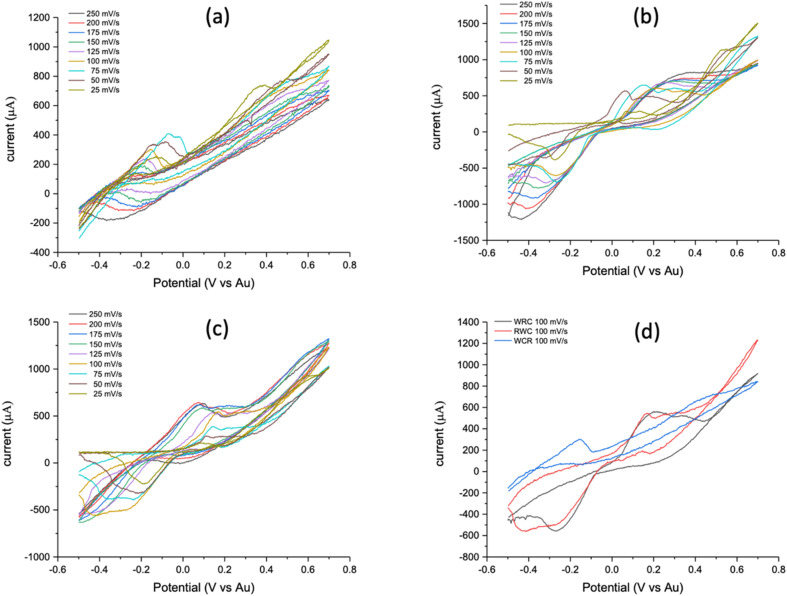
PCB-3T same metal electrode system presents a unique problem of terminal connection configuration since the electrodes are of the same metal (Au) connecting the working, counter, and reference connectors from the potentiostat. Connections can be made using the following positional connections WCR, RCW, WRC, CRW, RWC and CWR. From the analysis of these configurations, we see that WCR–RCW, WRC–CRW and RWC–CWR are mirror pairs hence we can reduce this to WCR, WRC and RWC configurations. Experiments using these three configurations were performed using 19 mM potassium ferricyanide on Gamry 1010E potentiostat at scan rates of 25, 50, 75, 100, 125, 150, 175, 200 and 250 mV s−1.
From Fig. 5(d), it can be clearly seen that the CV generated from the RWC terminal connection shows distinct and sharp oxidation and reduction potential compared to the other connections while CV curves from WCR (Fig. 5(a)) does not exhibit any reduction curves. WRC's CV (Fig. 5(b)) curve is similar to the RWC (Fig. 5(c)) but exhibits lower intensities of oxidation and reduction curves as also shown by the experiments using different scan rates and repetitions which validate the same results.
Fig. 5. CV profiles for 19 mM K3[Fe(CN)6] acquired using the PCB-3T (a) WCR, (b) WRC, (c) RWC configurations with Gamry Instruments Interface 1010E and (d) comparison of CVs from all possible terminal connections at scan rate of 100 mV s−1.
From the experimental observation, it was found that RWC had distinct bubbling at the electrode interfaces in the positive sweep of the CV and significantly higher currents. Fig. 6 shows the applied potential region based on the terminal connection configuration of the PCB-3T sensor, in case of WCR the working and reference electrodes are at maximum distance possible in the droplet region and the counter electrode is in centre of the droplet region, due to the residual charges and larger potential drop no distinct cathodic reduction is seen in Fig. 5(a). In the RWC configuration the counter electrode is outside of reference potential area and closest to the working electrode, hence it does not display any residual currents that are visible on the WCR configuration and the current flow direction between the working electrode to counter electrode has minimal interference due to the applied potential. However, in the WCR configuration, the counter electrode is in the middle of the reference potential region, hence residual charges in the region suppresses the reduction reverse currents and no distinct reduction curves were seen for this configuration. In the case of both RWC and WRC, the counter electrode is outside the potential window and hence identical CV graphs are obtained albeit the differences in the intensities of the curves. For the WRC, the charge flow path is longer as the counter electrode and working electrode are at opposite ends and distance between them is larger than the RWC configuration, this longer distance of charge path could explain the noise of the WRC graph compared to the RWC. Hence RWC connection configuration was found to be the most optimal configuration for the PCB-3T electrode system based on the CV measurements.
Fig. 6. Schematic diagram on applied potential window for the WCR, RWC and WRC configurations.
3.4. Acquisition of CV using PCB-3T same metal (RWC) electrode system
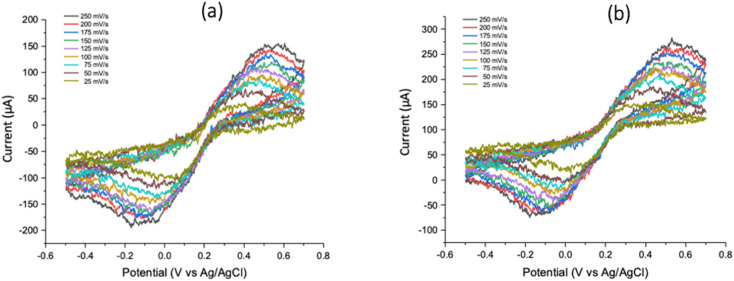
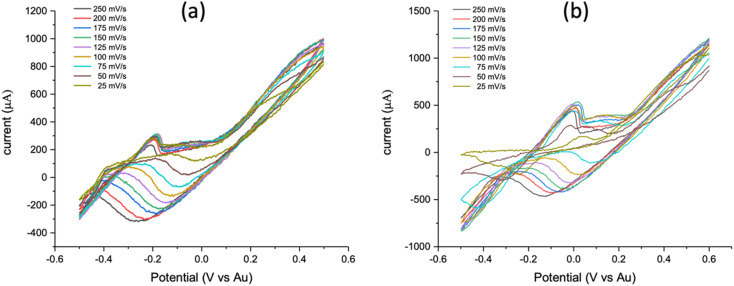
Experiments on the 1000 and 1010E potentiostat platforms were conducted using separate disposable PCB-3T electrochemical sensors as they are built for single purpose uses. Despite using two different chips for each experiment carried out using the two platforms, the results were remarkably identical and well defined when compared to the previous setups. This was corroborated by conducting multiple experiments over several repetitions where high repeatability of results was observed at all cycles as confirmed by the voltammograms in Fig. 7. Activation of PCB-3T-based electrochemical setup was also considerably lower at around only 2 to 4 cycles. Anodic oxidation current peaks were observed in the same range of potential window as seen in the conventional experiments. Additionally, we also observed cathodic reduction in the range of −100 mV to −200 mV across the multiple experiments indicating the electrochemical sensitivity of the PCB-3T system. The shift in the cathodic reduction across the experiments is mainly due to the differences in DC calibration of the potentiostat, length of terminal connectors, ambient temperature and humidity variances, and interfacial nature of the crocodile connectors to the PCB-3T sensor. However, we observed reduced current intensities for higher scan rates, whereas in conventional electrodes current intensities shift higher as scan rates increases. This can be expected since depletion of electroactive species can be assumed to occur significantly faster within the smaller droplet of solution over repeated run cycles compared to the larger volumes used in the conventional setups.
Fig. 7. CV profiles for 19 mM K3[Fe(CN)6] acquired using the PCB-3T with (a) Gamry Instruments Interface 1000 and (b) 1010E potentiostat.
Due to the surface tension induced volume of the droplet, it can be hypothesised that saturation of the redox reactions is reached within the significantly smaller volume of sample over long run cycles. This could also be one of the primary reasons as to why CV measurements across different PCB-3T chips yield significantly consistent results not achievable using conventional electrochemical setups. Surface tension causes a “container-like” adhesion effect31 when a droplet is applied on the PCB-3T establishing a more compact surface which interfaces entirely with the exposed surface area of the three gold electrodes acting as the three-electrode system. This feature possibly imparts maximum sensitivity, window of detection and standardizes possible anodic and cathodic peak current values across multiple electrochemical platforms as observed with the PCB-3T-based platforms. The microlitre volume of sample maintained in the loading area enables the potential to be more efficiently applied over a micro-droplet surface area on the working electrode which improves the sensitivity contributing to the higher repeatability and reproducibility observed in these experiments. Using the PCB-3T, distinct peaks are observed well in comparison to the conventional setups. We also observed the physical nature of the crocodile clip contacts in the form of “saw-shaped” contacts that presents some unavoidable signal spikes or uneven “jumps” due to the imperfect surface contact between the PCB-3T terminals (as with the conventional electrode systems) with the crocodile clip “teeth”. This can be avoided in future by fabricating a “push-in” type adapter for the connector probes to be connected to the terminals of the PCB-3T.
In conventional electrochemical setups, polarization due to different electrodes used often results in significant potential drops that reduces the sensitivity on analyte detection. In this report, electrodes of the same material utilized therefore fundamentally avoids the occurrences of the electrode polarization at the electrode–electrolyte interface and therefore potentially increase sensitivity. This however does not explain why electrochemical reactions are observed when using same metal configuration for the three electrodes. This can however be convincingly explained when considering the RWC connection configuration. In the RWC configuration, the potential is applied in the R–W electrodes of the droplet area which establishes an evenly distributed potential window in this region. The counter electrode being connected outside of the region collects the current without disturbing the potential region and therefore the counter electrode allows for optimal collection of current and charge movement due to the redox process occurring in the electrolyte. As expected, no current flow was observed between the reference and working electrodes upon checking with a Fluke digital multimeter.
3.5. Acquisition of CV for different concentrations of potassium ferricyanide solution
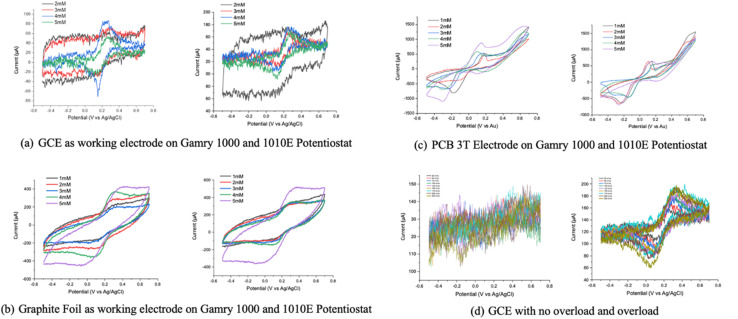
Voltammograms were also acquired using different concentrations of potassium ferricyanide solution using the three different electrochemical setups (Fig. 8). In general, all electrode configurations portray current–voltage profiles which respond linearly as expected. However, the GCE electrode does not exhibit any reduction curve due to generation of inconclusive readings at lower concentration (1 mM) of potassium ferricyanide solution (Fig. 8(a)). The PCB-3T and graphite foil setups meanwhile were able to detect CV at 1 mM concentration. However, the graphite foil does not exhibit sharp reduction curve at −0.2 V when compared to the PCB-3T sensor.
Fig. 8. CV profiles from Gamry Interface 1000 and Interface 1010E for potassium ferricyanide of different concentrations at 50 mV s−1 scan rate using the (a) conventional GCE and (b) graphite foil three-electrode setups, (c) using the PCB-3T electrochemical sensor and (d) GCE electrode with and without overload.
For GCE experiments (Fig. 8(d)), we were able to notice the redox reaction currents only after an overload was applied momentarily before the readings. For 2, 3, 4 and 5 mM concentrations, the system was overloaded by removing the reference electrode and swept in positive direction between 0 to 0.7 V. Overloading resulted in bubbling at the platinum electrode and was sustained for 10 s. This was then followed by the regular CV readings at the defined scan rates of 25 to 250 mV s−1 where we observed that only experiments with the overload provided the redox graphs with the typical current peaks using GCE occurring at 200 μA. For PCB-3T experiments however redox reactions were consistently noticed even at low concentrations of 1 mM with very few activation cycles and no overloads. The higher current in the range of 700–900 μA were consistently observed on the PCB-3T experiments unlike the GCE electrode.
Graphite foil experiments (Fig. 8(b)) also provided consistent redox curves but lacked the sharp redox curve regions displayed on the 3PCB-3T and after overloading GCE-based curves. Current range was the highest peaking close to 1 mA in some cases. The current intensity of the graphite foil experiments was highly dependent on the length of the foil immersed into the solution. In this case, approximately 5 mm of foil immersion into the solution was maintained for all the concentrations as the standard. In case of GCE and graphite foil experiments, the same electrodes and solution were utilized to measure the CV using Gamry Interface 1000 and Gamry Interface 1010E potentiostat. However, in the case of PCB-3T, every CV experiment was performed on a fresh electrode and despite 10 different sensors being used in these experiments, results demonstrated remarkable consistency and repeatability as shown in Fig. 8(c).
4. Conclusions
Electrochemical setup using the disposable PCB-3T sensors exhibited reversible voltammogram profiles as also shown by the conventional three-electrode systems. The simple and user-friendly PCB-3T unconventional same metal electrodes required only a few activation cycles, also exhibited higher sensitivity, selectively and detection limit. The design of electrodes totally submerged into the micro-droplet surface-tension defined solution volume enables these features for effective electrochemical sensing capability. Further the RWC connection of the same metal configuration improves current resolution and sensitivity by inhibiting polarization effect and therefore the potential drops across dissimilar electrodes. The proposed same metal three-electrode configuration used in this study for the first time demonstrated reproducible voltammograms across different electrochemical platforms. As such, we believe that this unconventional approach in conducting three-electrode electrochemical measurements may prove to be valuable to researchers working in related fields of study.
Author contributions
V. Periasamy and G. Kumar provided the supervision and wrote the manuscript; P. N. Elumalai performed all experimental works and wrote the manuscript. M. Iwamoto, R. T. Subramaniam, R. Kasi and S. Talebi provided supervision and discussion; All authors have read and approved the final version of the manuscript.
Conflicts of interest
There are no conflicts to declare.
Supplementary Material
Acknowledgments
The authors would like to acknowledge M. Pershaanaa, CIUM, Universiti Malaya for assisting in the training and usage of Gamry Potentiostat 1000E and 1010E instruments. This research was financially supported by the Ministry of Higher Education Malaysia grant (FRGS/1/2022/STG05/UM/01/2 - FP081/2022).
Notes and references
- Elgrishi N. Rountree K. J. McCarthy B. D. Rountree E. S. Eisenhart T. T. Dempsey J. L. J. Chem. Educ. 2018;95:197–206. [Google Scholar]
- Aristov N. Habekost A. World J. Chem. Educ. 2015;3:115–119. [Google Scholar]
- Koç Y. Uğur M. Erol S. Avci H. Turk. J. Chem. 2021;45(6):1895–1915. doi: 10.3906/kim-2105-55. [DOI] [PMC free article] [PubMed] [Google Scholar]
- Niranjana E. Kumara Swamy B. E. Raghavendra Naik R. Sherigara B. S. Jayadevappa H. J. Electroanal. Chem. 2009;631:1–9. [Google Scholar]
- Kang J. Kim T. Tak Y. Lee J.-H. Yoon J. J. Ind. Eng. Chem. 2012;18:800–807. [Google Scholar]
- Wang H.-W. Bringans C. Hickey A. J. R. Windsor J. A. Kilmartin P. A. Phillips A. R. J. Signals. 2021;2:138–158. [Google Scholar]
- Patel J. Radhakrishnan L. Zhao B. Uppalapati B. Daniels R. C. Ward K. R. Collinson M. M. Anal. Chem. 2013;85:11610–11618. doi: 10.1021/ac403013r. [DOI] [PubMed] [Google Scholar]
- Taurino I. Carrara S. Giorcelli M. Tagliaferro A. De Micheli G. Surf. Sci. 2012;606:156–160. [Google Scholar]
- Hirbodvash Z. Houache M. S. E. Krupin O. Khodami M. Northfield H. Olivieri A. Baranova E. A. Berini P. Chemosensors. 2021;9:277. [Google Scholar]
- Vonau W. Oelßner W. Guth U. Henze J. Sens. Actuators, B. 2010;144:368–373. [Google Scholar]
- Shinwari M. W. Zhitomirsky D. Deen I. A. Selvaganapathy P. R. Deen M. J. Landheer D. Sensors. 2010;10:1679–1715. doi: 10.3390/s100301679. [DOI] [PMC free article] [PubMed] [Google Scholar]
- Streeter I. Wildgoose G. G. Shao L. Compton R. G. Sens. Actuators, B. 2008;133:462–466. [Google Scholar]
- Meloni G. N. J. Chem. Educ. 2016;93:1320–1322. [Google Scholar]
- Dawkins R. C. Wen D. Hart J. N. Vepsäläinen M. Electrochim. Acta. 2021;393:139043. [Google Scholar]
- Xu X. Yu Y. Hu Q. Chen S. Nyholm L. Zhang Z. ACS Sens. 2021;6:2546–2552. doi: 10.1021/acssensors.0c02700. [DOI] [PMC free article] [PubMed] [Google Scholar]
- Pandurangachar B. E. K. S. M. Chandrashekar B. N. Gilbert O. Reddy S. Sherigara B. S. Int. J. Electrochem. Sci. 2010;5:1187–1202. [Google Scholar]
- Hu C. Hu S. Electrochim. Acta. 2004;49:405–412. [Google Scholar]
- O'Reilly J. E. Biochim. Biophys. Acta, Bioenerg. 1973;292:509–515. doi: 10.1016/0005-2728(73)90001-7. [DOI] [PubMed] [Google Scholar]
- Hoar B. B. Zhang W. Xu S. Deeba R. Costentin C. Gu Q. Liu C. ACS Meas. Sci. Au. 2022;2(6):595–604. doi: 10.1021/acsmeasuresciau.2c00045. [DOI] [PMC free article] [PubMed] [Google Scholar]
- Arslan F. Beskan U. Artif. Cells, Nanomed., Biotechnol. 2014;42:284–288. doi: 10.3109/21691401.2013.812650. [DOI] [PubMed] [Google Scholar]
- Saha S. Arya S. K. Singh S. P. Sreenivas K. Malhotra B. D. Gupta V. Anal. Chim. Acta. 2009;653:212–216. doi: 10.1016/j.aca.2009.09.002. [DOI] [PubMed] [Google Scholar]
- VanDersarl J. J. Mercanzini A. Renaud P. Adv. Funct. Mater. 2015;25:78–84. [Google Scholar]
- Liu Y. Kim H. Franklin R. Bond D. R. Energy Environ. Sci. 2010;3:1782–1788. [Google Scholar]
- Kim S. K. Hesketh P. J. Li C. Thomas J. H. Halsall H. B. Heineman W. R. Biosens. Bioelectron. 2004;20:887–894. doi: 10.1016/j.bios.2004.04.004. [DOI] [PubMed] [Google Scholar]
- Balasubramanian S. Revzin A. Simonian A. Electroanalysis. 2006;18:1885–1892. [Google Scholar]
- Burke L. D. Moran J. M. Nugent P. F. J. Solid State Electrochem. 2003;7:529–538. [Google Scholar]
- Talebi S. Daraghma S. Subramaniam R. Bhassu S. Kumar G. Periasamy V. ACS Omega. 2020;5(14):7802–7808. doi: 10.1021/acsomega.9b03831. [DOI] [PMC free article] [PubMed] [Google Scholar]
- Daraghma S. M. A. Talebi S. Periasamy V. J. Electron. Mater. 2021;50:1267–1274. [Google Scholar]
- Shashanka R. Kumara Swamy B. E. SN Appl. Sci. 2020;2:956. [Google Scholar]
- Kim D. Lee S. Piao Y. J. Electroanal. Chem. 2017;794:221–228. [Google Scholar]
- Baroud C. N. Gallaire F. Dangla R. Lab Chip. 2010;10:2032–2045. doi: 10.1039/c001191f. [DOI] [PubMed] [Google Scholar]


