Abstract
YAP/TAZ transcriptional co‐activators play pivotal roles in tumorigenesis. In the Hippo pathway, diverse signals activate the MST‐LATS kinase cascade that leads to YAP/TAZ phosphorylation, and subsequent ubiquitination and proteasomal degradation by SCFβ‐TrCP. When the MST‐LATS kinase cascade is inactive, unphosphorylated or dephosphorylated YAP/TAZ translocate into the nucleus to mediate TEAD‐dependent gene transcription. Hippo signaling‐independent YAP/TAZ activation in human malignancies has also been observed, yet the mechanism remains largely elusive. Here, we report that the ubiquitin E3 ligase HERC3 can promote YAP/TAZ activation independently of its enzymatic activity. HERC3 directly binds to β‐TrCP, blocks its interaction with YAP/TAZ, and thus prevents YAP/TAZ ubiquitination and degradation. Expression levels of HERC3 correlate with YAP/TAZ protein levels and expression of YAP/TAZ target genes in breast tumor cells and tissues. Accordingly, knockdown of HERC3 expression ameliorates tumorigenesis of breast cancer cells. Our results establish HERC3 as a critical regulator of the YAP/TAZ stability and a potential therapeutic target for breast cancer.
Keywords: HECT domain, Hippo signaling, Tumor progression, β‐TrCP/FBW1A
Subject Categories: Cancer, Post-translational Modifications & Proteolysis
Degradation of two Hippo pathway effectors via the SCFβ‐TrCP ubiquitin ligase complex is unexpectedly prevented by another E3 ligase blocking their interaction.

Introduction
Yes‐associated protein (YAP) and its ortholog transcriptional co‐activator with PDZ‐binding motif (TAZ) are key effectors of the Hippo pathway (Moya & Halder, 2019; Zheng & Pan, 2019; Wu & Guan, 2021). When multiple signals switch on the Hippo pathway, the Hippo kinases (mammalian Ste20‐like 1 and 2, MST1/2) phosphorylate large tumor suppressors 1 and 2 (LATS1/2), which in turn phosphorylate YAP and TAZ (collectively called YAP/TAZ in the following for simplicity). Phosphorylated YAP/TAZ become sequestered by 14‐3‐3 proteins in the cytoplasm, or bind to a ubiquitin ligase beta‐transducin repeat‐containing protein (β‐TrCP) for ubiquitination and proteasomal degradation (Zhao et al, 2007, 2010; Lei et al, 2008; Huang et al, 2012). When cells are under mechanical tension or treated by GPCR ligands such as lysophosphatidic acid (LPA) and sphingosine‐1‐phosphate (S1P), the Hippo (MST‐LATS) cascade is inactivated and YAP/TAZ are consequently unphosphorylated. Activated YAP/TAZ accumulate in the nucleus, and mainly bind to the TEAD family transcription factors to control target gene transcription involved in cellular functions (Varelas, 2014; Hansen et al, 2015; Pocaterra et al, 2020). In consistence, abnormal activation of YAP/TAZ is frequently observed in cancer. Several mechanisms underlie YAP/TAZ activation in cancer, including genomic amplification, gene fusion, mutation of NF2, Gq/G11, and other Hippo pathway upstream components (Ma et al, 2019; Heng et al, 2021). In breast cancer, elevated protein levels of YAP/TAZ are associated with poor clinical outcomes frequently along with enhancement of proliferation, metastasis, and cancer stem cell features and drug resistance (Maugeri‐Sacca et al, 2015; Moroishi et al, 2015; Zhao et al, 2021). In breast cancer cells, YAP and TAZ are also activated through inhibitory tyrosine phosphorylation of LATS (Si et al, 2017; Kedan et al, 2018), ubiquitination of upstream NF2 by BRCA1 (Verma et al, 2019), or disruption of interaction between TAZ and LATS2 by SnoN (Zhu et al, 2016). However, mechanisms underlying increased YAP/TAZ levels independent of the Hippo pathway are poorly understood (Totaro et al, 2018; Dey et al, 2020).
The HECT/RLD‐containing ubiquitin ligase 3 (HERC3) is a member of the HECT family ubiquitin ligase. It contains an RCC1‐like domain (RLD) and a conserved catalytic HECT domain (Sanchez‐Tena et al, 2016). It has been reported that HERC3 promotes degradation of c‐Myc modulator MM1, thus inhibiting cell senescence (Chen et al, 2018). HERC3 could also facilitate ubiquitination‐mediated degradation of SMAD7 to positively regulate TGF‐β signaling in glioblastoma (Li et al, 2019). Recent studies found that HERC3 targets degradation of EIF5A2 and RPL23A to potentially block cell proliferation and metastasis in colorectal cancer (Zhang et al, 2022a, 2022b). In addition, HERC3 promotes RelA degradation independent of its E3 activity to inhibit NF‐κB signaling (Hochrainer et al, 2015). These few findings only begin to reveal an expanding role of HERC3 in cancer (Mao et al, 2018; Sala‐Gaston et al, 2020). Identification of new cellular substrates and/or E3‐indpendent interacting partners of HERC3 should help understand its physiological and pathological functions.
In this study, we report that HERC3 stabilizes YAP/TAZ independent of its ubiquitin ligase activity. We found that HERC3 interacted with β‐TrCP, subsequently blocked the binding of YAP/TAZ to β‐TrCP, and antagonized SKP1‐CUL1‐F‐box ubiquitin ligase SCFβ‐TrCP‐mediated ubiquitination and proteasomal degradation of YAP/TAZ. We further demonstrated that depletion of HERC3 inhibited proliferation and metastasis of breast cancer cells in a YAP/TAZ‐dependent manner. Importantly, HERC3 was upregulated in breast cancer specimens and its higher expression not only correlated with YAP/TAZ level but also negatively correlated with patient survival. Our work unveils HERC3 as an important regulator of YAP/TAZ in breast cancer.
Results
HERC3 regulates the stability and transcriptional responses of YAP/TAZ
In a search for ubiquitin E3 ligases that regulate YAP and TAZ activation, we found that ectopic expression of HERC3 could increase, rather than decrease, the YAP and TAZ protein levels (Fig 1A). We also examined the effect of HERC3 on phosphorylation of YAP at Ser‐381, which can recruit the SCFβ‐TrCP E3 ligase for ubiquitination‐dependent degradation of YAP, and phosphorylation of YAP at Ser‐127 and TAZ at Ser‐89, which can result in their 14‐3‐3‐dependent cytoplasmic sequestration (Yu et al, 2015). We found that stable expression of HERC3 also increased the levels of non‐phosphorylated YAP (active YAP) and p‐YAP (S381), whereas it had no apparent impact on p‐YAP (S127) or p‐TAZ (S89) in MDA‐MB‐231 breast cancer cells (Fig 1A, lane 2). Interestingly, the catalytically inactive Cys‐to‐Ala mutant of HERC3 (HERC3‐CA) retained the ability to enhance YAP/TAZ protein levels (Fig 1A, lane 3). Upon serum starvation or treatment of Latrunculin B (LatB, a cytoskeleton‐disrupting reagent), expression of HERC3 also profoundly increased the levels of YAP/TAZ as well as active YAP and p‐YAP (S381), but not those of p‐YAP (S127) and p‐TAZ (S89) (Figs 1B and EV1A). HERC3‐WT and HERC3‐CA similarly enhanced the YAP/TAZ protein levels (Fig 1B, lanes 4 and 6). HERC3, but not HERC3‐CA, could cause degradation of MM1, validating the catalytic inactivity of HERC3‐CA (Fig EV1B).
Figure 1. HERC3 regulates the stability and transcriptional responses of YAP/TAZ.
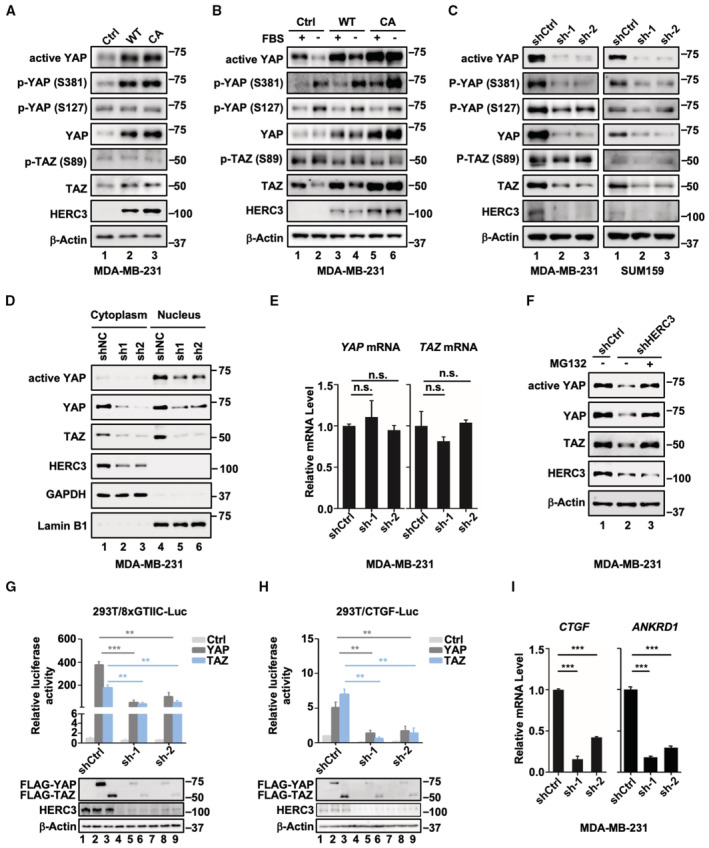
- HERC3 increases the protein levels of active YAP, p‐YAP (S381), YAP, and TAZ. Active‐YAP, p‐YAP (S381), p‐YAP (S127), YAP, p‐TAZ (S89), TAZ, HERC3, and β‐actin were detected by Western blotting with appropriate antibodies as indicated in MDA‐MB‐231 cells stably expressing HERC3‐WT or HERC3‐CA. Ctrl, Control; WT, wild type of HERC3; CA, HERC3‐CA, a catalytically inactive mutant of HERC3.
- HERC3 reverses the reduction in the active YAP and TAZ levels induced by serum starvation. MDA‐MB‐231 cells stably expressing HERC3 or HERC3‐CA were cultured in medium with or without fetal bovine serum (FBS) for 1 h. Cells were harvested for Western blotting analysis with appropriate antibodies as indicated. Ctrl, Control; WT, wild type of HERC3; CA, HERC3‐CA, a catalytically inactive mutant of HERC3.
- Depletion of HERC3 decreases the steady‐state levels of YAP/TAZ. Levels of active‐YAP, p‐YAP (S381), p‐YAP (S127), YAP, p‐TAZ (S89), TAZ, HERC3, and β‐actin were detected by Western blotting with appropriate antibodies as indicated in MDA‐MB‐231 and SUM159 cells stably expressing shCtrl (Control shRNA) and sh‐1 and sh‐2 (two shRNAs against HERC3).
- Depletion of HERC3 leads to decreased YAP/TAZ levels in both the cytoplasm and nucleus. Cytosolic and nuclear fractions were extracted and then detected in Western blotting with appropriate antibodies.
- Depletion of HERC3 has no effects on mRNA levels of YAP/TAZ. Total mRNA levels of YAP/TAZ in control or HERC3‐deficient MDA‐MB‐231 cells were analyzed by qRT–PCR using primers specific to YAP/TAZ. Data are shown as mean ± SEM; n = 3 biological replicates. Statistical analysis was performed using two‐tailed Student's t‐test. n.s., not significant.
- Proteasome inhibitor MG132 reverses shHERC3‐induced downregulation of endogenous YAP/TAZ. Control or HERC3‐deficient MDA‐MB‐231 cells were treated with MG132 (20 μM) for 6 h. Cell lysates were analyzed by Western blotting using anti‐YAP, anti‐TAZ, anti‐HERC3, and anti‐β‐actin antibodies.
- Depletion of HERC3 attenuates YAP‐ or TAZ‐induced 8xGTIIC‐Luc reporter activity. HEK293T cells were transfected with expression plasmids for YAP or TAZ, shHERC3 or shCtrl, and reporter plasmids 8xGTIIC‐Luc and Renilla‐Luc as indicated. Relative luciferase activity was measured as described in the text. Western blots showing expression of indicated proteins are shown. Data are shown as mean ± SEM; n = 3 biological replicates. Statistical analysis was performed using two‐tailed Student's t‐test. **P < 0.01, ***P < 0.001.
- Depletion of HERC3 attenuates YAP‐ or TAZ‐induced CTGF‐Luc reporter activity. Cell transfection and luciferase assay were carried out as described in Panel G. Western blots showing expression of indicated proteins were shown. Data are shown as mean ± SEM; n = 3 biological replicates. Statistical analysis was performed using two‐tailed Student's t‐test. **P < 0.01.
- Depletion of HERC3 attenuates transcription of YAP/TAZ target genes. Total mRNA levels of CTGF and ANKRD1 in control or HERC3‐deficient MDA‐MB‐231 cells were analyzed by qRT–PCR using primers specific to the indicated target gene. Data are shown as mean ± SEM; n = 3 biological replicates. Statistical analysis was performed using two‐tailed Student's t‐test. ***P < 0.001.
Source data are available online for this figure.
Figure EV1. HERC3 regulates the stability and transcriptional responses of YAP/TAZ.
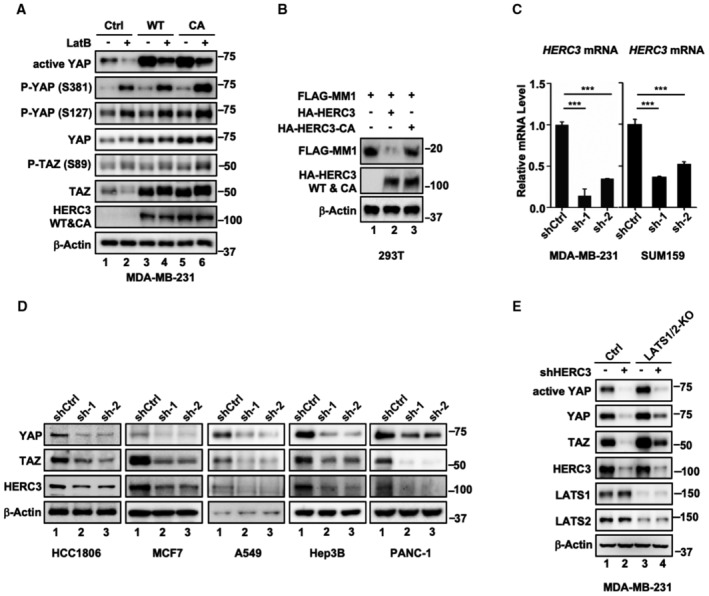
- HERC3 and HERC3‐CA reverse the reduction in the YAP/TAZ levels induced by LatB. MDA‐MB‐231 cells stably expressing HERC3 or HERC3‐CA were cultured in a medium with or without LatB (1 μg/ml) for 30 min. Cells were harvested for Western blotting analysis with appropriate antibodies as indicated.
- HERC3, but not HERC3‐CA, causes MM1 degradation. HEK293T cells were transfected with expression plasmids for HA‐HERC3, HA‐HERC3‐CA, and FLAG‐MM1 as indicated. Cells were harvested 24 h post‐transfection and subjected to Western blotting analysis with FLAG, HA, and β‐actin antibodies.
- HERC3 is efficiently knocked down by shRNA. Total mRNA levels of HERC3 in control or HERC3‐deficient MDA‐MB‐231 cells and SUM159 cells were analyzed by qRT–PCR using primers specific to the indicated target gene. Data are shown as mean ± SEM; n = 3 biological replicates. Statistical analysis was performed using two‐tailed Student's t‐test. ***P < 0.001.
- Depletion of HERC3 decreases the steady‐state levels of YAP/TAZ. HCC1806, MCF7, A549, Hep3B, and PANC‐1 cells were stably expressing shCtrl (Control shRNA) and sh‐1 and sh‐2 (shRNAs against HERC3). Western blotting was carried out to detect levels of YAP, TAZ, HERC3, and β‐actin with appropriate antibodies as indicated.
- Depletion of HERC3 decreases the steady‐state levels of YAP/TAZ in LATS1/2‐KO cells. Western blotting was done as described in panel D. LATS1/2‐KO, double knockout of LATS1 and LATS2 in MDA‐MB‐231 cells stably expressing shCtrl and shHERC3.
Source data are available online for this figure.
Depletion of HERC3 with two independent shRNAs (shHERC3) was stably established in MDA‐MB‐231 and SUM159 cells (Fig EV1C). shHERC3 drastically reduced the protein levels of active YAP, YAP, TAZ, and p‐YAP (S381), but did not or weakly affect those of p‐YAP (S127) and p‐TAZ (S89) (Fig 1C). Similar effects of HERC3 knockdown on the steady‐state levels of YAP/TAZ were also observed in a number of cancer cell lines (Fig EV1D). Even in the absence of LATS1/2 which led to increased levels of YAP/TAZ proteins, HERC3 knockdown could still markedly reduce the accumulated YAP/TAZ proteins (Fig EV1E). Although HERC3 is a cytoplasmic protein, its depletion impacted the YAP/TAZ protein levels in both the cytoplasm and the nucleus (Fig 1D). The YAP/TAZ‐reducing effect of HERC3 was apparently not attributed to reduced transcription of YAP/TAZ, as HERC3 deficiency had no or little effects on the YAP/TAZ mRNA levels (Fig 1E). Notably, proteasome inhibitor MG132 could partially restore levels of YAP/TAZ proteins in HERC3‐depleted cells (Fig 1F). Taken together, these data suggest that HERC3 regulates YAP/TAZ stability in a manner independent of its E3 activity.
We next examined the effects of HERC3 depletion on YAP/TAZ transcriptional activity. Using luciferase reporters driven by a synthetic 8xGTIIC motif (Dupont et al, 2011) or a natural connective tissue growth factor (CTGF) promoter (Zhao et al, 2008), both were strongly induced by YAP/TAZ, we found that depletion of endogenous HERC3 markedly repressed YAP/TAZ transcriptional activity (Fig 1G and H). Moreover, knockdown of HERC3 in MDA‐MB‐231 cells profoundly reduced expression of YAP/TAZ target genes, CTGF and ankyrin repeat domain 1 (ANKRD1) (Fig 1I). These results indicate a critical role of HERC3 in promoting YAP/TAZ‐mediated transcription.
HERC3 promotes stability of YAP/TAZ by blocking β‐TrCP
Given that HERC3 promotes YAP/TAZ stability independent of its E3 activity, we reasoned that HERC3 might interfere with another E3 ligase, for instance, well‐characterized ubiquitin ligase SCFβ‐TrCP (Zhao et al, 2010; Huang et al, 2012), targeting YAP/TAZ for degradation. To this end, we sought to determine whether HERC3 influenced SCFβ‐TrCP to regulate YAP/TAZ stability. As expected, β‐TrCP could reduce the TAZ protein levels. Both HERC3 wild type and the CA mutant reversed the β‐TrCP effect (Fig 2A). As a result, HERC3 abolished the ability of β‐TrCP to antagonize TAZ‐mediated CTGF‐Luc reporter activity (Figs 2B and EV2A), clearly without affecting the protein levels of β‐TrCP1 or β‐TrCP2 (Fig EV2B). Overexpression of HERC3 or HERC3‐CA apparently blocked β‐TrCP‐induced TAZ ubiquitination (Fig 2C). In the cycloheximide pulse‐chase assay, both HERC3 wild type and the CA mutant profoundly stabilized YAP/TAZ proteins (Fig 2D). When HERC3 was depleted, endogenous TAZ ubiquitination was markedly increased (Fig 2E). Similar to TAZ, ubiquitination of YAP was also inhibited by HERC3 in an E3 activity‐independent manner (Fig EV2C). In accordance, HERC3 depletion markedly accelerated degradation of endogenous YAP/TAZ proteins (Fig 2F). Notably, knockdown of β‐TrCP (Fig EV2D) could rescue the YAP/TAZ protein levels (Fig 2G) and transcriptional activities in HERC3‐depleted MDA‐MB‐231 cells (Fig 2H). Taken together, HERC3 plays a critical role in maintaining YAP/TAZ stability by antagonizing β‐TrCP.
Figure 2. HERC3 blocks β‐TrCP‐mediated ubiquitination and proteasomal degradation of YAP/TAZ.
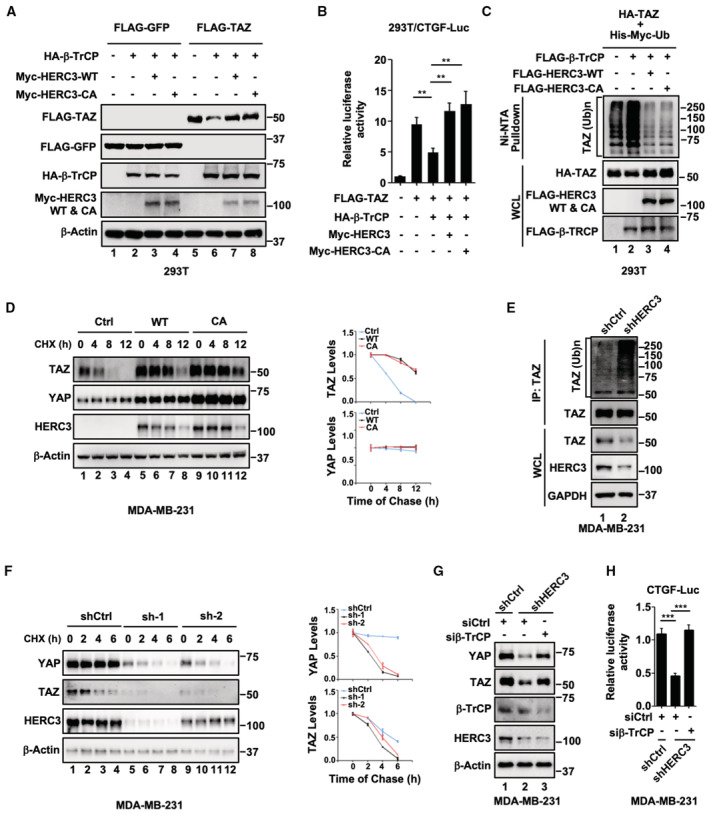
- HERC3 and HERC3‐CA block β‐TrCP‐mediated degradation of TAZ. HEK293T cells were transfected with expression plasmids for HA‐β‐TrCP, Myc‐HERC3 or Myc‐HERC3‐CA, and FLAG‐TAZ or FLAG‐GFP as indicated. Cells were harvested 24 h post‐transfection. Protein levels were detected by Western blotting with appropriate antibodies as indicated.
- HERC3 and HERC3‐CA reverse β‐TrCP‐mediated reduction in CTGF‐Luc reporter gene activity. Cell transfection and luciferase assay were carried out as described in Fig 1G. Data are shown as mean ± SEM; n = 3 biological replicates. Statistical analysis was performed using two‐tailed Student's t‐test. **P < 0.01.
- HERC3 and HERC3‐CA attenuate β‐TrCP‐mediated ubiquitination of TAZ. HEK293T cells were transfected with expression plasmids for His‐Myc‐ubiquitin and HA‐TAZ, FLGA‐β‐TRCP, FLAG‐HERC3, or FLAG‐HERC3‐CA as indicated. A total of 24 h after transfection, ubiquitinated proteins were pulled down using nickel‐nitrilotriacetic acid (Ni‐NTA) beads and the ubiquitinated TAZ proteins were analyzed using anti‐HA antibody.
- HERC3 and HERC3‐CA extend the half‐life of TAZ. Control or HERC3‐deficient MDA‐MB‐231 cells were treated with cycloheximide (CHX, 10 μg/ml) for 0, 4, 8, or 12 h before harvest. Left, Western blotting with appropriate antibodies. Right, Image J quantitation of YAP intensity and normalized to β‐actin at the indicated time points (n = 3 biological replicates). Data are represented as the mean ± SEM (right panel).
- Depletion of HERC3 increases endogenous TAZ ubiquitination. Control or HERC3‐deficient MDA‐MB‐231 cells were treated with MG132 (20 μM) for 6 h. Cells were harvested to detect endogenous TAZ ubiquitination by immunoprecipitation (IP) and Western blotting with appropriate antibodies as indicated.
- Depletion of HERC3 decreases the half‐life of YAP/TAZ. Control or HERC3‐deficient MDA‐MB‐231 cells were treated with cycloheximide (CHX, 10 μg/ml) for 0, 2, 4, or 6 h before harvested. Left, Western blotting with appropriate antibodies. Right, Image J quantitation of YAP intensity and normalized to β‐actin at the indicated time points (n = 3 biological replicates). Data are represented as the mean ± SEM (right panel).
- Depletion of β‐TrCP reverses shHERC3‐induced degradation of YAP/TAZ. Control or HERC3‐deficient MDA‐MB‐231 were transfected with siCtrl or siβ‐TrCP as indicated. Cells were harvested 48 h post‐transfection. Protein levels were detected by Western blotting with appropriate antibodies as indicated.
- Depletion of β‐TrCP reverses shHERC3‐induced repression of CTGF‐Luc reporter activity. Control or HERC3‐deficient MDA‐MB‐231 were transfected with CTGF‐Luc, Renilla‐Luc, siCtrl, or siβ‐TrCP as indicated. Cells were then harvested and subject to luciferase assay as described in Fig 1G. Data are shown as mean ± SEM; n = 3 biological replicates. Statistical analysis was performed using two‐tailed Student's t‐test. ***P < 0.001.
Source data are available online for this figure.
Figure EV2. HERC3 blocks β‐TrCP‐mediated ubiquitination and proteasomal degradation of YAP/TAZ.
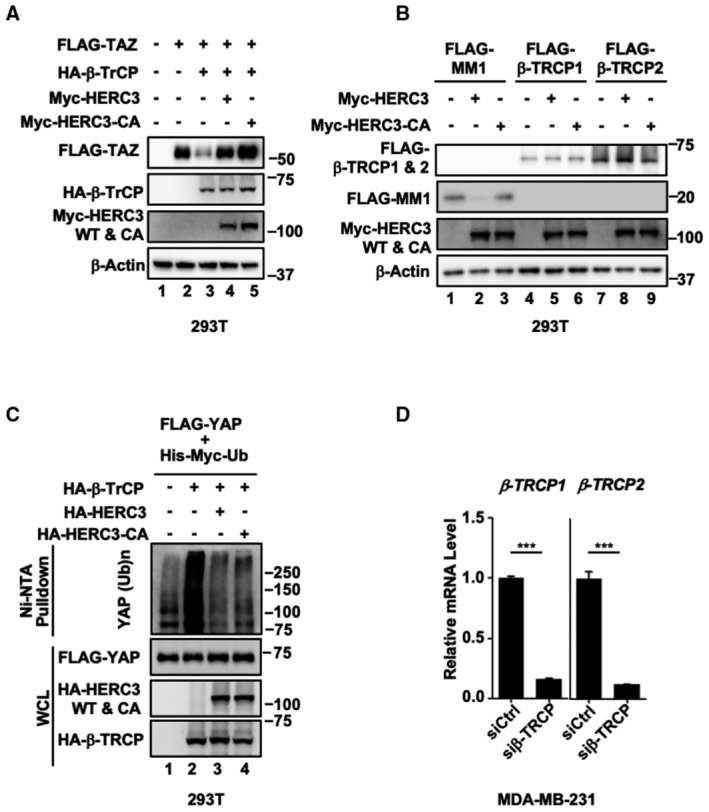
- Western blots showing relevant protein levels in Fig 2B.
- HERC3 does not affect the protein levels of β‐TrCP1 and β‐TrCP2. HEK293T cells were transfected with expression plasmids for Myc‐HERC3, Myc‐HERC3‐CA, FLAG‐MM1, FLAG‐β‐TrCP1, and FLAG‐β‐TrCP2 as indicated. Cells were harvested 24 h post‐transfection and subjected to Western blotting analysis with FLAG, Myc, and β‐actin antibodies.
- HERC3 and HERC3‐CA attenuate β‐TrCP‐mediated ubiquitination of YAP. HEK293T cells were transfected with expression plasmids for His‐Myc‐ubiquitin and FLAG‐YAP, HA‐β‐TrCP, HA‐HERC3, or HA‐HERC3‐CA as indicated. A total of 24 h after transfection, ubiquitinated proteins were pulled down using Ni‐NTA beads and the ubiquitinated YAP proteins were analyzed by using anti‐FLAG antibody.
- β‐TrCP1 and β‐TrCP2 were efficiently knocked down by siRNA. Total mRNA levels of β‐TrCP1 and β‐TrCP2 in MDA‐MB‐231 cells were analyzed by qRT–PCR using primers specific to the indicated target gene. Data are shown as mean ± SEM; n = 3 biological replicates. Statistical analysis was performed using two‐tailed Student's t‐test. ***P < 0.001.
Source data are available online for this figure.
HERC3 inhibits the association of β‐TrCP with YAP/TAZ
To understand how HERC3 antagonizes β‐TrCP‐mediated YAP/TAZ degradation, we assessed the physical interactions between HERC3 and β‐TrCP or YAP/TAZ in co‐immunoprecipitation (co‐IP) experiments. We found that HERC3 strongly interacted with β‐TrCP (Fig 3A, lane 4), but not YAP or TAZ (Fig 3A, lanes 2 and 3). The HERC3‐CA mutant was also associated with β‐TrCP as equally well as wild‐type HERC3 (Fig 3B, lanes 2 and 4). Moreover, recombinant HERC3 and HERC3‐CA bound directly to β‐TrCP in vitro (Fig 3C, lanes 3 and 4).
Figure 3. HERC3 inhibits the association of β‐TrCP with YAP/TAZ.
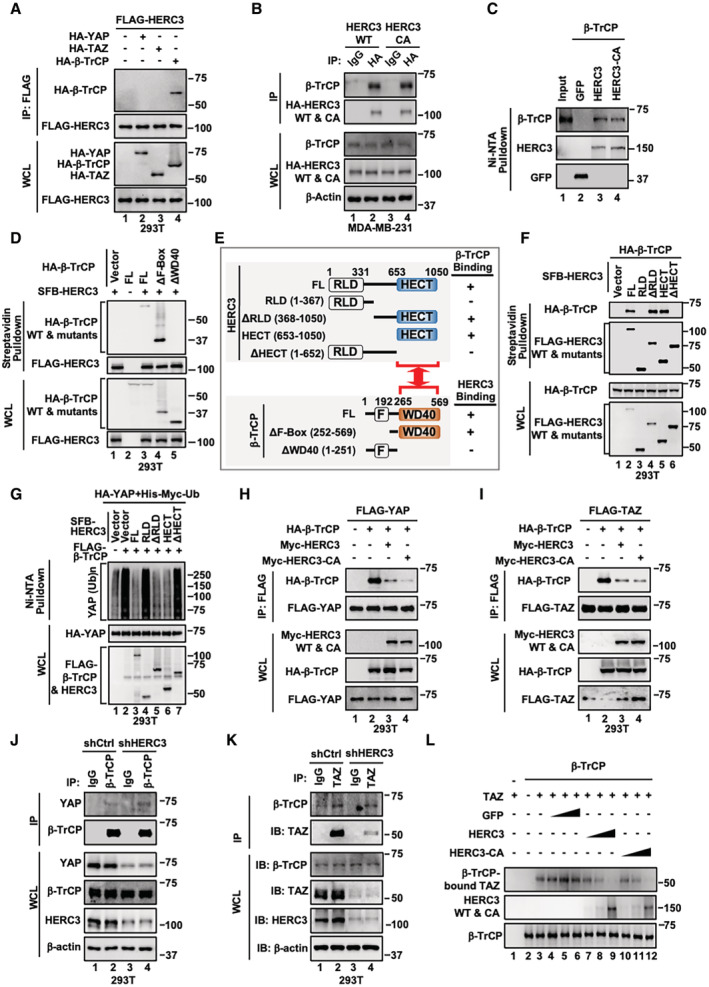
- HERC3 interacts with β‐TrCP, but not YAP or TAZ. HEK293T cells were transfected with expression plasmids for FLAG‐HERC3, HA‐YAP, HA‐TAZ, or HA‐β‐TrCP. Cells were harvested 24 h post‐transfection and subjected to IP with FLAG antibody‐conjugated agarose beads. Protein levels were detected by Western blotting with HA and FLAG antibodies.
- HERC3 interacts with endogenous β‐TrCP. MDA‐MB‐231 cells stably expressing HERC3 or HERC3‐CA were harvested and subjected to IP with IgG or HA antibodies. Protein levels were detected by Western blotting with β‐TrCP, HA, and β‐actin antibodies.
- HERC3 and HERC3‐CA directly bind to β‐TrCP in vitro. His‐tagged HERC3 and HERC3‐CA proteins were produced in E. coli and purified. β‐TrCP protein was expressed in vitro using Quick Coupled Transcription/Translation System. GFP/HERC3/HERC3‐CA proteins were pulled down using Ni‐NTA and incubated with β‐TrCP protein for 4 h at 4°C. Then, bound proteins were detected by Western blotting with appropriate antibodies as indicated.
- The WD40 domain is necessary for β‐TrCP binding to HERC3. SFB‐HERC3 and HA‐β‐TrCP (wild type or its mutants) were co‐transfected into HEK293T cells. Cells were harvested 24 h post‐transfection and subjected to pulldown using streptavidin. HERC3, β‐TrCP, and β‐TrCP mutants were detected by Western blotting with appropriate antibodies as indicated.
- Schematic diagram and summary of domains in the β‐TrCP‐HERC3 interaction. The HECT domain of HERC3 interacts with the WD40 domain of β‐TrCP. Truncations of HERC3 (upper panel) and β‐TrCP (lower panel) are shown. Results of their interactions summarized from Panels D and F are presented on the right side. FL, full length; +, positive interaction; −, no interaction.
- The HECT domain is necessary for HERC3 binding to β‐TrCP. HA‐β‐TrCP and SFB‐HERC3 (wild type or its mutants) were co‐transfected into HEK293T cells. Cells were harvested 24 h post‐transfection and subjected to pulldown using streptavidin. β‐TrCP, HERC3, and HERC3 truncations were detected by Western blotting with appropriate antibodies as indicated.
- The HECT domain of HERC3 suffices to confer β‐TrCP‐mediated ubiquitination of YAP. HEK293T cells were transfected with expression plasmids for FLAG‐β‐TrCP, HA‐YAP, His‐Myc‐Ubiquitin, and SFB‐HERC3 and its mutants as indicated. Cells were harvested after 24 h and subjected to pulldown using Ni‐NTA beads. Protein levels were detected by Western blotting with HA and FLAG antibodies.
- HERC3 blocks the interaction between β‐TrCP and YAP. HEK293T cells were transfected with expression plasmids for FLAG‐YAP, HA‐β‐TrCP, Myc‐HERC3, and Myc‐HERC3‐CA as indicated. Cells were harvested 24 h post‐transfection and subjected to IP with FLAG antibody‐conjugated agarose beads. Protein levels were detected by Western blotting with HA, FLAG, and Myc antibodies.
- HERC3 interferes with the interaction between β‐TrCP and TAZ. Cell transfection and Western blotting analysis were carried out as described in Panel H.
- Depletion of HERC3 enhances the β‐TrCP‐YAP interaction. Control or HERC3‐deficient MDA‐MB‐231 cells were collected and subjected to IP with IgG or β‐TrCP antibodies. Protein levels were detected by Western blotting with YAP, β‐TrCP, HERC3, and β‐actin antibodies.
- Depletion of HERC3 enhances the β‐TrCP‐TAZ interaction. IP and Western blotting analysis were carried out as described in Panel J.
- HERC3 displaces TAZ on β‐TrCP. Increasing concentrations of purified HERC3 or HERC3‐CA proteins were added to the β‐TrCP and TAZ complex and followed by Western blotting analysis with indicated antibodies. The competitive binding assay in vitro was described in Materials and Methods.
Source data are available online for this figure.
To identify domains responsible for the interaction between HERC3 and β‐TrCP, we generated deletion mutants for both proteins. On β‐TrCP, deletion of the WD domain eliminated its binding to HERC3 (Fig 3D and E). On HERC3, its full‐length and two deletion mutants, ΔRLD and HECT domain alone, could equally interact with β‐TrCP, indicating that the HECT domain was sufficient for its interaction with β‐TrCP (Fig 3E and F). Consistently, the HECT domain (as in ΔRLD and HECT) sufficed to decrease YAP ubiquitination (Fig 3G, compare lanes 3 to 5 and 6), whereas deletion of the HECT domain (as in RLD and ΔHECT) abolished the effect (Fig 3G, compare lanes 2 to 4 and 7). Thus, the WD domain of β‐TrCP contacts with the HECT domain of HERC3 (Fig 3E).
Because HERC3 binds to the substrate‐binding WD domain of β‐TrCP, we hypothesized that HERC3 might compete with YAP/TAZ for β‐TrCP binding. To test this, we examined the effect of HERC3 on the interaction between β‐TrCP and YAP/TAZ. We found that both HERC3 wild type and the CA mutant nearly abolished the β‐TrCP‐YAP and β‐TrCP‐TAZ interactions (Fig 3H and I). Conversely, shHERC3 enhanced the interaction of β‐TrCP with YAP or TAZ, accompanied by marked reduction in the protein levels of YAP/TAZ (Fig 3J and K). Furthermore, in vitro assays demonstrated that recombinant HERC3 or CA proteins could interfere with the interactions between β‐TrCP and TAZ in a dose‐dependent manner (Fig 3L). Thus, HERC3 stabilizes YAP/TAZ by blocking their binding to β‐TrCP.
HERC3 promotes tumor cell properties in vitro
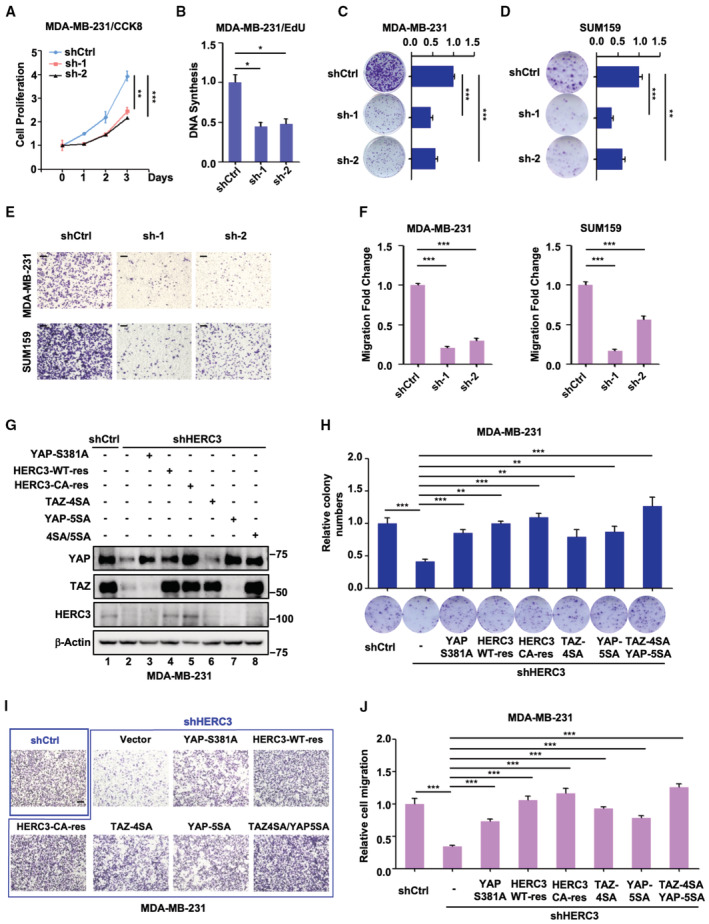
Having determined the role of HERC3 in stabilizing YAP/TAZ proteins, we investigated whether HERC3 functions through YAP/TAZ to influence tumor cell behaviors such as increased proliferation and motility. In parallel to blocking YAP/TAZ activation, knockdown of HERC3 significantly reduced cell proliferation in MDA‐MB‐231 cells, as determined by mitochondrial activity (Fig 4A), EdU incorporation assays (Fig 4B), and colony formation assays (Fig 4C and D). Depletion of HERC3 also markedly reduced cell migration in both MDA‐MB‐231 and SUM159 cells (Fig 4E and F).
Figure 4. HERC3 promotes tumor cell properties in vitro .
-
ADepletion of HERC3 reduces cell proliferation. Control or HERC3‐deficient MDA‐MB‐231 were analyzed for indicated days by CCK8 assay as described in the Materials and Methods. Data are shown as mean ± SEM; n = 3 biological replicates.
-
BDepletion of HERC3 decreases DNA synthesis. Control or HERC3‐deficient MDA‐MB‐231 were analyzed by EdU assay according to the manufacturer's instructions. Data are shown as mean ± SEM; n = 3 biological replicates. Statistical analysis was performed using two‐tailed Student's t‐test. *P < 0.05.
-
CDepletion of HERC3 inhibits colony formation in MDA‐MB‐231 cells. Control or HERC3‐deficient MDA‐MB‐231 were analyzed by colony formation assay. Quantification of the results in colony formation assays was analyzed by Image J. Data are shown as mean ± SEM; n = 3 biological replicates. Statistical analysis was performed using two‐tailed Student's t‐test. ***P < 0.001.
-
DDepletion of HERC3 inhibits colony formation in SUM159 cells. Control or HERC3‐deficient SUM159 was analyzed by colony formation assay. Quantification of the results in colony formation assays was analyzed by Image J. Data are shown as mean ± SEM; n = 3 biological replicates. Statistical analysis was performed using two‐tailed Student's t‐test. **P < 0.01, ***P < 0.001.
-
E, FDepletion of HERC3 attenuates cell migration. Control or HERC3‐deficient MDA‐MB‐231 cells (upper panel) and SUM159 cells (lower panel) were analyzed by transwell migration assay. (E) migrated were fixed in 4% PFA and stained with 0.1% crystal violet and photographed. Scale bar, 100 μm. (F) data quantification of migrated MDA‐MB‐231 cell (left panel) and SUM159 (right panel) cell counts by Image J. Data are shown as mean ± SEM; n = 3 biological replicates. Statistical analysis was performed using two‐tailed Student's t‐test. ***P < 0.001.
-
GRNAi‐resistant HERC3 rescues the endogenous YAP/TAZ levels in HERC3‐deficient MDA‐MB‐231 cells. HERC3‐deficient MDA‐MB‐231 cells stably expressing a resistant variant (HERC3‐WT or HERC3‐CA) or a YAP/TAZ mutant (e.g., YAP‐S381A, TAZ‐4SA, YAP‐5SA, and TAZ‐4SA/YAP‐5SA) were subjected to Western blotting analysis and protein levels were detected with appropriate antibodies as indicated. HERC3‐WT‐res and HERC3‐CA‐res are RNAi‐resistant variants of HERC3 wild type and catalytically inactive mutant, respectively.
-
HRNAi‐resistant HERC3 and YAP/TAZ mutants reverse the inhibitory effect of HERC3 depletion on colony formation. Ectopic expression of RNAi‐resistant HERC3‐WT, HERC3‐CA, and YAP/TAZ mutants in HERC3‐deficient MDA‐MB‐231 cells were subjected to colony formation assay as described in Panel C. Data are shown as mean ± SEM; n = 3 biological replicates. Statistical analysis was performed using two‐tailed Student's t test. **P < 0.01. ***P < 0.001.
-
I, JRNAi‐resistant HERC3 and YAP/TAZ mutants reverse the inhibitory effect of HERC3 depletion on cell migration. (I) ectopic expression of resistant variants of HERC3‐WT, HERC3‐CA, and YAP/TAZ mutants in HERC3‐deficient MDA‐MB‐231 cells were subjected to transwell migration assay. Scale bar, 100 μm. (J) graphic representation of quantitated cell migration in Panel I. Data are shown as mean ± SEM; n = 3 biological replicates. Statistical analysis was performed using two‐tailed Student's t test. ***P < 0.001.
Source data are available online for this figure.
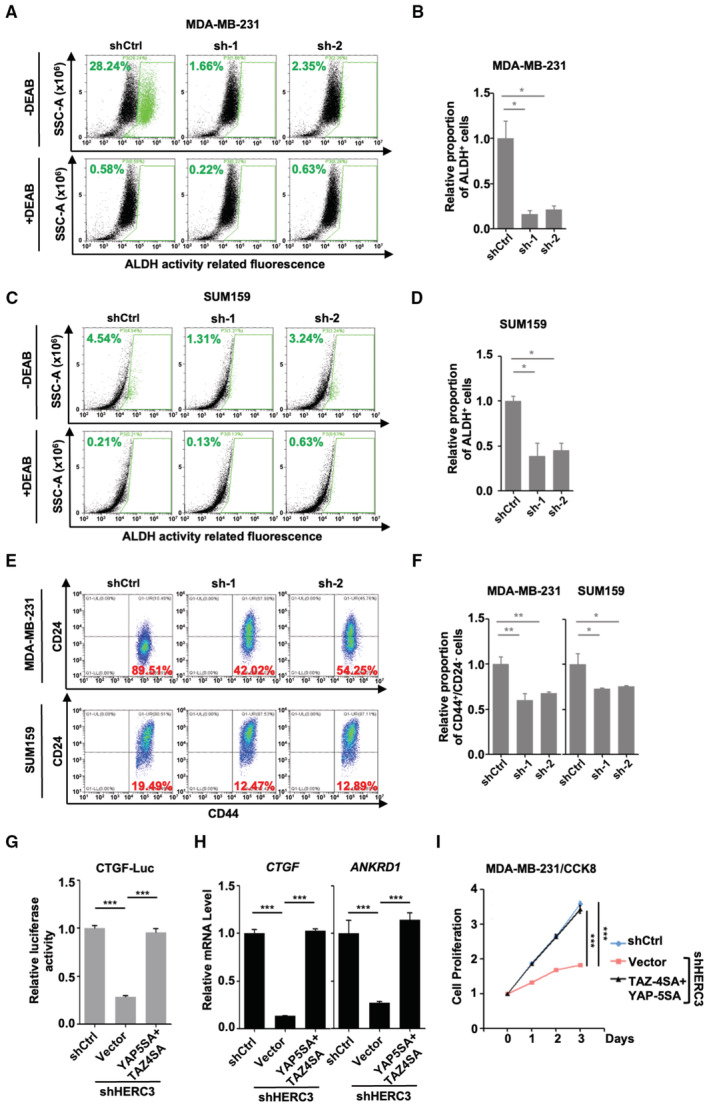
YAP/TAZ are often aberrantly engaged in cancer stem cell (CSC) regeneration. Expression of aldehyde dehydrogenase‐positive (ALDH+) or CD44+/CD24− phenotype has been associated with breast CSC‐like characteristics, capable of self‐renewal and disseminating tumors (Al‐Hajj et al, 2003; Ginestier et al, 2007). We thus analyzed the expression of these markers in both MDA‐MB‐231 and SUM159 cells. Consistent with the reduced YAP/TAZ levels, HERC3 depletion apparently decreased the ALDH+ or CD44+/CD24− cell populations (Fig EV3A–F). Collectively, these data demonstrate that HERC3 promotes tumor‐promoting properties of breast cancer cells.
Figure EV3. HERC3 promotes tumor cell properties in vitro .
-
A–DDepletion of HERC3 decreases the ALDH+ cell population. The ALDH activity in control and HERC3‐deficient cells was analyzed by flow cytometric analysis by using ALDEFLUOR™ kit according to the manufacturer's instructions. (A) MDA‐MB‐231 cells. (B) Quantitation of ALDH+ cell population in MDA‐MB‐231 cells. Data are shown as mean ± SEM; n = 3 biological replicates. *P < 0.05. (C) SUM159 cells. (D) Quantitation of ALDH+ cell population in SUM159 cells. Data are shown as mean ± SEM; n = 3 biological replicates. *P < 0.05.
-
E, FDepletion of HERC3 reduces the CD44+/CD24− cell population. (E) control and HERC3‐deficient MDA‐MB‐231 cells (upper panel) or SUM159 cells (lower panel) were analyzed by flow cytometric analysis with CD24 and CD44 antibodies. (F) Graphical representation of CD44+/CD24− cell population. Data are shown as mean ± SEM; n = 3 biological replicates. Statistical analysis was performed using two‐tailed Student's t‐test. *P < 0.05. **P < 0.01.
-
GTAZ‐4SA/YAP‐5SA rescue shHERC3‐mediated repression of CTGF‐Luc reporter activity. HERC3‐deficient cells with or without ectopic expression of TAZ‐4SA/YAP‐5SA and shCtrl MDA‐MB‐231 cells were transfected with CTGF‐Luc and Renilla‐Luc. Cells were then harvested and subjected to luciferase assay as described in Fig 1G. Data are shown as mean ± SEM; n = 3 biological replicates. Statistical analysis was performed using two‐tailed Student's t‐test. ***P < 0.001.
-
HTAZ‐4SA/YAP‐5SA rescue shHERC3‐mediated repression of YAP/TAZ target gene transcription. Total mRNA levels of CTGF and ANKRD1 were analyzed by qRT–PCR using primers specific to the indicated target genes. Data are shown as mean ± SEM; n = 3 biological replicates. Statistical analysis was performed using two‐tailed Student's t‐test. ***P < 0.001.
-
ITAZ‐4SA/YAP‐5SA reverse the inhibitory effect of HERC3 depletion on cell proliferation. MDA‐MB‐231 cells expressing shHERC3 and/or TAZ‐4SA/YAP‐5SA were analyzed for indicated days by CCK8 assay as described in the Materials and Methods. Data are shown as mean ± SEM; n = 3 biological replicates. ***P < 0.001.
To rule out off‐target effects of shHERC3, we then determined whether RNAi‐resistant HERC3 could rescue the YAP/TAZ stability and subsequent cellular functions in HERC3‐depleted MDA‐MB‐231 cells. When stably expressed in HERC3‐depleted cells, either RNAi‐resistant HERC3‐WT or HERC3‐CA could restore the YAP/TAZ levels (Fig 4G, lanes 4 and 5), and accordingly reversed the antagonizing effect of shHERC3 in colony formation (Fig 4H) and migration (Fig 4I and J). Moreover, unphosphorylatable (and thus stable) YAP/TAZ mutants, including YAP‐S381A, YAP‐5SA, TAZ‐4SA, and TAZ‐4SA/YAP‐5SA, could not be degraded by shHERC3, and consequently overcome the inhibitory effects of shHERC3 on colony formation and migration (Figs 4G–J and EV3G–I). These results suggest that HERC3 promotes tumor cell properties through enhanced YAP/TAZ stabilization.
HERC3 knockdown represses tumorigenesis and metastasis of breast cancer cells
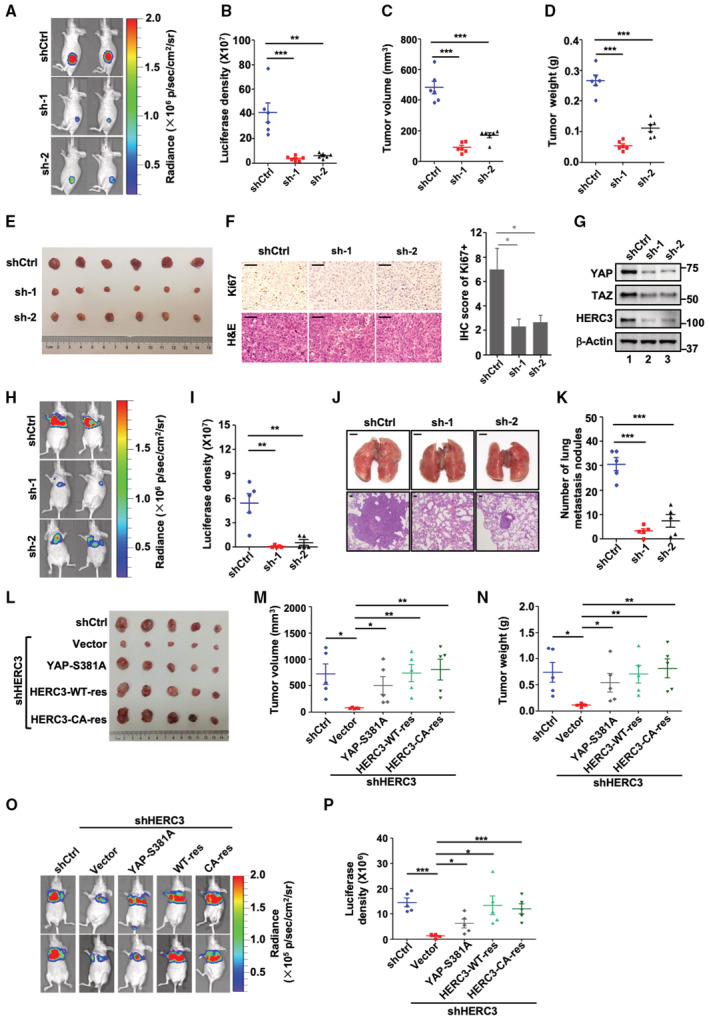
We evaluated the function of HERC3 in tumorigenesis in vivo. Control or HERC3‐depleted luciferase‐expressing MDA‐MB‐231 cells were injected subcutaneously into nude mice. Clearly, knockdown of HERC3 inhibited tumor growth as assessed by bioluminescent imaging (BLI) (Fig 5A and B), tumor volume, weight, and size (Fig 5C–E). Immunohistochemistry (IHC) revealed reduced cell proliferation as indicated by Ki67 (Fig 5F). Similar to those observed in vitro, knockdown of HERC3 substantially decreased the protein levels of YAP and TAZ in the tumors (Fig 5G). These data illustrate that HERC3 is critical for tumorigenicity of breast cancer cells.
Figure 5. HERC3 knockdown represses mammary tumorigenesis and metastasis.
-
A–DHERC3 knockdown inhibits breast tumorigenesis. Luciferase‐harboring MDA‐MB‐231 cells expressing shHERC3 or shCtrl were subcutaneously injected into 6‐week‐old nude mice. Four weeks after injection, mice were monitored by bioluminescence using Xenogen IVIS imaging system. (A) Representative tumors expressing luciferase are indicated by radiance bar (p/s/cm2/sr). (B) Quantitation of bioluminescence data. Data are shown as mean ± SEM; n = 6 biological replicates. Statistical analysis was performed using two‐tailed Student's t‐test. **P < 0.01, ***P < 0.001. (C) Volume from all tumors was recorded from both control and shHERC3 groups. Data are shown as mean ± SEM; n = 6 biological replicates for each group. Statistical analysis was performed using two‐tailed Student's t‐test. ***P < 0.001. (D) Tumor weight from all tumors was recorded from both control and shHERC3 groups. Data are shown as mean ± SEM; n = 6 biological replicates for each group. Statistical analysis was performed using two‐tailed Student's t‐test. ***P < 0.001.
-
EshHERC3 inhibits tumorigenicity of breast cancer cells. Control and HERC3‐deficient MDA‐MB‐231 cells were subcutaneously injected into nude mice. Four weeks after cell implantation, tumors were dissected and photographed.
-
FshHERC3 reduces Ki67 expression in xenograft tumors. Representative H&E staining and immunohistochemical staining of each group's tumor tissues from Panel E. Scale bars, 50 μm. Right: graphical representation of IHC staining quantitation. Data are represented as the mean ± SEM n = 3 biological replicates. Statistical analysis was performed using two‐tailed Student's t‐test. *P < 0.05.
-
GshHERC3 reduces the protein levels of YAP and TAZ in the tumors. Protein levels in tumors (Panel E) were analyzed by Western blotting with YAP, TAZ, HERC3, and β‐actin antibodies.
-
H, IshHERC3 attenuates lung metastatic potential of breast cancer cells. Luciferase‐harboring MDA‐MB‐231 cells expressing shCtrl or shHERC3 were injected into 6‐week‐old nude mice via tail veil. (H) Seven weeks after injection, mice were analyzed by bioluminescence using Xenogen IVIS imaging system. Tumors expressing luciferase are indicated by radiance bar (p/s/cm2/sr). (I) Quantitation of bioluminescence data from Panel H. Data are shown as mean ± SEM; n = 5 biological replicates. Statistical analysis was performed using two‐tailed Student's t‐test. **P < 0.01.
-
J, KshHERC3 attenuates breast cancer lung metastasis. Mice were injected with control or HERC3‐deficient MDA‐MB‐231 cells. (J) Bright‐field images (upper panel, scale bars, 2 mm) and H&E staining (lower panel, scale bars, 50 μm) of the lungs from mice. (K) number of lung metastasis nodules. Data are shown as mean ± SEM; n = 5 biological replicates. Statistical analysis was performed using two‐tailed Student's t‐test. ***P < 0.001.
-
L–NRNAi‐resistant HERC3 and unphosphorylatable YAP‐S381A can counteract the tumor‐suppressive effect of HERC3 depletion. HERC3‐deficient cells with or without ectopic expression of YAP‐S381A, RNAi‐resistant variants of HERC3‐WT or HERC3‐CA, and control MDA‐MB‐231 cells were performed subcutaneously injection as described in Panel A. (L) Tumors were dissected and photographed at 4 weeks after cell implantation. (M) volume from all tumors was recorded. Data are shown as mean ± SEM; n = 5 biological replicates. Statistical analysis was performed using two‐tailed Student's t‐test. *P < 0.05. **P < 0.01. (N) Weight from all tumors was recorded. Data are shown as mean ± SEM; n = 5 biological replicates. Statistical analysis was performed using two‐tailed Student's t‐test. *P < 0.05. **P < 0.01.
-
O, PRNAi‐resistant HERC3 and unphosphorylatable YAP‐S381A can antagonize shHERC3 to promote metastasis derived from MDA‐MB‐231 tumors. HERC3‐deficient MDA‐MB‐231 cells with ectopic expression of indicated YAP or HERC3 variants cells were injected into nude mice through tail veins as described in Panel H. (O) bioluminescence of tumors expressing luciferase (p/s/cm2/sr). (P) quantitation of bioluminescence data. Data are shown as mean ± SEM; n = 5 biological replicates. Statistical analysis was performed using two‐tailed Student's t‐test. *P < 0.05. ***P < 0.001.
Source data are available online for this figure.
Lung metastasis of HERC3‐depleted MDA‐MB‐231 cells was also evaluated. BLI analysis showed that HERC3 depletion drastically reduced lung metastasis in 7 weeks upon tail vein injection (Fig 5H and I). H&E staining on lung sections confirmed a striking reduction in metastatic lesions developed from HERC3‐knockdown cells (Fig 5J and K). These data support the notion that HERC3 critically promotes breast cancer metastasis.
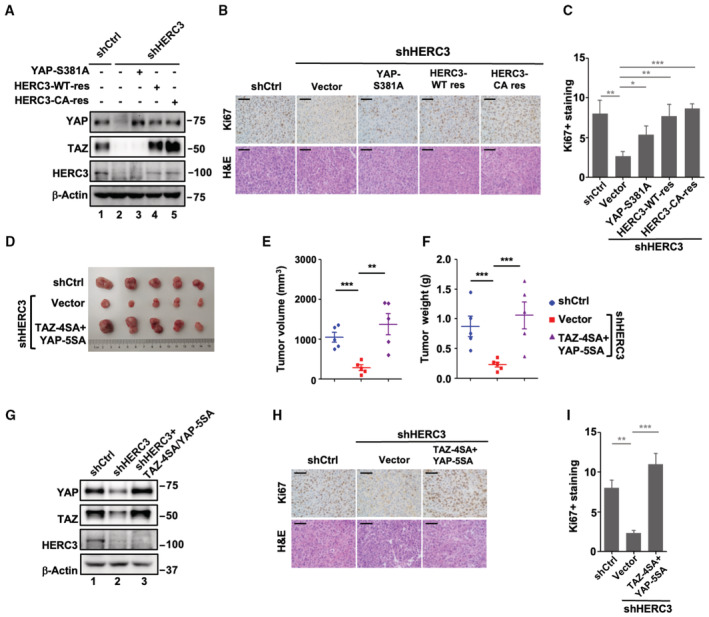
We next asked whether expression of RNAi‐resistant HERC3 or degradation‐resistant YAP/TAZ variants can overcome the tumor‐suppressive effect of shHERC3. Subcutaneous MDA‐MB‐231 tumors grew normally, whereas tumors expressing shHERC3 were significantly smaller and metastasized poorly. Both RNAi‐resistant HERC3‐WT and HERC3‐CA rescued tumor growth in shHERC3 tumors (Figs 5L–N and EV4). Moreover, consistent with the result of Fig 4G–J, YAP‐S381A and TAZ‐4SA/YAP‐5SA reversed the anti‐tumor effect of HERC3 depletion (Figs 5L–N and EV4). Similar effects of RNAi‐resistant HERC3 and YAP‐S381A on tumor progression were obtained when MDA‐MB‐231 cells were injected through tail veins (Fig 5O and P). Taken together, HERC3 promotes tumorigenesis of breast cancer cells by promoting YAP/TAZ stability.
Figure EV4. HERC3 knockdown represses mammary tumorigenesis and metastasis.
-
ARNAi‐resistant HERC3 rescues YAP/TAZ protein levels in HERC3‐deficient tumors. Protein levels of YAP/TAZ in tumors (Fig 5L) were analyzed by Western blotting with appropriate antibodies.
-
B, CRNAi‐resistant HERC3 and YAP‐S381A rescue cell proliferation in HERC3‐deficient xenograft tumors. (B) Representative H&E staining and Ki67 expression from each group's tumor tissues from Fig 5L. Scale bars, 50 μm. (C) Graphical representation of Ki67+ scores from Panel B. Data are represented as the mean ± SEM; n = 3 biological replicates. Statistical analysis was performed using two‐tailed Student's t‐test. *P < 0.05. **P < 0.01. ***P < 0.001.
-
D–FTAZ‐4SA/YAP‐5SA reverse the inhibitory effect of HERC3 depletion in tumorigenicity. Subcutaneous tumors carrying HERC3 deficiency together with TAZ‐4SA/YAP‐5SA expression and control were dissected and analyzed at 6 weeks after cell implantation. (D) Tumor morphology. (E) Tumor volume. (F) Tumor weight. Data are shown as mean ± SEM; n = 5 biological replicates. Statistical analysis was performed using two‐tailed Student's t‐test. **P < 0.01. ***P < 0.001.
-
GTAZ‐4SA and YAP‐5SA are stably expressed at a comparable level to endogenous YAP‐TAZ in HERC3‐deficient tumors. Protein levels in tumors (Fig EV4D) were analyzed by Western blotting with appropriate antibodies.
-
H, ITAZ‐4SA/YAP‐5SA reverse the inhibitory effect of HERC3 depletion on Ki67 expression in xenograft tumors. (H) Representative H&E staining and Ki67 expression from each group's tumor tissues from Fig EV4D. Scale bars, 50 μm. (I) Graphical representation of Ki67+ scores from Panel B. Data are represented as the mean ± SEM. n = 3 biological replicates. Statistical analysis was performed using two‐tailed Student's t‐test. **P < 0.01. ***P < 0.001.
Source data are available online for this figure.
Upregulation of HERC3 correlates with poor prognosis in breast cancer
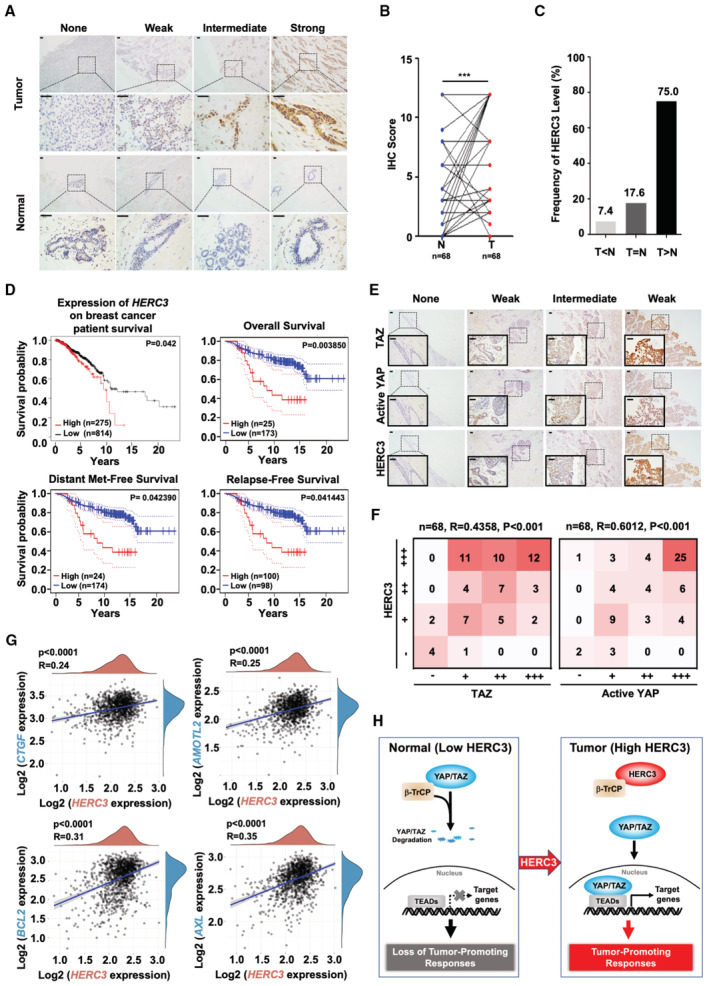
To investigate the clinical relevance of HERC3 in breast cancer, we analyzed the HERC3 levels in 68 paired breast cancer specimens and adjacent normal tissues by IHC staining. As shown in Fig 6A and B, HERC3 was highly expressed in breast cancers compared to their paired tissues. The proportion of elevated HERC3 protein levels in these breast cancer samples was apparently higher than in their paired tissues (Fig 6C). The correlation of high HERC3 was also observed in 144 breast cancer samples and 29 adjacent normal tissues, which were commercially purchased (Fig EV5A and B). Accordingly, survival analysis indicates that elevated expression of HERC3 was strongly correlated with poorer prognosis in TCGA database and one cohort (GSE7390) of 198 breast cancer patients (Fig 6D).
Figure 6. HERC3 is positively correlated with poor prognosis in breast cancer.
-
A, BHERC3 is highly expressed in breast cancer specimens. (A) Representative images of IHC staining of HERC3 in tumor samples of breast cancer specimens and their paired adjacent normal tissues. Scale bars, 50 μm. (B) Graphical representation of scoring performed on IHC staining in Panel A. Data are represented as the mean ± SEM. Statistical analysis was performed using two‐tailed Student's t‐test. ***P < 0.001.
-
CHERC3 protein levels are higher in breast cancer samples than in their paired adjacent normal tissues. T: tumors. N: paired‐adjacent normal tissues.
-
DHERC3 is correlated with poor prognosis in breast cancer patients. Kaplan–Meier curves for overall survival of breast cancer patients according to the HERC3 expression level (upper left panel) (http://kmplot.com/analysis/index.php?p=service&cancer=breast). HERC3 is negatively correlated with overall survival (upper right panel), distant metastasis‐free survival (lower left panel), and the relapse‐free survival (lower right panel) in breast cancer patients. Microarray analysis was performed to examine the prognostic potential of HERC3 in breast cancer using the PrognoScan database with one cohort (GSE7390) of 198 breast cancer specimens (http://www.prognoscan.org).
-
EHERC3 expression is positively correlated with TAZ or active YAP expression in breast cancer patients. Representative images of IHC staining of HERC3, TAZ, and active YAP in tumor samples of breast cancer patients. Scale bars, 50 μm.
-
FGraphical representation of scoring performed on IHC staining in Panel E.
-
GExpression level of HERC3 is positively correlated with those of YAP/TAZ target genes (e.g., CTGF, AMOTL2, BCL2, and AXL) in breast cancer patients, as analyzed using TCGA database.
-
HWorking model for HERC3 functions. YAP and TAZ are transcription co‐activators that activate TEAD‐dependent transcription to regulate cellular functions. Hippo signaling promotes ubiquitination and degradation of YAP/TAZ mediated by ubiquitin ligase β‐TrCP. A high level of HERC3 can block the interaction between YAP/TAZ and β‐TrCP and consequently stabilize YAP/TAZ proteins, thereby leading to enhanced tumor‐promoting responses.
Figure EV5. HERC3 is positively correlated with poor prognosis in breast cancer.
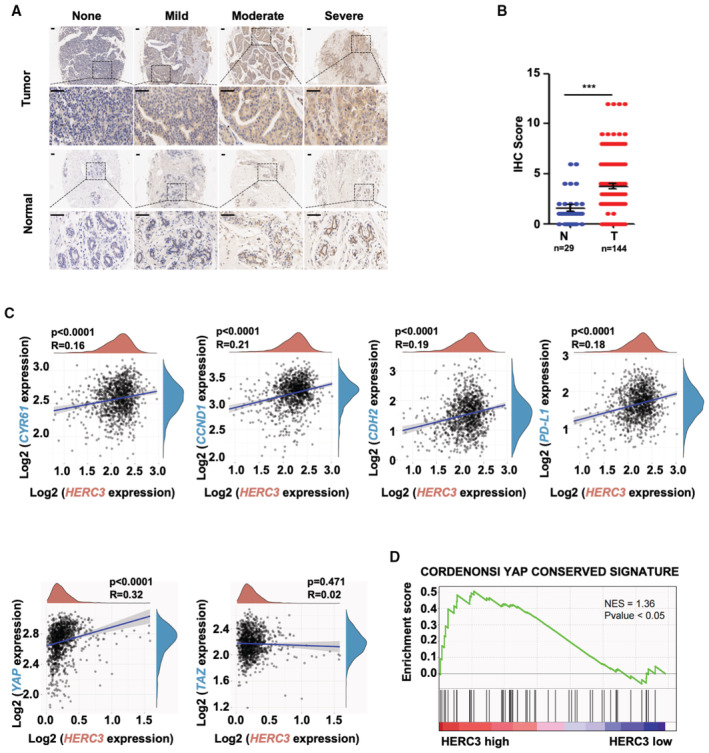
- HERC3 is highly expressed in breast cancer specimens. Representative images of IHC staining of HERC3 in breast tumor samples and adjacent normal tissues of tissue microarrays (Bioaitech). Scale bars, 50 μm.
- Graphical representation of scoring performed on IHC staining in Panel A. Data are represented as the mean ± SEM. n = 3 biological replicates. Statistical analysis was performed using two‐tailed Student's t‐test. ***P < 0.001.
- Expression level of HERC3 is positively correlated with those of YAP/TAZ target genes (e.g., CYR61, CCND1, CDH2, and PD‐L1) in breast cancer patients, as analyzed using TCGA database.
- YAP conserved signatures were enriched in breast cancer samples with high HERC3 levels. Transcriptome‐wide effects of HERC3 on YAP conserved signature genes in TCGA database were evaluated by GSEA analysis. Red, upregulated genes; blue, downregulated genes. NES = 1.36, P‐value < 0.05.
We then examined the relationship between HERC3 and YAP/TAZ protein levels in breast cancer samples. Spearman's rank correlation coefficient analysis indicated that HERC3 expression positively correlated with TAZ expression or active YAP level (Fig 6E and F). By analyzing breast cancer patients of the TCGA cohort, we observed a positive correlation between HERC3 and YAP/TAZ target genes (e.g., CTGF, AMOTL2, BCL2, AXL, CYR61, CCND1, CDH2, and PD‐L1) (Figs 6G and EV5C). Additionally, we also found that HERC3 mRNA level was positively related to YAP mRNA, not TAZ (Fig EV5C). Furthermore, gene set enrichment analysis (GSEA) of TCGA database revealed that YAP‐conserved signature genes were enriched in breast cancer samples with a high HERC3 level (Fig EV5D). Thus, a high level of HERC3 was associated with enhanced YAP/TAZ signaling in positively regulating breast tumorigenesis.
Discussion
YAP/TAZ are central signal transducer and transcription co‐factors in the canonical Hippo signaling cascade and control a wide spectrum of biological functions in development and tissue homeostasis. Inactivation of the MST‐LATS kinase cascade leads to YAP/TAZ activation that plays essential roles in excessive cell growth and tumorigenesis. Evidence has emerged that MST/LATS mutations or their promoter hypermethylation leads to higher levels of nuclear YAP or TAZ in cancer (Steinhardt et al, 2008; Zanconato et al, 2016). In this study, we report that HERC3 represents a novel regulator of YAP/TAZ activation that robustly promotes YAP/TAZ‐dependent transcriptional programs (Fig 6H).
YAP/TAZ oncogenic properties facilitate cancer cell proliferation, chemoresistance, and metastasis, and result in cancer initiation or progression of most solid tumors. Discovery of new factors that regulate YAP/TAZ activation can help us understand better cancer development and gain new insights into anti‐cancer therapies. Our biochemical evidence demonstrates that HERC3 directly binds to β‐TrCP, blocks its binding of β‐TrCP to YAP/TAZ proteins, and consequently, prevents YAP/TAZ destruction. As YAP deficiency leads to abnormal differentiation of mammary cells and reduced mammary gland follicles (Chen et al, 2014), it is conceivable that HERC3 plays a similar role in mammary development through regulation of the β‐TrCP‐YAP/TAZ axis. We speculate that in certain circumstances, HERC3 may be responsible for YAP/TAZ activation. In agreement, expression of HERC3 positively correlates with YAP/TAZ levels and expression of YAP/TAZ target genes in breast cancer cells and patients' breast tissues. Interestingly, HERC3 mRNA level was positively correlated with YAP mRNA, while there is no correlation in the mRNA levels between HERC3 and TAZ (Fig EV5C). This is in line with an early report that YAP, not TAZ, is one of the transcriptional target genes of CTGF (Moon et al, 2020). So, there might have been a YAP‐CTGF‐YAP‐positive feedback in breast tumors, where HERC3 stabilized YAP protein, leading to elevated CTGF expression that is fedback to enhance YAP mRNA. Knockdown of HERC3 causes loss of YAP/TAZ and suppresses the growth behaviors of breast cancer cells. Thus, HERC3 is a YAP/TAZ activator and may serve as a potential therapeutic target for cancer.
It has been well established that in addition to YAP/TAZ, SCFβ‐TrCP targets a number of other substrates such as β‐catenin and Snail, which play important roles in regulation of cellular functions (Bi et al, 2021). SCFβ‐TrCP binds to its substrates through the WD domains. Since HERC3 binds to the WD domains of SCFβ‐TrCP, it is likely that HERC3 can block degradation of most, if not all, SCFβ‐TrCP substrates. Indeed, HERC3 can also block proteasomal degradation of β‐catenin. This opens the possibility for HERC3 in the regulation of other physiological and pathological processes through additional targets. Therefore, our study has identified HERC3 as a novel activator of YAP/TAZ and likely other SCFβ‐TrCP substrates.
HERC proteins, which belong to ubiquitin E3 ligases of the HECT family, play significant roles in tumorigenesis mostly as a potential ubiquitin ligase (Sala‐Gaston et al, 2020). For instance, HERC4 enhances breast tumorigenesis via destabilizing LATS1 (Xu et al, 2019) or Sav1 (Aerne et al, 2015). Despite its suggested involvement in ubiquitination, HERC3 is an understudied member of the HERC family with limited functional implications, especially in cancer. HERC3 targets few substrates for ubiquitination‐dependent degradation, including SMAD7, MM1, EIF5A2, and RPL23A (Chen et al, 2018; Li et al, 2019; Zhang et al, 2022a, 2022b). In addition, HERC3 can inhibit NF‐κB signaling independent of its E3 activity (Hochrainer et al, 2015). Our finding that HERC3 promotes YAP/TAZ signaling further expands the functions of HERC3. In this case, the E3 activity of HERC3 is dispensable for YAP/TAZ activation. Importantly, we further revealed the critical mechanism for the HERC3 action, in which case it simply acts to block the binding of YAP/TAZ to their canonical ubiquitin ligase SCFβ‐TrCP. Among human HERCs, HERC3 is most related to HERC4 (Aerne et al, 2015). However, knockdown of HERC4 had little direct effect to reduce the levels of YAP/TAZ in MDA‐MB‐231 cells, which was also consistent with its inability to bind to SCFβ‐TrCP. Thus, HERC3 and HERC4 regulate the Hippo signaling through distinct mechanisms. Nonetheless, future investigations on the biological functions of HERC3 and other HERC family members will apparently need consideration of both their E3 role and E3‐independent activities.
Materials and Methods
Cell culture and transfection
HEK293T, A549, Hep3B, PANC‐1, HCC1806, MCF7, MDA‐MB‐231, and SUM159 cells were cultured in DMEM (Corning, USA) supplemented with 10% fetal bovine serum (FBS) (Gibco) and 1% penicillin/streptomycin at 37°C. MDA‐MB‐231 cells were transfected with X‐tremeGENE (Roche, Switzerland) and HEK293T cells with PEI (Polyscience, USA).
Antibodies and reagents
Detailed information on antibodies is provided in Appendix Table S1. Cycloheximide (CHX, 2112S) and MG132 (474790) were purchased from Cell Signaling Technology and Millipore, respectively. ALDEFLUOR™ kit (01700) was purchased from Stem Cell.
RNA interference
Small interfering RNAs (siRNAs) were commercially synthesized from Ribobio (China) and transfected into cells using Lipofectamine® RNAiMAX Reagent (Thermo Fisher Scientific) according to the manufacturer's instructions. siRNA sequence targeting human β‐TrCP was as below: siβ‐TrCP: GUGGAAUUUGUGGAACAUC (Bassermann et al, 2008).
Establishment of stable cell lines
Lentiviral plasmids were transfected into HEK293T cells together with packaging plasmid psPAX2 and envelope plasmid pMD2. Cell supernatants were collected 48 h after transfection. To obtain stable cell lines, cells were infected with lentiviral supernatants diluted 1:1 with normal culture medium in the presence of Polybrene (Sigma). Cells were selected in the presence of puromycin (Sigma) for 1 week. The sequences of shRNAs and sgRNAs were as follows:
shHERC3‐1: GATGTGTTTCTGGGATTGTAT (Chen et al, 2018);
shHERC3‐2: GCGATCGGATTCCCATCTA;
sgLATS1‐1: CGTGCAGCTCTCCGCTCTAA (Ma et al, 2021);
sgLATS1‐2: TCACTCTCTGTCCGTTGCTA (Ma et al, 2021);
sgLATS2‐1: TACGCTGGCACCGTAGCCCT (Ma et al, 2021);
sgLATS2‐2: CTGAGCGGTACCCCCTACG (Ma et al, 2021).
Quantitative RT–PCR (qRT–PCR)
Total RNAs were obtained by TRIzol method (Sigma). RNAs were reverse transcribed to cDNA using the PrimeScript RT reagent kit (TaKaRa). qRT–PCR was performed on an ABI PRISM 7500 Sequence Detector System (Applied Biosystems) using gene‐specific primers and SYBR Green Master Mix (Vazyme, China). For the amplification, gene‐specific primers were used as follows:
Human HERC3 (Forward), TGTTGGGGATATTGGTCTCTGG
Human HERC3 (Reverse), CCCTTGGTGTTCAAACCACAT
Human CTGF (Forward), CAGCATGGACGTTCGTCTG
Human CTGF (Reverse), AACCACGGTTTGGTCCTTGG
Human ANKRD1 (Forward), AGTAGAGGAACTGGTCACTGG
Human ANKRD1 (Reverse), TGGGCTAGAAGTGTCTTCAGAT
Human TAZ (Forward), GTCCTACGACGTGACCGAC
Human TAZ (Reverse), CACGAGATTTGGCTGGGATAC
Human YAP (Forward), TGTCCCAGATGAACGTCACAGC
Human YAP (Reverse), TGGTGGCTGTTTCACTGGAGCA
Human β‐Actin (Forward), CAAAGTTCACAATGTGGCCGAGGA
Human β‐Actin (Reverse), GGGACTTCCTGTAACAACGCATCT
Reporter luciferase assay
HEK293T cells were co‐transfected with 8xGTIIC‐Luc or CTGF‐Luc reporters and indicated plasmids. Twenty‐four hours after transfection, cells were harvested. The expression of luciferase reporters was analyzed with the Dual‐Luciferase Reporter Assay system (Promega, USA). All assays were done and repeated in triplicate, and all values were normalized for transfection efficiency against Renilla luciferase activities.
Immunoprecipitation, subcellular fractionation, and Western blotting
Co‐immunoprecipitation (co‐IP) was carried out using antibodies and protein A Sepharose (GE Healthcare, USA) or Ni beads. After several washes, precipitated proteins were eluted in SDS loading buffer and separated by SDS–PAGE, transferred onto PVDF membranes (Millipore), and detected in Western blotting with appropriate antibodies. Cytosolic and nuclear fractions were extracted with cytoplasmic and nuclear protein extraction kit (Beyotime Biotechnology, P0027) according to the manufacturer's instructions. Extracted proteins were separated by SDS–PAGE and then transferred onto the PVDF membrane, and detected in Western blotting with appropriate antibodies.
In vitro binding assay
Recombinant His‐tagged GFP, HERC3, or HERC3‐CA proteins were produced in E. coli strain Rosetta and purified. In vitro translation of β‐TrCP was carried out using Quick Coupled Transcription/Translation System (Promega). In vitro binding was carried out using His‐tagged proteins on nickel–nitrilotriacetic acid (Ni‐NTA) beads incubated with in vitro translated β‐TrCP for 4 h at 4°C and followed by Western blot analysis.
To detect the inhibitory effect of HERC3 and HERC3‐CA proteins on the interactions between β‐TrCP and TAZ in vitro, increasing concentrations of purified His‐tagged GFP, HERC3 or HERC3‐CA proteins were added to the β‐TrCP and TAZ complex and incubated at 4°C overnight. The mixtures were boiled with SDS sample buffer and detected by Western blotting with appropriate antibodies.
Cell growth and colony formation assays
For the CCK8 assay, cells were split into 96‐well plates (1 × 10³ cells, 100 μl per well, three replicates). Ten microliters of the CCK8 solution was added to each well of the plate and continued to incubate in a humidified incubator for 2 h. Absorbance at 450 nm was measured using a microplate reader. For the EdU assay, experiments were performed according to the manufacturer's instructions (Ribobio, China). For the colony formation assays, cells were seeded in a six‐well plate at a density of 1 × 10³ cells/well and then cultured for the indicated times. Cells were stained with 0.1% crystal violet and recorded. Experiments were performed in triplicate.
Flow cytometry
Cells were prepared according to manufacturers' instructions and were sorted and analyzed on CytoFLEX, using CytExpert Software (Beckmancoulter, USA). To study the effects of HERC3 deficiency on cell ALDH activity, we performed Aldefluor assay with the ALDEFLUOR™ kit. To study the effects of HERC3 deficiency on CD24‐negative, CD44‐positive cell population, we performed FACS using antibodies against CD44‐FITC and CD24‐APC.
Transwell migration assay
Cells were planted in Falcon cell culture inserts (Corning) for transwell migration assay or BioCoat Matrigel invasion chambers (Corning) for transwell invasion assay. 1 × 10⁴ or 5 × 10⁴ cells were plated in transwell inserts (at least three replicas for each sample). The cells in the upper chamber of the transwell were removed with a cotton swab. Migrated and invaded cells were fixed in 4% PFA and stained with 0.1% crystal violet and photographed.
In vivo mouse models
All animal experiment protocols were approved by the Zhejiang University Animal Care and Use Committee. A total of 1 × 10⁶ MDA‐MB‐231 cells were suspended in a mixture of 100 μl cell culture medium with Matrigel (BD Bioscience) and then injected subcutaneously into 6‐week‐old female BALB/c nude mice. Four weeks later, tumorigenesis was determined by bioluminescent imaging on a Xenogen IVIS‐100 (Caliper Life Sciences, Hopkinton, MA). After mice were sacrificed and tumors were excised, measured, and collected for further biochemical analysis, including immunohistochemistry and Western blotting with appropriate antibodies. For the lung metastasis model, 1 × 10⁵ MDA‐MB‐231 cells were injected into the tail vein of anesthetized female BALB/c nude mice. Bioluminescence in the lung was analyzed and photographed (IVIS 100). After euthanasia, the lungs were excised, fixed, and stained with H&E, and metastatic foci were quantitated by visual inspection.
Immunohistochemical (IHC) staining
Tissue microarrays of breast cancer (F175Br01, Bioaitech) were conducted to immunohistochemistry (Servicebio) using HERC3 antibody and photographed. Human breast cancer tissues and corresponding adjacent tissues were obtained from The First BETHUNE Hospital of Jilin University and approval was obtained from the hospital's internal committees for human tissue uses. We affirm that the study is compliant with all relevant ethical regulations regarding research involving existing specimens with informed consent obtained from all participants. IHC analysis was performed as previously described (Zhang et al, 2019).
Statistical analysis
For the quantitative RT–PCR and luciferase assay, two‐sided Student's t‐test was used to determine the significant difference. For IHC score analysis, percentage of positive cells was given a score of 0 to 4: 0 (0–5%), 1 (6–25%), 2 (26–50%), 3 (51–75%), and 4 (>75%); Staining intensity was rated 0 to 3: 0 being weakest and 3 being strongest. The final score was determined by the percentage of positive cells and their intensity. Zero was none (−); 1–4 was weakly positive (+); 5–8 was moderately positive (++); and 9–12 was strongly positive (++++). Kaplan–Meier method was used to calculate survival curves and used a log‐rank test to check whether gene levels were significantly associated with patient survival in TCGA database and one cohort (GSE7390) of 198 breast cancer patients. The website links used for statistical analyses of expression and prognosis were provided in Appendix Table S2. Respective P‐values as a measure of significance are indicated. For GSEA analysis, the cohort dataset (obtained from TCGA) was split into HERC3‐high and HERC3‐low groups according to the HERC3 expression level in each patient, then GSEA was performed using the GSEA software (v3.0) with the YAP conserved signature gene set (Cordenonsi et al, 2011) with parameter “Enrichment statistic: weighted_p2; Metric for ranking genes: Signal2Noise”.
Author contributions
Bo Yuan: Conceptualization; data curation; formal analysis; funding acquisition; validation; investigation; visualization; methodology; writing – original draft; writing – review and editing. Jinquan Liu: Data curation; formal analysis; investigation; methodology; writing – review and editing. Aiping Shi: Resources; data curation; formal analysis; supervision; investigation. Jin Cao: Formal analysis; investigation. Yi Yu: Data curation; formal analysis; validation. Yezhang Zhu: Data curation; formal analysis. Chengbin Zhang: Data curation; formal analysis; investigation. Yifei Qiu: Investigation. Hongjie Luo: Investigation. Jiaxian Shi: Investigation. Xiaolei Cao: Validation; methodology. Pinglong Xu: Resources; supervision. Li Shen: Resources; data curation; formal analysis. Tingbo Liang: Resources. Bin Zhao: Resources; data curation; formal analysis; supervision; writing – review and editing. Xin‐Hua Feng: Conceptualization; resources; formal analysis; supervision; funding acquisition; visualization; writing – original draft; project administration; writing – review and editing.
Disclosure and competing interests statement
The authors declare no conflict of interest.
Supporting information
Appendix
Expanded View Figures PDF
Source Data for Expanded View
PDF+
Source Data for Figure 1
Source Data for Figure 2
Source Data for Figure 3
Source Data for Figure 4
Source Data for Figure 5
Acknowledgements
We thank Chenghua Li for pLKO.1‐HERC3, myc‐HERC3‐CA, and FLAG‐MM1 plasmids. We are grateful to the Core Facility of Life Sciences Institute and its staff for assisting with a variety of molecular and cellular analyses. We thank members of Feng Laboratory and Zhao Laboratory for helpful discussion and technical assistance. This research was partly supported by grants from National Natural Science Foundation of China (NSFC) (31730057, 91940302, 32200568), NSFC‐Zhejiang Province Joint Fund (U21A20356), Ministry of Science and Technology of China (2022YFC3401500), Natural Science Foundation of Zhejiang Province (LD21C070001), and the Fundamental Research Funds for the Central Universities. Bo Yuan is a recipient of a fellowship from the China Postdoctoral Science Foundation (2020M671701).
The EMBO Journal (2023) 42: e111549
Contributor Information
Bin Zhao, Email: binzhao@zju.edu.cn.
Xin‐Hua Feng, Email: fenglab@zju.edu.cn.
Data availability
This study includes no data deposited in external repositories.
References
- Aerne BL, Gailite I, Sims D, Tapon N (2015) Hippo stabilises its adaptor Salvador by antagonising the HECT ubiquitin ligase Herc4. PLoS One 10: e0131113 [DOI] [PMC free article] [PubMed] [Google Scholar]
- Al‐Hajj M, Wicha MS, Benito‐Hernandez A, Morrison SJ, Clarke MF (2003) Prospective identification of tumorigenic breast cancer cells. Proc Natl Acad Sci USA 100: 3983–3988 [DOI] [PMC free article] [PubMed] [Google Scholar]
- Bassermann F, Frescas D, Guardavaccaro D, Busino L, Peschiaroli A, Pagano M (2008) The Cdc14B‐Cdh1‐Plk1 axis controls the G2 DNA‐damage‐response checkpoint. Cell 134: 256–267 [DOI] [PMC free article] [PubMed] [Google Scholar]
- Bi Y, Cui D, Xiong X, Zhao Y (2021) The characteristics and roles of beta‐TrCP1/2 in carcinogenesis. FEBS J 288: 3351–3374 [DOI] [PubMed] [Google Scholar]
- Chen Q, Zhang N, Gray RS, Li H, Ewald AJ, Zahnow CA, Pan D (2014) A temporal requirement for hippo signaling in mammary gland differentiation, growth, and tumorigenesis. Genes Dev 28: 432–437 [DOI] [PMC free article] [PubMed] [Google Scholar]
- Chen Y, Li Y, Peng Y, Zheng X, Fan S, Yi Y, Zeng P, Chen H, Kang H, Zhang Y et al (2018) DeltaNp63alpha down‐regulates c‐Myc modulator MM1 via E3 ligase HERC3 in the regulation of cell senescence. Cell Death Differ 25: 2118–2129 [DOI] [PMC free article] [PubMed] [Google Scholar]
- Cordenonsi M, Zanconato F, Azzolin L, Forcato M, Rosato A, Frasson C, Inui M, Montagner M, Parenti AR, Poletti A et al (2011) The hippo transducer TAZ confers cancer stem cell‐related traits on breast cancer cells. Cell 147: 759–772 [DOI] [PubMed] [Google Scholar]
- Dey A, Varelas X, Guan KL (2020) Targeting the hippo pathway in cancer, fibrosis, wound healing and regenerative medicine. Nat Rev Drug Discov 19: 480–494 [DOI] [PMC free article] [PubMed] [Google Scholar]
- Dupont S, Morsut L, Aragona M, Enzo E, Giulitti S, Cordenonsi M, Zanconato F, Le Digabel J, Forcato M, Bicciato S et al (2011) Role of YAP/TAZ in mechanotransduction. Nature 474: 179–183 [DOI] [PubMed] [Google Scholar]
- Ginestier C, Hur MH, Charafe‐Jauffret E, Monville F, Dutcher J, Brown M, Jacquemier J, Viens P, Kleer CG, Liu S et al (2007) ALDH1 is a marker of normal and malignant human mammary stem cells and a predictor of poor clinical outcome. Cell Stem Cell 1: 555–567 [DOI] [PMC free article] [PubMed] [Google Scholar]
- Hansen CG, Moroishi T, Guan KL (2015) YAP and TAZ: a nexus for hippo signaling and beyond. Trends Cell Biol 25: 499–513 [DOI] [PMC free article] [PubMed] [Google Scholar]
- Heng BC, Zhang X, Aubel D, Bai Y, Li X, Wei Y, Fussenegger M, Deng X (2021) An overview of signaling pathways regulating YAP/TAZ activity. Cell Mol Life Sci 78: 497–512 [DOI] [PMC free article] [PubMed] [Google Scholar]
- Hochrainer K, Pejanovic N, Olaseun VA, Zhang S, Iadecola C, Anrather J (2015) The ubiquitin ligase HERC3 attenuates NF‐kappaB‐dependent transcription independently of its enzymatic activity by delivering the RelA subunit for degradation. Nucleic Acids Res 43: 9889–9904 [DOI] [PMC free article] [PubMed] [Google Scholar]
- Huang W, Lv X, Liu C, Zha Z, Zhang H, Jiang Y, Xiong Y, Lei QY, Guan KL (2012) The N‐terminal phosphodegron targets TAZ/WWTR1 protein for SCFbeta‐TrCP‐dependent degradation in response to phosphatidylinositol 3‐kinase inhibition. J Biol Chem 287: 26245–26253 [DOI] [PMC free article] [PubMed] [Google Scholar]
- Kedan A, Verma N, Saroha A, Shreberk‐Shaked M, Muller AK, Nair NU, Lev S (2018) PYK2 negatively regulates the hippo pathway in TNBC by stabilizing TAZ protein. Cell Death Dis 9: 985 [DOI] [PMC free article] [PubMed] [Google Scholar]
- Lei QY, Zhang H, Zhao B, Zha ZY, Bai F, Pei XH, Zhao S, Xiong Y, Guan KL (2008) TAZ promotes cell proliferation and epithelial‐mesenchymal transition and is inhibited by the hippo pathway. Mol Cell Biol 28: 2426–2436 [DOI] [PMC free article] [PubMed] [Google Scholar]
- Li H, Li J, Chen L, Qi S, Yu S, Weng Z, Hu Z, Zhou Q, Xin Z, Shi L et al (2019) HERC3‐mediated SMAD7 ubiquitination degradation promotes autophagy‐induced EMT and chemoresistance in glioblastoma. Clin Cancer Res 25: 3602–3616 [DOI] [PubMed] [Google Scholar]
- Ma S, Meng Z, Chen R, Guan KL (2019) The hippo pathway: biology and pathophysiology. Annu Rev Biochem 88: 577–604 [DOI] [PubMed] [Google Scholar]
- Ma S, Wu Z, Yang F, Zhang J, Johnson RL, Rosenfeld MG, Guan KL (2021) Hippo signalling maintains ER expression and ER(+) breast cancer growth. Nature 591: E1–E10 [DOI] [PMC free article] [PubMed] [Google Scholar]
- Mao X, Sethi G, Zhang Z, Wang Q (2018) The emerging roles of the HERC ubiquitin ligases in cancer. Curr Pharm Des 24: 1676–1681 [DOI] [PubMed] [Google Scholar]
- Maugeri‐Sacca M, Barba M, Pizzuti L, Vici P, Di Lauro L, Dattilo R, Vitale I, Bartucci M, Mottolese M, De Maria R (2015) The hippo transducers TAZ and YAP in breast cancer: oncogenic activities and clinical implications. Expert Rev Mol Med 17: e14 [DOI] [PubMed] [Google Scholar]
- Moon S, Lee S, Caesar JA, Pruchenko S, Leask A, Knowles JA, Sinon J, Chaqour B (2020) A CTGF‐YAP regulatory pathway is essential for angiogenesis and barriergenesis in the retina. iScience 23: 101184 [DOI] [PMC free article] [PubMed] [Google Scholar]
- Moroishi T, Hansen CG, Guan KL (2015) The emerging roles of YAP and TAZ in cancer. Nat Rev Cancer 15: 73–79 [DOI] [PMC free article] [PubMed] [Google Scholar]
- Moya IM, Halder G (2019) Hippo‐YAP/TAZ signalling in organ regeneration and regenerative medicine. Nat Rev Mol Cell Biol 20: 211–226 [DOI] [PubMed] [Google Scholar]
- Pocaterra A, Romani P, Dupont S (2020) YAP/TAZ functions and their regulation at a glance. J Cell Sci 133: jcs230425 [DOI] [PubMed] [Google Scholar]
- Sala‐Gaston J, Martinez‐Martinez A, Pedrazza L, Lorenzo‐Martin LF, Caloto R, Bustelo XR, Ventura F, Rosa JL (2020) HERC ubiquitin ligases in cancer. Cancers 12: 1653 [DOI] [PMC free article] [PubMed] [Google Scholar]
- Sanchez‐Tena S, Cubillos‐Rojas M, Schneider T, Rosa JL (2016) Functional and pathological relevance of HERC family proteins: a decade later. Cell Mol Life Sci 73: 1955–1968 [DOI] [PMC free article] [PubMed] [Google Scholar]
- Si Y, Ji X, Cao X, Dai X, Xu L, Zhao H, Guo X, Yan H, Zhang H, Zhu C et al (2017) Src inhibits the hippo tumor suppressor pathway through tyrosine phosphorylation of Lats1. Cancer Res 77: 4868–4880 [DOI] [PubMed] [Google Scholar]
- Steinhardt AA, Gayyed MF, Klein AP, Dong J, Maitra A, Pan D, Montgomery EA, Anders RA (2008) Expression of yes‐associated protein in common solid tumors. Hum Pathol 39: 1582–1589 [DOI] [PMC free article] [PubMed] [Google Scholar]
- Totaro A, Panciera T, Piccolo S (2018) YAP/TAZ upstream signals and downstream responses. Nat Cell Biol 20: 888–899 [DOI] [PMC free article] [PubMed] [Google Scholar]
- Varelas X (2014) The hippo pathway effectors TAZ and YAP in development, homeostasis and disease. Development 141: 1614–1626 [DOI] [PubMed] [Google Scholar]
- Verma S, Yeddula N, Soda Y, Zhu Q, Pao G, Moresco J, Diedrich JK, Hong A, Plouffe S, Moroishi T et al (2019) BRCA1/BARD1‐dependent ubiquitination of NF2 regulates hippo‐YAP1 signaling. Proc Natl Acad Sci USA 116: 7363–7370 [DOI] [PMC free article] [PubMed] [Google Scholar]
- Wu Z, Guan KL (2021) Hippo signaling in embryogenesis and development. Trends Biochem Sci 46: 51–63 [DOI] [PMC free article] [PubMed] [Google Scholar]
- Xu Y, Ji K, Wu M, Hao B, Yao KT, Xu Y (2019) A miRNA‐HERC4 pathway promotes breast tumorigenesis by inactivating tumor suppressor LATS1. Protein Cell 10: 595–605 [DOI] [PMC free article] [PubMed] [Google Scholar]
- Yu FX, Zhao B, Guan KL (2015) Hippo pathway in organ size control, tissue homeostasis, and cancer. Cell 163: 811–828 [DOI] [PMC free article] [PubMed] [Google Scholar]
- Zanconato F, Cordenonsi M, Piccolo S (2016) YAP/TAZ at the roots of cancer. Cancer Cell 29: 783–803 [DOI] [PMC free article] [PubMed] [Google Scholar]
- Zhang Q, Xiao M, Gu S, Xu Y, Liu T, Li H, Yu Y, Qin L, Zhu Y, Chen F et al (2019) ALK phosphorylates SMAD4 on tyrosine to disable TGF‐beta tumour suppressor functions. Nat Cell Biol 21: 179–189 [DOI] [PubMed] [Google Scholar]
- Zhang Z, He G, Lv Y, Liu Y, Niu Z, Feng Q, Hu R, Xu J (2022a) HERC3 regulates epithelial‐mesenchymal transition by directly ubiquitination degradation EIF5A2 and inhibits metastasis of colorectal cancer. Cell Death Dis 13: 74 [DOI] [PMC free article] [PubMed] [Google Scholar]
- Zhang Z, Wu Q, Fang M, Liu Y, Jiang J, Feng Q, Hu R, Xu J (2022b) HERC3 directly targets RPL23A for ubiquitination degradation and further regulates colorectal cancer proliferation and the cell cycle. Int J Biol Sci 18: 3282–3297 [DOI] [PMC free article] [PubMed] [Google Scholar]
- Zhao B, Wei X, Li W, Udan RS, Yang Q, Kim J, Xie J, Ikenoue T, Yu J, Li L et al (2007) Inactivation of YAP oncoprotein by the hippo pathway is involved in cell contact inhibition and tissue growth control. Genes Dev 21: 2747–2761 [DOI] [PMC free article] [PubMed] [Google Scholar]
- Zhao B, Ye X, Yu J, Li L, Li W, Li S, Yu J, Lin JD, Wang CY, Chinnaiyan AM et al (2008) TEAD mediates YAP‐dependent gene induction and growth control. Genes Dev 22: 1962–1971 [DOI] [PMC free article] [PubMed] [Google Scholar]
- Zhao B, Li L, Tumaneng K, Wang CY, Guan KL (2010) A coordinated phosphorylation by Lats and CK1 regulates YAP stability through SCF(beta‐TRCP). Genes Dev 24: 72–85 [DOI] [PMC free article] [PubMed] [Google Scholar]
- Zhao W, Wang M, Cai M, Zhang C, Qiu Y, Wang X, Zhang T, Zhou H, Wang J, Zhao W et al (2021) Transcriptional co‐activators YAP/TAZ: potential therapeutic targets for metastatic breast cancer. Biomed Pharmacother 133: 110956 [DOI] [PubMed] [Google Scholar]
- Zheng Y, Pan D (2019) The hippo signaling pathway in development and disease. Dev Cell 50: 264–282 [DOI] [PMC free article] [PubMed] [Google Scholar]
- Zhu Q, Le Scolan E, Jahchan N, Ji X, Xu A, Luo K (2016) SnoN antagonizes the hippo kinase complex to promote TAZ signaling during breast carcinogenesis. Dev Cell 37: 399–412 [DOI] [PMC free article] [PubMed] [Google Scholar]


