

Abstract
This systematic review synthesizes research published from January 2010-July 2022 on the social determinants of ideal cardiovascular health (CVH) carried out around the world and compares trends in high-income countries (HICs) to those in low- and middle-income countries (LMICs). 41 studies met inclusion criteria (n = 28 HICs, n = 13 LMICs). Most were from the United States (n = 22) and cross-sectional (n = 33), and nearly all evaluated associations among adults. Among studies conducted in LMICs, nearly all were from middle-income countries and only one was carried out in low-income country. Education (n = 24) and income/wealth (n = 17) were the most frequently examined social determinants in both HICs and LMICs. Although most studies assessed ideal CVH using reliable and valid methods (n = 24), only 7 used criteria pre-defined by the American Heart Association to characterize ideal levels of each CVH metric. Despite heterogeneity in how outcome measures were derived and analyzed, consistent associations were evident between multiple markers of higher social status (i.e. greater education, income/wealth, socioeconomic status, racial/ethnic majority status) and greater levels of ideal CVH across both country contexts. Gaps in the literature include evidence from LMICs and HICs other than the United States, longitudinal research, and investigations of a wider array of social determinants beyond education and income/wealth.
Keywords: Social determinants of health, Ideal cardiovascular health, Race and ethnicity, Socioeconomic status, Education, Income/wealth, Occupation, Employment, Systematic review
Introduction
Cardiovascular disease (CVD) can be challenging to avoid among individuals with multiple risk factors [1], highlighting the importance of primordial prevention strategies that guard individuals against developing risk factors by supporting positive cardiovascular health (CVH) [2]. In an effort to advance the tracking and study of positive CVH in the population, the American Heart Association (AHA) defined a composite measure of ideal CVH as being disease-free and meeting recommendations for three biological and four behavioral risk factors for CVD (also termed Life’s Simple 7): total cholesterol, blood pressure, blood glucose, body mass index, non-smoking, physical activity, and diet [1,3]. Unlike most other indicators used in cardiovascular research, ideal CVH provides a holistic assessment of health beyond the clinical absence of disease [1]. Since the concept was introduced in 2010, research on ideal CVH has demonstrated robust associations with better cardiovascular outcomes [4–6]. However, studies find that it is remarkably rare among adult populations, with prevalence estimates ranging from 0.3% to 15% [6,7]. Consequently, identifying and intervening on the factors that help individuals sustain ideal CVH through the life course is a critical public health priority.
The social determinants of health – or the conditions in which people are born, grow, live, work and age [8] – play a pivotal role in shaping population patterns of health and disease. With respect to cardiovascular outcomes, higher rates of CVD are commonly observed among groups with lower social status, including those with low levels of education and income, working class individuals, and racial/ethnic minorities [9]. Although less work has explored social differences in ideal CVH, studies increasingly find similar patterns with respect to education and income/wealth, [7] as well and race/ethnicity [10,11]. Since health disparities are driven by an unequal distribution of money, power, and resources in society, [8] it is possible that efforts to build a more equitable social structure can substantially improve ideal CVH levels in the population [9].
To date, most cardiovascular research on the social determinants of health is carried out in high-income countries (HICs), [6] even though low- and middle-income countries (LMICs) account for more than 75% of cardiovascular deaths worldwide [12]. Over the last decade, CVD rates declined steadily in HICs [13] but CVD-related disability-adjusted life-years grew by 9%–12% in most LMICs, [14] suggesting a greater need to enhance ideal CVH in these settings. Although the lack of research from LMICs reflects broader publication trends that favor work from HICs, [15] it may also be a historical artifact of a time when the prevalence of CVD was low in LMICs and malnutrition and infectious diseases were more common [16]. This trend shifted in the last century, as industrialization sparked an epidemiologic transition to a greater burden of non-communicable diseases in many LMICs [16,17], as reflected in the low levels of ideal CVH recorded in many of these countries today [6,18–22]. Furthermore, globalization created a “perfect storm” for CVD risk factors in many LMICs, [23] where cheap, energy-dense foods are widely available and urbanization contributes to sedentary lifestyles, greater tobacco and air pollution exposure, and heightened psychosocial stress [12,17,23].
Since scant research has studied ideal CVH in LMICs [6,7], it is unclear whether associations with social determinants of health noted in HICs are generalizable to lower income settings that have experienced rapid development in recent years. Therefore, the goal of this systematic review is to compare findings on the social determinants of ideal CVH in HICs and LMICs. Our review advances previously published work that summarized research on socioeconomic inequalities in ideal CVH in a few key ways [7]. First, we compare findings from an expanded set of studies conducted in both HICs and LMICs that explored associations with education and income/wealth, as well as a wider array of determinants related to an individual’s standing in society [9,24], including employment, occupation, and socioeconomic status (SES). We also considered race/ethnicity as a social determinant since they represent socially derived identities shaped by societal forces and therefore reflect underlying social hierarchies. Second, we expanded our focus beyond adult populations to include studies of children and adolescents to gain greater insight into the ways social environments shape CVH starting early in life. Lastly, since previous work highlighted limitations of meta-analyses that pool results across studies that use heterogeneous CVH measures [6,7], we conducted an in-depth narrative synthesis, which allowed us to summarize key findings and explore methodological inconsistencies in the evidence base (e.g. regarding CVH measurement). In doing so, we hope to determine whether social determinants are viable global targets for primordial prevention while also highlighting approaches to improve the quality of epidemiologic research on ideal CVH moving forward.
Consistent with past work from HICs [7,9] and emerging evidence from LMICs, [25] we hypothesized that ideal CVH would be associated with indicators of high social standing across both HICs and LMICs. Because we were interested in the potential causal role social determinants play in shaping population patterns of CVH, we focused on community samples and carefully distinguished studies that are cross-sectional from longitudinal ones that provide a stronger basis for causal inference. We also limited our search to epidemiologic investigations that used multivariable methods, and minimally adjusted for age and sex, both of which can influence an individual’s CVH [7] and their likelihood of developing CVD [26,27]. Lastly, given our interest in ideal CVH as a uniquely informative, multidimensional measure of positive health, we excluded studies that did not adhere to AHA guidelines for quantifying ideal CVH using a composite measure, and those that only examined associations with individual CVH metrics.
Methods
Search strategy
We searched the PubMed (https://pubmed.ncbi.nlm.nih.gov), Embase (https://www.embase.com/login), and LILACS (https://lilacs.bvsalud.org/en/) databases in November 2019 for studies published after 2010, which was the year the AHA defined their criteria for ideal CVH. Due to the global focus of our work, we conducted a broad search that included any studies published in languages in which our team had proficiency (i.e. English, Spanish, and Portuguese). We also reviewed reference lists from included studies and conducted two refresher searches (in February 2021 and July 2022) to ensure the results presented in our review are comprehensive and up to date. Search terms included CVH (or Life’s Simple 7) and keywords related to education, income/wealth, employment and occupation, SES, and race/ethnicity (full search terms provided in Supplemental Material). We selected these indicators of social standing because they were recently highlighted in Scientific Statements from the AHA on the social determinants of CVD [9,24]. Our search protocol was designed in accordance with the Preferred Reporting Items for Systematic Review and Meta-Analyses Protocols (PRISMA-P) [28] and Standards for Systematic Reviews, [29] and we pre-registered it with the International Prospective Register of Systematic Reviews (PROSPERO; CRD42020154018).
Three co-authors carried out the review, including conducting all study screening, data extraction, and quality assessments (F.Q., K.B.S., and S.S.O.). After removing duplicates, two reviewers independently screened unique abstracts for study inclusion. We obtained full text manuscripts for studies that met eligibility criteria or if eligibility was unclear from the information provided in the abstract. Thereafter, two reviewers independently evaluated each manuscript. When reviewers disagreed about whether a study should be included, a third reviewer who was previously unfamiliar with the study in question resolved the disagreement. Eligibility criteria for inclusion were if the study:
Was conducted in a healthy sample (i.e. not recruited on the basis of a diagnosed medical condition);
Examined ideal CVH as a composite outcome defined as meeting recommendations for total cholesterol, blood pressure, blood sugar, smoking, body mass index, physical activity, and dietary intake;
Examined associations between ideal CVH and ≥1 of the previously defined social determinants; and
Evaluated associations between social determinants and ideal CVH using multivariable statistical methods that adjusted for age and sex at minimum.
Studies were included if ideal CVH was assessed using a composite measure that included information on all 7 individual metrics (for the exact ideal CVH criteria proposed by the AHA, see Table 1). We also imposed no age restrictions and included studies of both adult and pediatric populations. Only empirical articles were included; systematic reviews, meta-analyses, commentaries, editorials, book chapters, and conference abstracts were excluded.
Table 1.
The American heart association guidelines for ideal cardiovascular health*.
| Metric | Ideal | Intermediate | Poor |
|---|---|---|---|
|
| |||
| Adults (≥20y) | |||
| Current smoking | Never or quit >12 mo | Former ≤12 mo | Current smoker |
| Body mass index | 18–25 kg/m2 | 25–30 kg/m2 | ≥30 kg/m2 |
| Physical activity | ≥150 min/wk moderate or | 1–149 min/wk moderate or | None |
| ≥75 min/wk vigorous or | 1–74 min/wk vigorous or | ||
| ≥150 min/wk moderate + 2x vigorous | 1–149 min/wk moderate + 2x vigorous | ||
| Healthy diet† | 4–5 components | 2–3 components | 0–1 components |
| Total cholesterol | < 200 mg/dL untreated | 200–239 mg/dL or treated to goal | ≥240 mg/dL |
| Blood pressure | SBP <120 mmHg and | SBP 120–139 mmHg or | SBP ≥140 mmHg and |
| DBP <80 mmHg untreated | DBP 80–89 mmHg or treated to goal | DBP ≥90 mmHg | |
| Fasting plasma glucose | < 100 mg/dL untreated | 100–125 mg/dL | ≥126 mg/dL |
| Children and Adolescents (<20y) | |||
| Current smoking | Never tried; never smoked whole cigarette | – | Tried >30 d ago |
| Body mass index | < 85th percentile | 85th–95th percentile | >95th percentile |
| Physical activity | ≥60 min/d of moderate or vigorous | 0–59 min/d of moderate or vigorous | None |
| Healthy diet† | 4–5 components | 2–3 components | 0–1 component |
| Total cholesterol | < 170 mg/dL untreated | 170–199 mg/dL or treated to goal | ≥ 200 mg/dL |
| Blood pressure | < 90th percentile untreated | 90–95th percentile or treated to goal | >95th percentile |
| Fasting plasma glucose | < 100 mg/dL untreated | 100–125 mg/dL or treated to goal | ≥126 mg/dL |
Binary measures of ideal CVH defined as having all 7 metrics in the ideal range. Count scores can be defined as either the total number of metrics in the ideal range (0–7), or alternatively by summing the total number of metrics in the ideal (scored as 2 points), intermediate (scored as 1 point), or poor ranges (scored as 0 points).
Diet scores based on consumption of ≥4.5 cups/day of fruits and vegetables, ≥2 servings/week of fish, ≥3 servings/day of whole grains, ≤36 oz/week of sugar-sweetened beverages, and ≤1,500 mg/day of sodium.
The unit of analysis for synthesizing findings was at the survey level. Since many studies presented similar findings from common data sources, we implemented a protocol to ensure that only unique (i.e. non-duplicative) results were reported. If multiple manuscripts evaluated the same social determinant using a common data source, we only reported findings from studies with the largest sample of non-overlapping study populations, or those that spanned the longest study period. If associations with multiple social determinants were examined in a single manuscript, each finding was considered separately in our narrative synthesis.
Risk of bias assessment
We evaluated the quality of each study using a risk of bias assessment adapted from the Newcastle-Ottawa Quality Assessment Scale for cohort studies [30]. Two independent reviewers assessed each study, and disagreements were resolved following the same procedure described previously. We evaluated each study with respect to 11 criteria; responses were summed to create a 13-point study quality score, with higher values reflecting higher quality (i.e. lower risk of bias). A full description of our quality assessment tool is provided in the Supplemental Material.
Data extraction and synthesis
During the full-text review of included studies, one reviewer extracted relevant data from each into a standardized spreadsheet, and a second reviewer checked this work for accuracy. We analyzed study findings thematically after organizing results by type of social determinant and country income level. Figure 1 shows a map differentiating HICs from LMICs based on income thresholds established by the World Bank [31]. HICs were defined as those with a Gross National Income (GNI) per capita ≥$12,536, middle-income countries as between <$12,536 and >$1045, and low-income countries as ≤$1045 [31]. Following standard practice, low- and middle-income levels were grouped into a single LMIC category [17]. We calculated descriptive statistics by key study characteristics and evaluated differences between HICs and LMICs using χ2 tests and t tests.
Fig. 1.
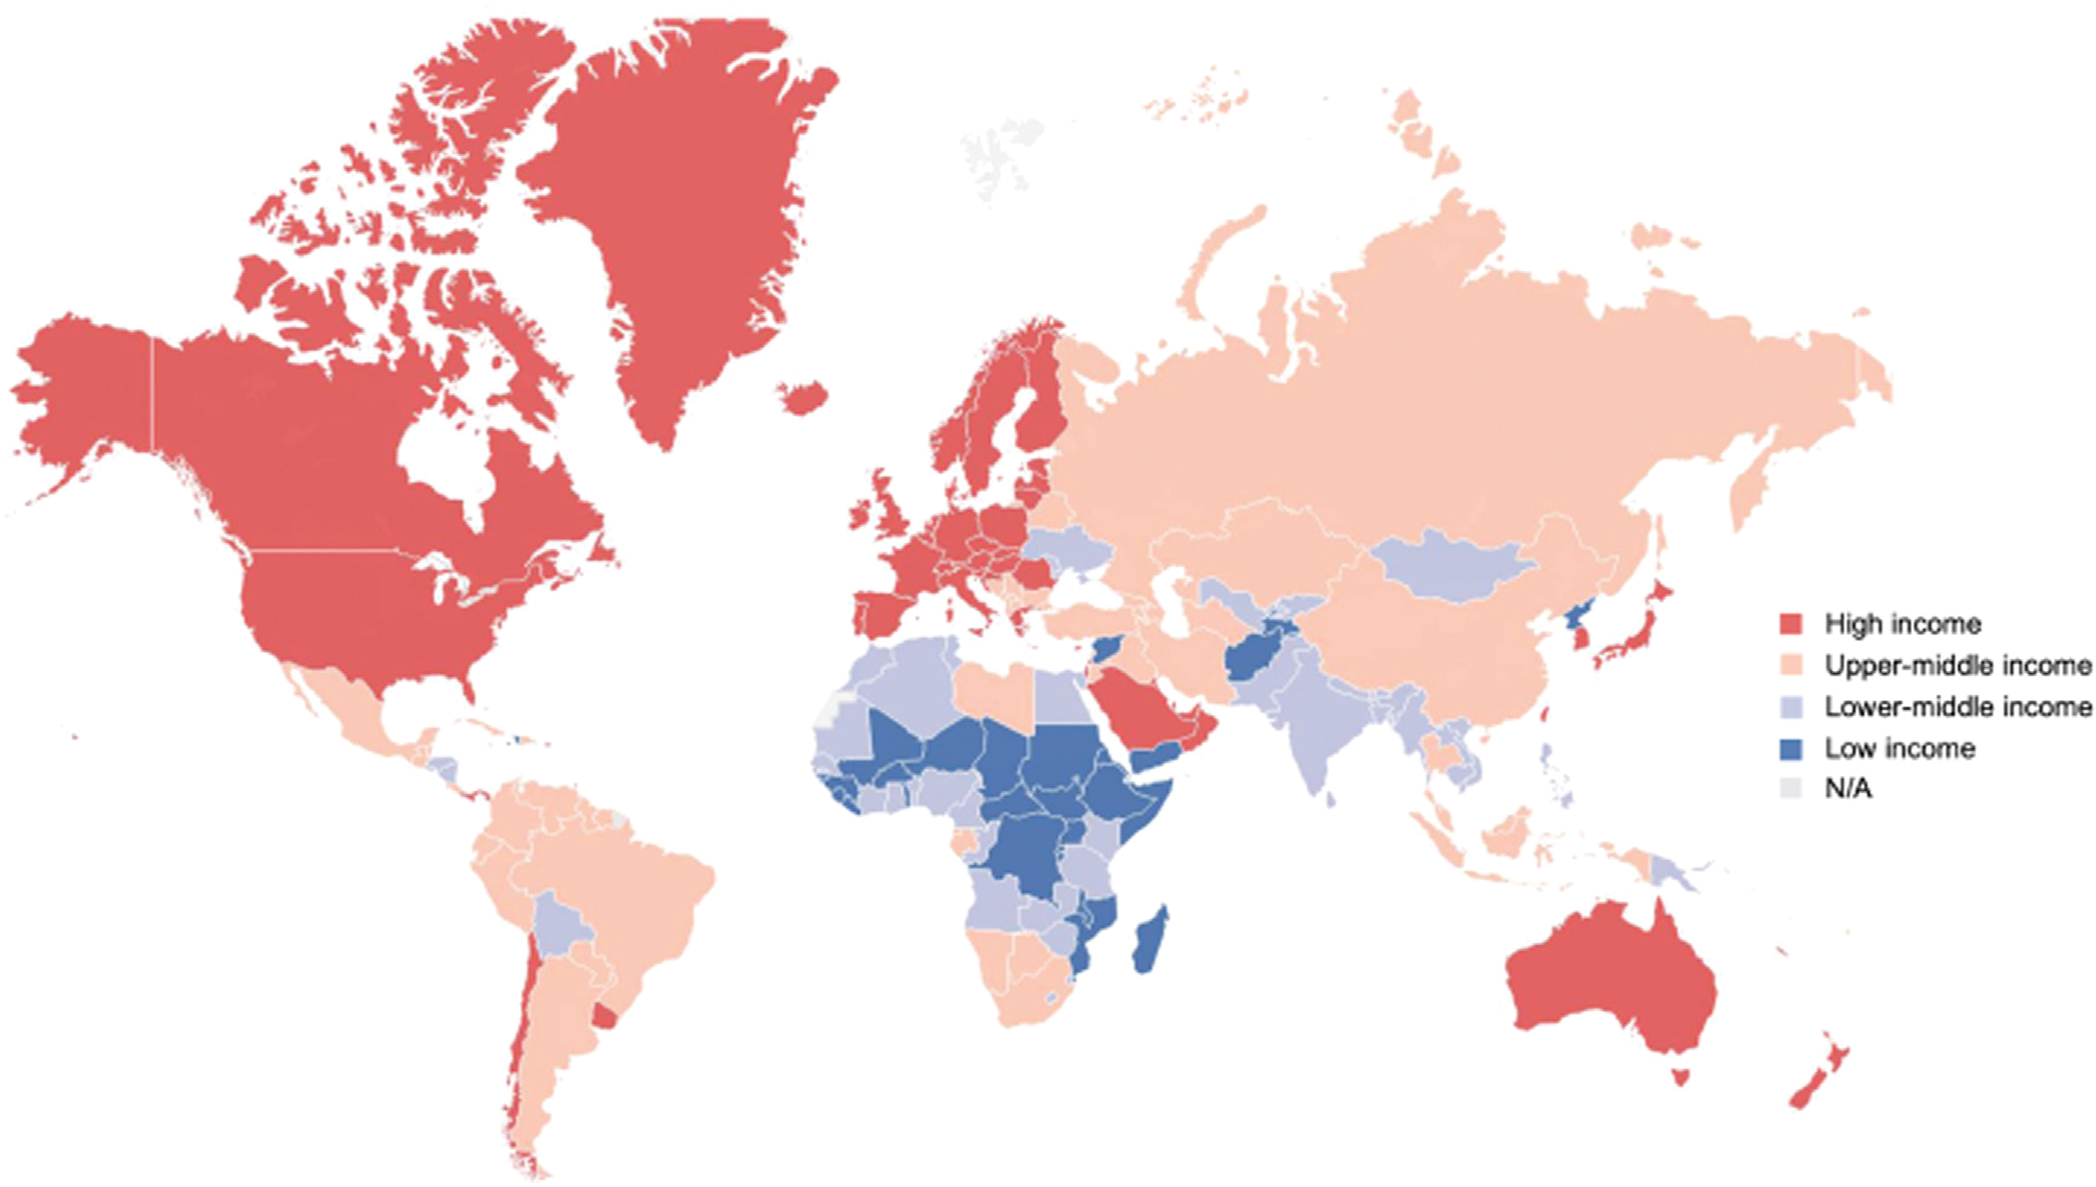
Global map of high-income and low- and middle-income countries, based on classifications by The World Bank [31].
Associations between individual social determinants and ideal CVH were narratively summarized by country income level based on the fully adjusted results reported in each study. Results were presented stratified by gender and/or race/ethnicity if the manuscript reported evidence of effect modification or if only stratified results were reported. We interpreted evidence of associations according to the direction and magnitude of point estimates (when measures of association were provided) or by adjusted mean ideal CVH scores/prevalence estimates. Findings were described as: 1) in the expected direction (i.e. higher social status was related to better CVH), 2) in the unexpected direction (i.e. lower social status was related to better CVH), 3) not apparent (i.e. point estimates overlapped with the null value or no statistical evidence of differences in mean ideal CVH scores/prevalence estimates were reported), or 4) mixed (i.e. associations differed by subgroup or by exposure).
Results
Figure 2 depicts a flowchart of our manuscript screening process, which yielded a total of 41 studies. Among these, 28 studies were from HICs and 13 from LMICs. Both overall and among those from HICs, most studies were conducted in the United States (U.S.; n = 22). Among studies from LMICs, most came from China (n = 4) and Brazil (n = 2). Nearly all studies included in the LMIC category were conducted in upper-middle-income countries; two were conducted in lower-middle income countries (Bhutan, Nepal) and only one in a low-income country (Malawi). A full list of the countries represented by the studies are provided in Table 2.
Fig. 2.
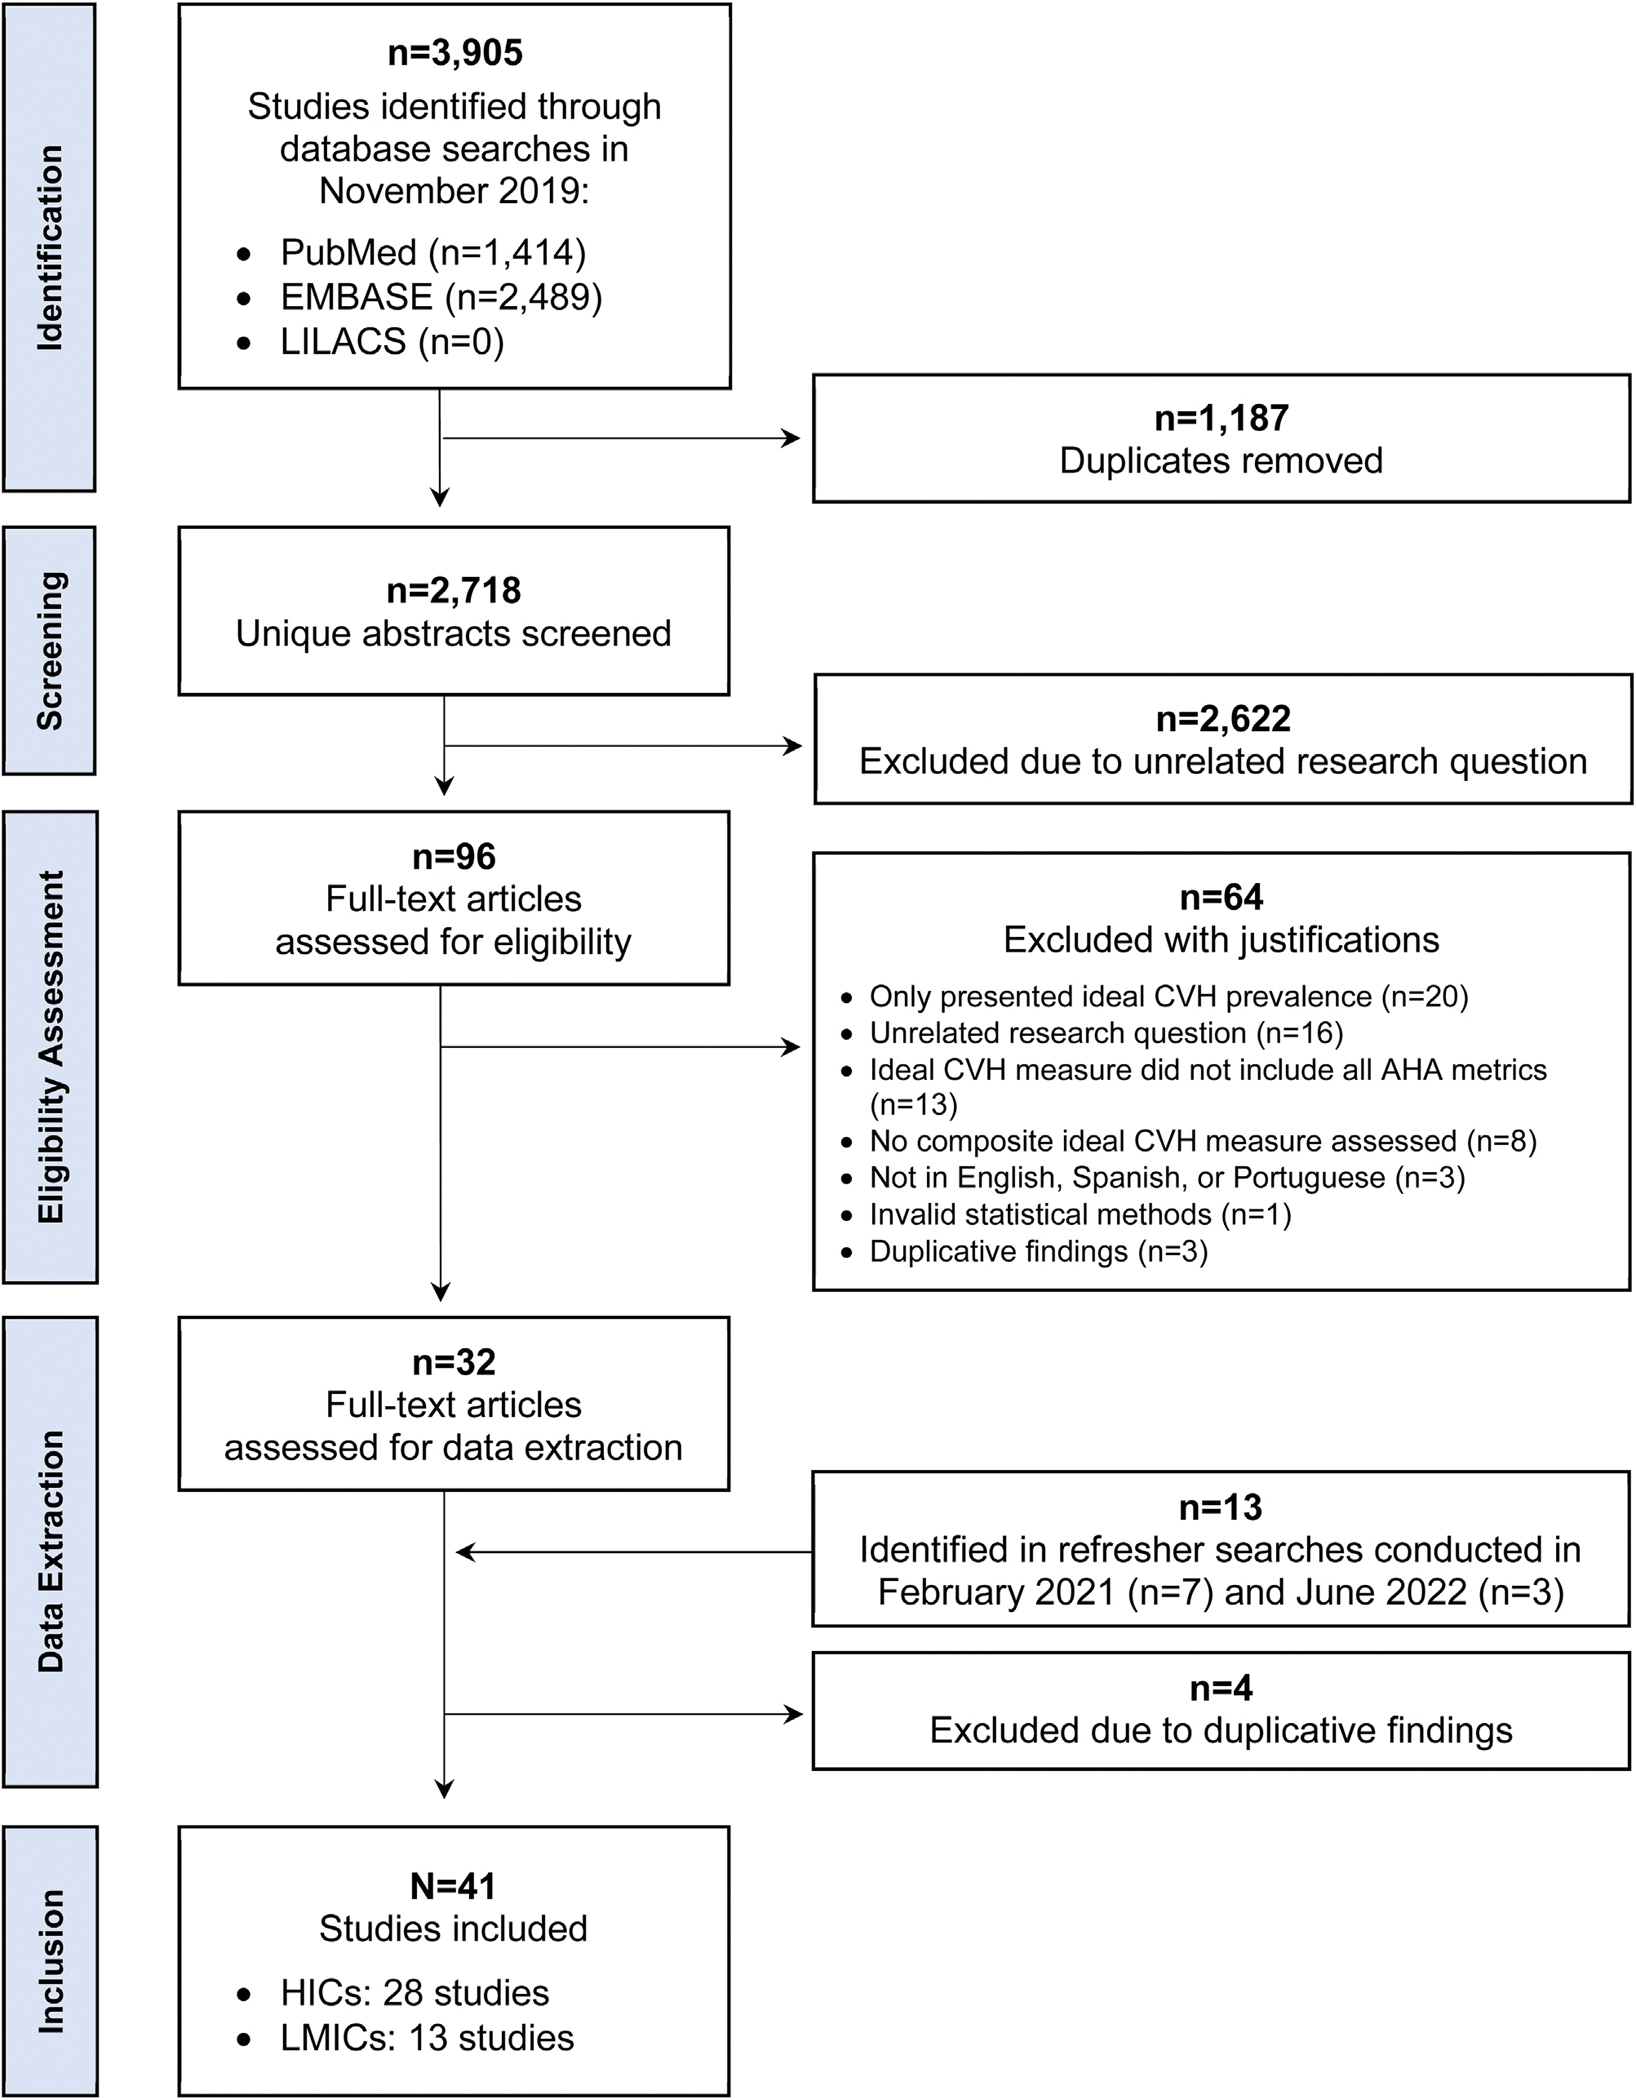
Screening process to identify studies for inclusion.
Table 2.
Geographic distribution of studies (N = 41)
| Country by region | Studies |
|---|---|
|
| |
| High-Income Countries (n = 28) | |
| United States | 22 |
| Canada | 1 |
| European Union (EU)* | 1 |
| Finland | 1 |
| France | 1 |
| Israel | 1 |
| Spain | 1 |
| Low- and Middle-Income Countries (n = 13) | |
| China | 4 |
| Brazil | 2 |
| Bhutan | 1 |
| Bosnia & Herzegovina | 1 |
| Jamaica | 1 |
| Malawi | 1 |
| Nepal | 1 |
| Peru | 1 |
| Serbia | 1 |
One study was conducted in 9 EU countries: Austria, Belgium, France, Germany, Greece, Hungary, Italy, Spain, and Sweden73.
Study characteristics
Nearly all studies (n = 38) examined associations between social determinants and ideal CVH measured in adulthood whereas only 3 studied ideal CVH in children or adolescents. Most were also cross-sectional (n = 33; 80%). Among the 8 studies that were longitudinal (all but one from HICs), 3 examined life course processes by testing associations between social determinants measured in childhood or adolescence and ideal CVH assessed in adulthood. The other five studies used repeated measurements of ideal CVH to evaluate associations between social determinants and changes in health over time [32–34].
Most studies were based on random samples of their target population (68% HICs, 85% LMICs; χ2 = 1.27, P = .26) and included ≥1000 participants (86% HICs, 100% LMICs; χ2 = 4.36, P = .23). Risk of bias assessments indicated a mean study quality score of 10.0 (range = 7–13; SD = 1.5). No substantial differences in study quality were evident when comparing findings from HICs and LMICs (e.g. HIC mean = 9.9; LMIC mean = 10.2; t = 0.68, P = .50).
Studies generally used reliable and valid methods to assess both social determinants and ideal CVH, but there was substantial variability in how individual ideal CVH metrics were defined (for a description of how measures were evaluated, see the complete quality assessment tool provided in the Supplemental Material). In total, only 7 studies (all but one from HICs) used the exact criteria established by the AHA to characterize ideal levels of each metric whereas 4 studies used ideal CVH measures that were based entirely on self-reported data. Different criteria were frequently used to assess dietary intake (57% HICs, 69% LMICs; χ2 = 0.55, P = .46) and physical activity (42% HICs, 38% LMICs; χ2 = 0.07, P = .79). There was also some variability in how composite measures were operationalized, with 29 studies (71%) assessing ideal CVH using a 7-point sum score of total metrics in the ideal range, compared to 12 (29%) that used a 14-point score that combined information on metrics in the ideal, intermediate, or poor ranges. Approaches used to analyze composite ideal CVH measures were also inconsistent. Many studies used binary measures of either ideal CVH (yes/no) or poor CVH (yes/no) as the primary outcome (n = 23; 56%), but a sizeable proportion of studies used continuous sum scores (n = 14, 34%) or categorical measures of ideal, intermediate, or poor CVH defined using different thresholds for each category (n = 4; 10%). Among those that analyzed associations with categorical or binary outcome measures, thresholds used to differentiate participants with ideal levels were highly variable, but cut-offs of 5 (n = 10) and 6 (n = 7) ideal metrics out of 7 were the most common.
Social patterning in Ideal CVH in HICs and LMICs
Tables 3,4,5,6,7 describe key characteristics of studies from HICs and LMICs and summarize findings by social determinant (more detailed characteristics of each study are provided in Supplemental Tables S1–S5). Because most studies reported findings on > 1 social determinant, studies may be listed in multiple sections. Overall, education was the most frequently investigated factor (n = 21), followed by income/wealth (n = 16), and race/ethnicity (n = 14). Fewer studies examined associations with occupation and employment (n = 7) or SES measured using a composite measure that included information on income/wealth, education, or other related socioeconomic characteristics (n = 6). Figure 3 compares main findings from HICs and LMICs.
Table 3.
Results from studies examining ideal cardiovascular health (CVH) in relation to education*.
| Reference | Country (study/setting) | Study Design | N | Sample description | Ideal CVH measure† | Covariate adjustment | Main finding | Quality score‡ |
|---|---|---|---|---|---|---|---|---|
|
| ||||||||
| High-Income Countries | ||||||||
| Alam, et al., 2021 [81] | USA (NHANES) | Cross-sectional | 1,634 | • Male & female • Asian Am. • Ages ≥20y |
Ideal (≥6/7) | Age, sex, income, nativity | Lower educational attainment associated with lower likelihood of ideal CVH | 10 |
| Benderly, et al., 2017 [39] | Israel (Hadera) | Cross-sectional | 1,104 | • Male & female • Urban • Ages 25–74y |
Ideal (≥6/7) | Age, ethnicity, crowding, marital status, occupation | ≥12 years of education associated with a greater likelihood of ideal CVH | 10 |
| De Moraes, et al., 2019 [35] | USA (MESA) | Cross-sectional | 6,792 | • Male & female • White, Black, Latinx & Chinese Am. • CVD-free • Ages 45–84y |
Poor (≤7/14) | Age, income, neighborhood SES, occupation, study site | Mixed associations between educational attainment and likelihood of poor CVH by race & sex | 9 |
| Egan, et al., 2020 [82] | USA (NHANES) | Cross-sectional | 32,803 | • Male & female • White, Black & Latinx • Ages ≥20y |
Categorical (≥10 vs. ≤4/14) | Age, sex, race/ethnicity, health insurance, income, survey year | Greater educational attainment associated with greater likelihood of ideal CVH (vs. poor CVH) | 10 |
| Foraker, et al., 2019 [83] | USA (JHS) | Cross-sectional | 3,667 | • Male & female • Black • Ages 45–64y |
Total score (0–14) | Age, sex | Greater educational attainment associated with higher ideal CVH scores; Greater neighborhood level education associated with higher ideal CVH scores | 10 |
| Gebreab, et al., 2015 [10] | USA (BRFSS) | Cross-sectional | 281,198 | • Male & female • Ages >18y |
Poor (< 5/7) | Age, sex, race/ethnicity, income, state-level characteristics | Lower educational attainment associated with greater likelihood of poor CVH | 7 |
| Graciani, et al., 2013 [84] | Spain (CV Risk) | Cross-sectional | 11,408 | • Male & female • Ages >18y |
Ideal (≥6/7) | Age, sex, self-rated health, healthcare use | Greater educational attainment associated with greater likelihood of ideal CVH | 10 |
| Harrison, et al., 2019 [85] | Canada (Quebec) | Cross-sectional | 777 | • Male & female • Francophone • Ages ≥18–65y |
Total score (0–7) | Age, sex | Greater educational attainment associated with higher ideal CVH scores | 9 |
| Henriksson, et al., 2018 [73] | 9 EU countries (HELENA) | Cross-sectional | 637 | • Male & female • Ages 13–16y |
Total score (0–7) | Age, sex | Greater maternal educational attainment associated with higher ideal CVH scores | 11 |
| Lassale, et al., 2022 [34] | USA (ARIC) | Longitudinal (6y) | 11,049 | • Male & female • Black & White • Ages 45–64y |
Ideal (≥8/14) | Age, sex, race, income, work status | Lower educational attainment associated with greater likelihood of CVH degradation and lower likelihood of CVH improvement | 13 |
| Lawrence, et al., 2018 [37] | USA (Add Health) | Longitudinal (15y) | 11,200 | • Male & female • Ages 24–34y |
Ideal (≥6/7) | Age, sex, race/ethnicity, adolescent family income, adolescent health factors, young adult income and social factors | Greater educational attainment associated with greater likelihood of ideal CVH; Greater parental educational attainment associated with lower likelihood of ideal CVH | 11 |
| Ogunmoroti, et al., 2017 [41] | USA (Miami) | Cross-sectional | 9,056 | • Male & female • Employed • Ages 31–55y |
Ideal (≥6/7) | Age, sex, race/ethnicity | Greater educational attainment associated with greater likelihood of ideal CVH | 9 |
| Yang, et al., 2014 [42] | USA (NHANES) | Cross-sectional | 8,834 | • Male & female • White, Black & Mexican Am. • Ages 12–17y |
Total score (0–7) | Age, sex, race/ethnicity | More years of education associated with higher ideal CVH scores | 12 |
| Low- and Middle-Income Countries | ||||||||
| Benziger, et al., 2018 [53] | Peru (CRONICAS) | Cross-sectional | 3,058 | • Male & female • Ages ≥35y |
Ideal (≥5/7) | Age, sex, wealth, urbanicity | No evidence of association between educational attainment and likelihood of ideal CVH | 10 |
| Bi, et al., 2015 [49] | China (NCD) | Cross-sectional | 96,121 | • Male & female • Ages ≥20y |
Categorical (≥6 vs. ≤1/7) | Age, sex, economic development, health insurance, urbanization | Greater educational attainment associated with greater likelihood of ideal CVH (vs. poor CVH) | 11 |
| Dong, et al., 2017 [50] | China (Beijing) | Cross-sectional | 4,309 | • Male & female • Urban • Ages 6–18y |
Ideal (≥6/7) | Age, sex, income, survey year | Greater educational attainment associated with greater likelihood of ideal CVH | 10 |
| Ghimire, et al., 2020 [21] | Nepal (STEPS) | Cross-sectional | 3,238 | • Male & female • Ages 15–69y |
Ideal (≥5/7) | Age, sex, ethnicity, ecological zone, marital status, urbanicity | Greater educational attainment associated with lower likelihood of ideal CVH | 12 |
| Jankovic, et al., 2015 [47] | Bosnia (NHS) | Cross-sectional | 3,601 | • Male & female • Ages ≥25y |
Total score (0–14) | Age, sex, employment, marital status, settlement type, wealth | Greater educational attainment associated with higher ideal CVH scores | 10 |
| Jankovic, et al., 2019 [52] | Serbia (NHS) | Cross-sectional | 11,746 | • Male & female • CVD-free • Ages >20y |
Ideal (≥6/7) | Age, sex, marital status, settlement type, wealth | Greater educational attainment associated with greater likelihood of ideal CVH | 10 |
| Machado, et al., 2018 [48] | Brazil (ELSA-Brasil) | Cross-sectional | 13,356 | • Male & female • Civil servants • CVD-free • Ages 35–74y |
Total score (0–7) | Age, sex, income, race/ethnicity, study site | Lower educational attainment associated with lower ideal CVH prevalence | 9 |
| McKenzie, et al., 2020 [19] | Jamaica (NHS) | Cross-sectional | 1,025 | • Male & female • Urban • Ages ≥20y |
Ideal (≥5/7) | Age, wealth | Mixed associations between educational attainment and ideal CVH by sex | 10 |
| Pengpid & Peltzer, 2021 [54] | Malawi (WHO STEPS) | Cross-sectional | 3,441 | • Male & female • Ages 18–69y |
Ideal (≥5/7) | Age, sex, employment status, urbanicity | No evidence of association between educational attainment and likelihood of ideal CVH | 11 |
| Pengpid & Peltzer, 2022 [55] | Bhutan (STEPS) | Cross-sectional | 9,712 | • Male & female • CVD-free • Ages 20–69y |
Ideal (≥5/7) | Age, sex, household size, employment status, urbanicity | Mixed associations between years of education and ideal CVH by sex | 10 |
| Zhao, et al., 2016 [51] | China (Hanzhong) | Cross-sectional | 2,693 | • Male & female • Rural • Ages 20–80y |
Ideal (≥6/7) | Age, sex, wealth, alcohol use, diagnosed health conditions, family health history, marital status | Greater educational attainment associated with greater likelihood of ideal CVH | 11 |
For more information about each study, including full results, see Supplemental Table S2.
Studies assessed ideal CVH using a 7-point measure reflecting participants total number of ideal metrics or using a 14-point measure that scored metrics as poor (0), intermediate (1) or ideal (2).
Study quality scores ranged from 0 to 13, with higher values indicating higher quality (i.e. lower risk of bias).Add Health = national longitudinal study of adolescent health; ARIC = Atherosclerosis Risk in Communities; BRFSS = Behavior Risk Factor Surveillance System; CRONICAS = center of excellence in chronic diseases study; CV Risk = study on nutrition and cardiovascular risk; ELSA-Brasil=Brazilian longitudinal study of adult health; HELEN = healthy lifestyle in Europe by nutrition in adolescence; JHS = jackson heart study; NCD = China non-communicable disease surveillance 2010; MESA = multi-ethnic study of atherosclerosis; NHANES = national health and nutrition examination survey; NHS = national health survey; STEPS = steps survey of noncommunicable disease.
Table 4.
Results from studies examining ideal cardiovascular health (CVH) in relation to income/wealth*.
| Reference | Country (study/setting) | Study design | N | Sample description | Ideal CVH measure† | Covariate adjustment | Main finding | Quality score‡ |
|---|---|---|---|---|---|---|---|---|
|
| ||||||||
| High-Income Countries | ||||||||
| Cabeza de Baca, et al., 2019 [86] | USA (WHS) | Cross-sectional | 22,048 | • Female • Healthcare professionals • CVD-free • Ages 68–78y |
Categorical (≥6 vs. ≤3/7) | Age, education, race/ethnicity | Greater financial strain associated with lower likelihood of ideal CVH (vs. poor CVH) | 7 |
| De Moraes, et al., 2019 [35] | USA (MESA) | Cross-sectional | 6,792 | • Male & female • White, Black, Latinx, Chinese Am. • CVD-free • Ages 45–84y |
Poor (≤7/14) | Age, education, neighborhood SES, occupation, study site | Mixed associations between income and likelihood of poor CVH by race and sex | 9 |
| Egan, et al., 2020 [82] | USA (NHANES) | Cross-sectional | 32,803 | • Male & female • White, Black, Latinx • CVD-free • Ages ≥20y |
Categorical (≥10 vs. ≤4/14) | Age, sex, education, race/ethnicity, health insurance, survey year | Greater income associated with greater likelihood of ideal CVH (vs. poor CVH) | 10 |
| Foraker, et al., 2019 [83] | USA (JHS) | Cross-sectional | 3,667 | • Male & female • Black • Ages 45–64y |
Total score (0–14) | Age, sex | Greater income associated with higher ideal CVH scores; Greater neighborhood-level income associated with higher ideal CVH scores | 10 |
| Gebreab, et al., 2015 [10] | USA (BRFSS) | Cross-sectional | 281,198 | • Male & female • Ages ≥18y |
Poor (<5/14) | Age, sex, education, race/ethnicity, state-level characteristics | Lower income associated with greater likelihood of poor CVH | 7 |
| Harrison, et al., 2019 [85] | Canada (Quebec) | Cross-sectional | 777 | • Male & female • Francophone • Ages 18–65y |
Total score (0–7) | Age, sex | Greater income associated with higher ideal CVH scores | 9 |
| Henriksson, et al., 2018 [73] | 9 EU countries (HELENA) | Cross-sectional | 637 | • Male & female • Ages 13–16y |
Total score (0–7) | Age, sex | No evidence of association between family affluence and ideal CVH scores | 11 |
| Lassale, et al., 2022 [34] | USA (ARIC) | Longitudinal (6y) | 11,049 | • Male & female • Black & White • Ages 45–64y |
Ideal (≥8/14) | Age, sex, race, education, work status | Lower income associated with greater likelihood of CVH degradation and lower likelihood of CVH improvement | 13 |
| Lawrence, et al., 2018 [37] | USA (Add Health) | Longitudinal (15y) | 11,200 | • Male & female • Ages 24–34y |
Ideal (≥6/7) | Age, sex, race/ethnicity, education, adolescent health factors Age, sex, race/ethnicity, education, adolescent family income, adolescent health factors, young adult income and social factors |
Greater income-to-needs ratio in adolescence associated with greater likelihood of ideal CVH in adulthood Greater income-to-needs ratio in adulthood associated with greater likelihood of ideal CVH in adulthood | 11 |
| Yang, et al., 2014 [42] | USA (NHANES) | Cross-sectional | 8,834 | • Male & female • White, Black, Mexican Am. • Ages 12–17y |
Total score (0–7) | Age, sex, race/ethnicity, education | Greater income associated with higher ideal CVH scores | 12 |
| Low- and Middle-Income Countries | ||||||||
| Benziger, et al., 2018 [53] | Peru (CRONICAS) | Cross-sectional | 3,058 | • Male & female • Ages ≥35y |
Ideal (≥5/7) | Age, sex, education, urbanicity | Greater wealth associated with lower likelihood of ideal CVH | 10 |
| Dong, et al., 2017 [50] | China (Beijing) | Cross-sectional | 4,309 | • Male & female • Urban • Ages 6–18y |
Ideal (≥6/7) | Age, sex, education, survey year | Greater income associated with greater likelihood of ideal CVH | 10 |
| Jankovic, et al., 2015 [47] | Bosnia (NHS) | Cross-sectional | 3,601 | • Male & female • Ages ≥25y |
Total score (0–14) | Age, sex, education, employment, marital status, settlement type | No evidence of association between wealth and ideal CVH scores | 10 |
| Jankovic, et al., 2019 [52] | Serbia (NHS) | Cross-sectional | 11,746 | • Male & female • CVD-free • Ages ≥20y |
Ideal (≥6/7) | Age, sex, education, marital status, settlement type | Greater wealth associated with greater likelihood of ideal CVH | 10 |
| Machado, et al., 2018 [48] | Brazil (ELSA-Brasil) | Cross-sectional | 13,356 | • Male & female • Civil servants • CVD-free • Ages 35–74y |
Total score (0–7) | Age, sex, education, race/ethnicity, study site | Lower income associated with lower ideal CVH prevalence | 9 |
| McKenzie, et al., 2020 [19] | Jamaica (NHS) | Cross-sectional | 1,025 | • Male & female • Urban • Ages ≥20y |
Ideal (≥5/7) | Age, education, land value | Mixed associations between wealth and likelihood of ideal CVH by sex | 10 |
| Zhao, et al., 2016 [51] | China (Hanzhong) | Cross-sectional | 2,693 | • Male & female • Rural • Ages 20–80y |
Ideal (≥6/7) | Age, sex, education, alcohol consumption, diagnosed health conditions, family health history, marital status | No evidence of association between wealth and likelihood of ideal CVH | 11 |
For more information about each study, including full results, see Supplemental Table S3.
Studies assessed ideal CVH using a 7-point measure reflecting participants total number of ideal metrics or using a 14-point measure that scored metrics as poor (0), intermediate (1) or ideal (2).
Study quality scores ranged from 0 to 13, with higher values indicating higher quality (i.e. lower risk of bias).Add Health = national longitudinal study of adolescent health; BRFSS = behavior risk factor surveillance system; CRONICAS = center of excellence in chronic diseases study; ELSA-Brasil = Brazilian longitudinal study of adult health; HELENA = healthy lifestyle in Europe by nutrition in adolescence; JHS = jackson heart study; MESA = multi-ethnic study of atherosclerosis; NHANES = national health and nutrition examination survey; NHS = national health survey; WHS = women’s health study.
Table 5.
Results from studies examining ideal cardiovascular health (CVH) in relation to employment and occupation*.
| Reference | Country (study/setting) | Study design | N | Sample description | Ideal CVH measure† | Covariate adjustment | Main finding | Quality score‡ |
|---|---|---|---|---|---|---|---|---|
|
| ||||||||
| High-Income Countries | ||||||||
| Benderly, et al., 2017 [39] | Israel (Hadera) | Cross-sectional | 1,104 | • Male & female • Urban • Ages 25–74y |
Ideal (≥6/7) | Age, education, ethnicity, marital status, living arrangements | Greater professional prestige associated with greater likelihood of ideal CVH | 10 |
| De Moraes, et al., 2019 [35] | USA (MESA) | Cross-sectional | 6,792 | • Male & female • White, Black, Latinx & Chinese Am. • CVD-free • Ages 45–84y |
Poor (≤7/14) | Age, education, income, neighborhood SES, study site | Mixed associations between occupation and likelihood of poor CVH by sex | 9 |
| Estrella, et al., 2018 [45] | USA (HCHS/SOL) | Cross-sectional | 11,840 | • Male & female • Latinx • CVD-free • Ages 18–74y |
Ideal (≥11/14) | Age, education, income, ethnicity, health insurance coverage, years lived in the US/nativity | Mixed associations between employment status and ideal CVH prevalence by sex; Mixed associations between occupation and ideal CVH prevalence by sex | 12 |
| Lassale, et al., 2022 [34] | USA (ARIC) | Longitudinal (6y) | 11,049 | • Male & female • Black & White • Ages 45–64y |
Ideal (≥8/14) | Age, sex, race, education, income | Mixed associations between work status and likelihood of CVH improvement or degradation | 13 |
| Lawrence, et al., 2018 [37] | USA (Add Health) | Longitudinal (15y) | 11,200 | • Male & female • Ages 24–34y |
Ideal (≥6/7) | Age, sex, race/ethnicity, parent education, adolescent family income, and adolescent health behaviors | No evidence of association between employment status in adulthood and ideal CVH prevalence in adulthood | 11 |
| Nriagu, et al., 2021 [43] | USA (WHI) | Cross-sectional | 67,656 | • Female • CVD-free • Ages 50–79y |
Poor (≤2/7) | Age, race/ethnicity, marital status, education, income | Mixed associations between occupation and likelihood of poor CVH | 9 |
| Shockey, et al., 2016 [44] | USA (BRFSS) | Cross-sectional | 66,609 | • Male & female • Employed • Ages >18y |
Poor (≤2/7) | Age, sex, education, race/ethnicity | Mixed associations between occupation and prevalence of poor CVH | 7 |
| Low- and Middle-Income Countries | ||||||||
| Jankovic, et al., 2015 [47] | Bosnia (NHS) | Cross-sectional | 3,601 | • Male & female • Ages ≥25y |
Total score (0–14) | Age, sex, education, employment status, marital status, settlement type, wealth index | Employment status associated with higher ideal CVH scores | 10 |
| Pengpid & Peltzer, 2021 [54] | Malawi (WHO STEPS) | Cross-sectional | 3,441 | • Male & female • Ages 18–69y |
Ideal (≥5/7) | Age, sex, education, urbanicity | No evidence of association between employment status and ideal CVH | 11 |
| Pengpid & Peltzer, 2022 [55] | Bhutan (STEPS) | Cross-sectional | 9,712 | • Male & female • CVD-free • Ages 20–69y |
Ideal (≥5/7) | Age, sex, education, household size, urbanicity | No evidence of association between employment status and ideal CVH | 10 |
For more information about each study, including full results, see Supplemental Table S4.
Studies assessed ideal CVH using a 7-point measure reflecting participants total number of ideal metrics, or using a 14-point measure that scored metrics as poor (0), intermediate (1) or ideal (2).
Study quality scores ranged from 0 to 13, with higher values indicating higher quality (i.e. lower risk of bias).Add Health = national longitudinal study of adolescent health; BRFSS = behavior risk factor surveillance system; HCHS/SOL = hispanic community health study/study of latinos; MESA = multi-ethnic study of atherosclerosis; NHS = national health survey; WHI = women’s health initiative.
Table 6.
Results from studies examining ideal cardiovascular health (CVH) in relation to composite measures of socioeconomic status (SES)*.
| Reference | Country (study/setting) | Study design | N | Sample description | Ideal CVH measure† | Covariate adjustment | Main finding | Quality score‡ |
|---|---|---|---|---|---|---|---|---|
|
| ||||||||
| High-Income Countries | ||||||||
| Boylan, et al., 2017 [32] | USA (MIDUS) | Longitudinal (9–10y) | 1,012 | • Male & female • Ages 35–86y |
Total score (0–14) | Age, sex, race, baseline smoking, physical activity, hypertension, diabetes, cholesterol medication use, chronic health conditions, neighborhood SES Age, sex, race, individual SES, neighborhood SES, baseline smoking, physical activity, hypertension, diabetes, cholesterol medication use, and chronic health conditions |
Greater SES associated with higher ideal CVH scores Greater neighborhood-level SES associated with higher ideal CVH scores |
11 |
| De Moraes, et al., 2019 [35] | USA (MESA) | Cross-sectional | 6,792 | • Male & female • White, Black, Latinx & Chinese Am. • CVD-free • Ages 45–84y |
Poor (≤7/14) | Age, education, income, occupation, study site | Lower SES associated with greater likelihood of poor CVH | 9 |
| Empana, et al., 2016 [79] | France (Paris) | Cross-sectional | 8,916 | • Male & female • Ages 50–75y |
Categorical (≥5 vs. ≤2/7) | Age, alcohol consumption, depressive symptoms, education, self-perceived health | Higher levels of deprivation associated with lower likelihood of ideal CVH | 10 |
| Matthews, et al., 2017 [38] | USA (Pittsburgh) | Longitudinal (17–28y) | 307 | • Male • White & Black • Ages 13–16y |
Total score (0–14) | High risk screening status, race, adult SES | No evidence of association between family SES in adolescence and adult CVH scores; Higher SES in adulthood associated with higher CVH scores | 11 |
| Savelieva, et al., 2017 [46] | Finland (Young Finns) | Longitudinal (32y) | 697 | • Male & female • Ages 3–18y |
Total score (0–7) | Age, sex, adult SES, childhood CV risk factors, chronic conditions | Greater childhood SES associated with higher ideal CVH scores in adulthood; Upward socioeconomic mobility from childhood to adulthood associated with higher ideal CVH scores in adulthood | 12 |
| Low- and Middle-Income Countries | ||||||||
| Bi, et al., 2015 [49] | China (NCD) | Cross-sectional | 96,121 | • Male & female • Ages ≥20y |
Categorical (≥6 vs. ≤1/7) | Age, sex, education, medical insurance, urbanicity | Lower economic development associated with greater likelihood of ideal CVH | 11 |
| Oliveira, et al., 2021 [57] | Brazil (Pelotas) | Repeated cross-sectional (4y) | 2,236 | • Male & female • Age 18 |
Ideal (≥4/7) | Sex, skin color | Mixed associations between socioeconomic position and likelihood of ideal CVH by sex | 10 |
| Ren, et al., 2016 [56] | China (Shandong) | Cross-sectional | 15,350 | • Male & female • Ages 18–69y |
Ideal (≥5/7) | Age, income, education | Greater SES associated with greater likelihood of ideal CVH | 12 |
For more information about each study, including full results, see Supplemental Table S5.
Studies assessed ideal CVH using a 7-point measure reflecting participants total number of ideal metrics, or using a 14-point measure that scored metrics as poor (0), intermediate (1) or ideal (2).
Study quality scores ranged from 0 to 13, with higher values indicating higher quality (i.e. lower risk of bias).MESA = multi-ethnic study of atherosclerosis; MIDUS = midlife in the United States study; NCD = China non-communicable disease surveillance 2010.
Table 7.
Results from studies examining ideal cardiovascular health (CVH) in relation to race/ethnicity*.
| Reference | Country (study/setting) | Study design | N | Sample description | Ideal CVH measure† | Covariate adjustment | Main finding | Quality score‡ |
|---|---|---|---|---|---|---|---|---|
|
| ||||||||
| High-Income Countries | ||||||||
| Bambs, et al., 2011 [78] | USA (Pittsburgh) | Cross-sectional | 1,933 | • Male & female • Ages 45–75y |
Ideal (≥5/7) | Age, sex, income | Black individuals had a lower likelihood of ideal CVH than White individuals | 10 |
| Benderly, et al., 2017 [39] | Israel (Hadera) | Cross-sectional | 1,104 | • Male & female • Urban • Ages 25–74y |
Ideal (≥6/7) | Age, education, crowding, marital status, occupation | Arab individuals had a lower likelihood of ideal CVH than Jewish individuals | 10 |
| Brown, et al., 2018 [11] | USA (NHANES) | Repeated cross-sectional (26y) | 40,876 | • Male & female • White, Black, Mexican Am. • CVD-free • Ages ≥25y |
Ideal (≥10/14) | Age, sex, education, income-poverty ratio | Black, US-born Mexican Am., and non-US born Mexican Am. individuals had a lower prevalence of ideal CVH than White individuals | 10 |
| Burroughs, et al., 2019 [40] | USA (WHS) | Cross-sectional | 25,062 | • Female • Health professionals • CVD-free • Ages 68–78y |
Total score (0–7) | Age, education, income, cumulative psychosocial stress | Black and Asian Am. individuals had lower ideal CVH scores than White individuals; No evidence of difference between Latinx and White individuals | 8 |
| Gebreab, et al., 2015 [10] | USA (BRFSS) | Cross-sectional | 281,198 | • Male & female • Ages ≥18y |
Poor (<5/14) | Age, sex, education, income, state-level effects | Latinx individuals had lower likelihood of poor CVH than White individuals; Black individuals and those of other ethnicities had greater likelihood of poor CVH than White individuals | 7 |
| Lassale, et al., 2022 [34] | USA (ARIC) | Longitudinal (6y) | 11,049 | • Male & female • Black & White • Ages 45–64y |
Ideal (≥8/14) | Age, sex, education, income, work status | Black individuals had greater likelihood of CVH degradation and lower likelihood of CVH improvement than White individuals | 13 |
| Lawrence, et al., 2018 [37] | USA (Add Health) | Longitudinal (15y) | 11,200 | • Male & female • Ages 24–34y |
Ideal (≥6/7) | Age, sex, education, adolescent family income, adolescent health factors, young adult income and social factors | No evidence of difference in likelihood of ideal CVH Latinx and White individuals; Black individuals and those of other ethnicities had lower likelihood of ideal CVH than White individuals | 11 |
| Le-Scherban, et al., 2016 [33] | USA (MESA) | Longitudinal (11y) | 6,446 | • Male & female • White, Black, Latinx, Chinese Am. • CVD-free • Ages 45–84y |
Total score (0–14) | Age, sex, education, study site | Foreign-born individuals had higher ideal CVH scores than US-born individuals at baseline, but experienced a larger decline in ideal CVH scores over time | 12 |
| Lee, et al., 2021 [87] | USA (MIDUS) | Cross-sectional | 1,948 | • Male & female • Black, White • Ages 25–74y |
Total score (0–14) | Age, family health history, study sample | Black men and women had lower ideal CVH scores than White men; White women had higher ideal CVH scores than White men | 11 |
| Mujahid, et al., 2017 [88] | USA (MESA) | Cross-sectional | 5,263 | • Male & female • Black, White, Latinx • CVD-free • Ages 45–84y |
Ideal (≥11/14) | Age, sex, education, income, study site | Black and Latinx individuals had lower likelihood of ideal CVH than White individuals | 10 |
| Ogunmoroti et al., 2017 [41] | USA (Miami) | Cross-sectional | 9,056 | • Male & female • Employed • Ages 31–55y |
Ideal (≥6/7) | Age, sex, education | Latinx individuals had greater likelihood of ideal CVH than White individuals; Black individuals and those of other ethnicities had lower likelihood of ideal CVH than White individuals | 9 |
| Thomas, et al., 2019 [36] | USA (New York City) | Cross-sectional | 1,691 | • Male & female • Afro-Caribbean • Ages ≥18y |
Ideal (≥4/7) | Age, sex, education, employment, health insurance, healthcare access | Guyanese and Haitian individuals who lived in the US for ≥10y had a greater likelihood of ideal CVH than those who lived in the US for <10y; No evidence of differences by nativity among Jamaican individuals | 7 |
| Yang, et al., 2014 [42] | USA (NHANES) | Cross-sectional | 8,834 | • Male & female • White, Black, Mexican Am. • Ages 12–17y |
Total score (0–7) | Age, sex, education, income | From 1999–2010, Black and Mexican individuals had lower ideal CVH scores than White individuals; No evidence of difference between those of other ethnicities and White individuals | 12 |
| Low- and Middle-Income Countries | ||||||||
| Ghimire, et al., 2020 [21] | Nepal (STEPS) | Cross-sectional | 3,238 | • Male & female • Ages 15–69y |
Ideal (≥5/7) | Age, sex, education, ecological zone, marital status, urbanicity | No evidence of difference in likelihood of ideal CVH between advantaged and disadvantaged ethnic groups | 12 |
| Machado, et al., 2018 [48] | Brazil (ELSA-Brasil) | Cross-sectional | 13,356 | • Male & female • Civil servants • CVD-free • Ages 35–74y |
Total score (0–7) | Age, sex, education, income, study site | Black and Pardo individuals had lower prevalence of ideal CVH than White individuals * Classification in the Brazilian National Census that indicates both White and Black ancestry |
9 |
For more information about each study, including full results, see Supplemental Table S6.
Studies assessed ideal CVH using a 7-point measure reflecting participants total number of ideal metrics, or using a 14-point measure that scored metrics as poor (0), intermediate (1) or ideal (2).
Study quality scores ranged from 0 to 13, with higher values indicating higher quality (i.e. lower risk of bias).ADD health = national longitudinal study of adolescent health; BRFSS = behavior risk factor surveillance system; ELSA-Brasil = Brazilian longitudinal study of adult health; MESA = multi-ethnic study of atherosclerosis; MIDUS = midlife in the United States Study; NHANES = national health and nutrition examination survey; NHS = national health survey; STEPS = STEPS survey of noncommunicable disease; WHS = women’s health study.
Fig. 3.
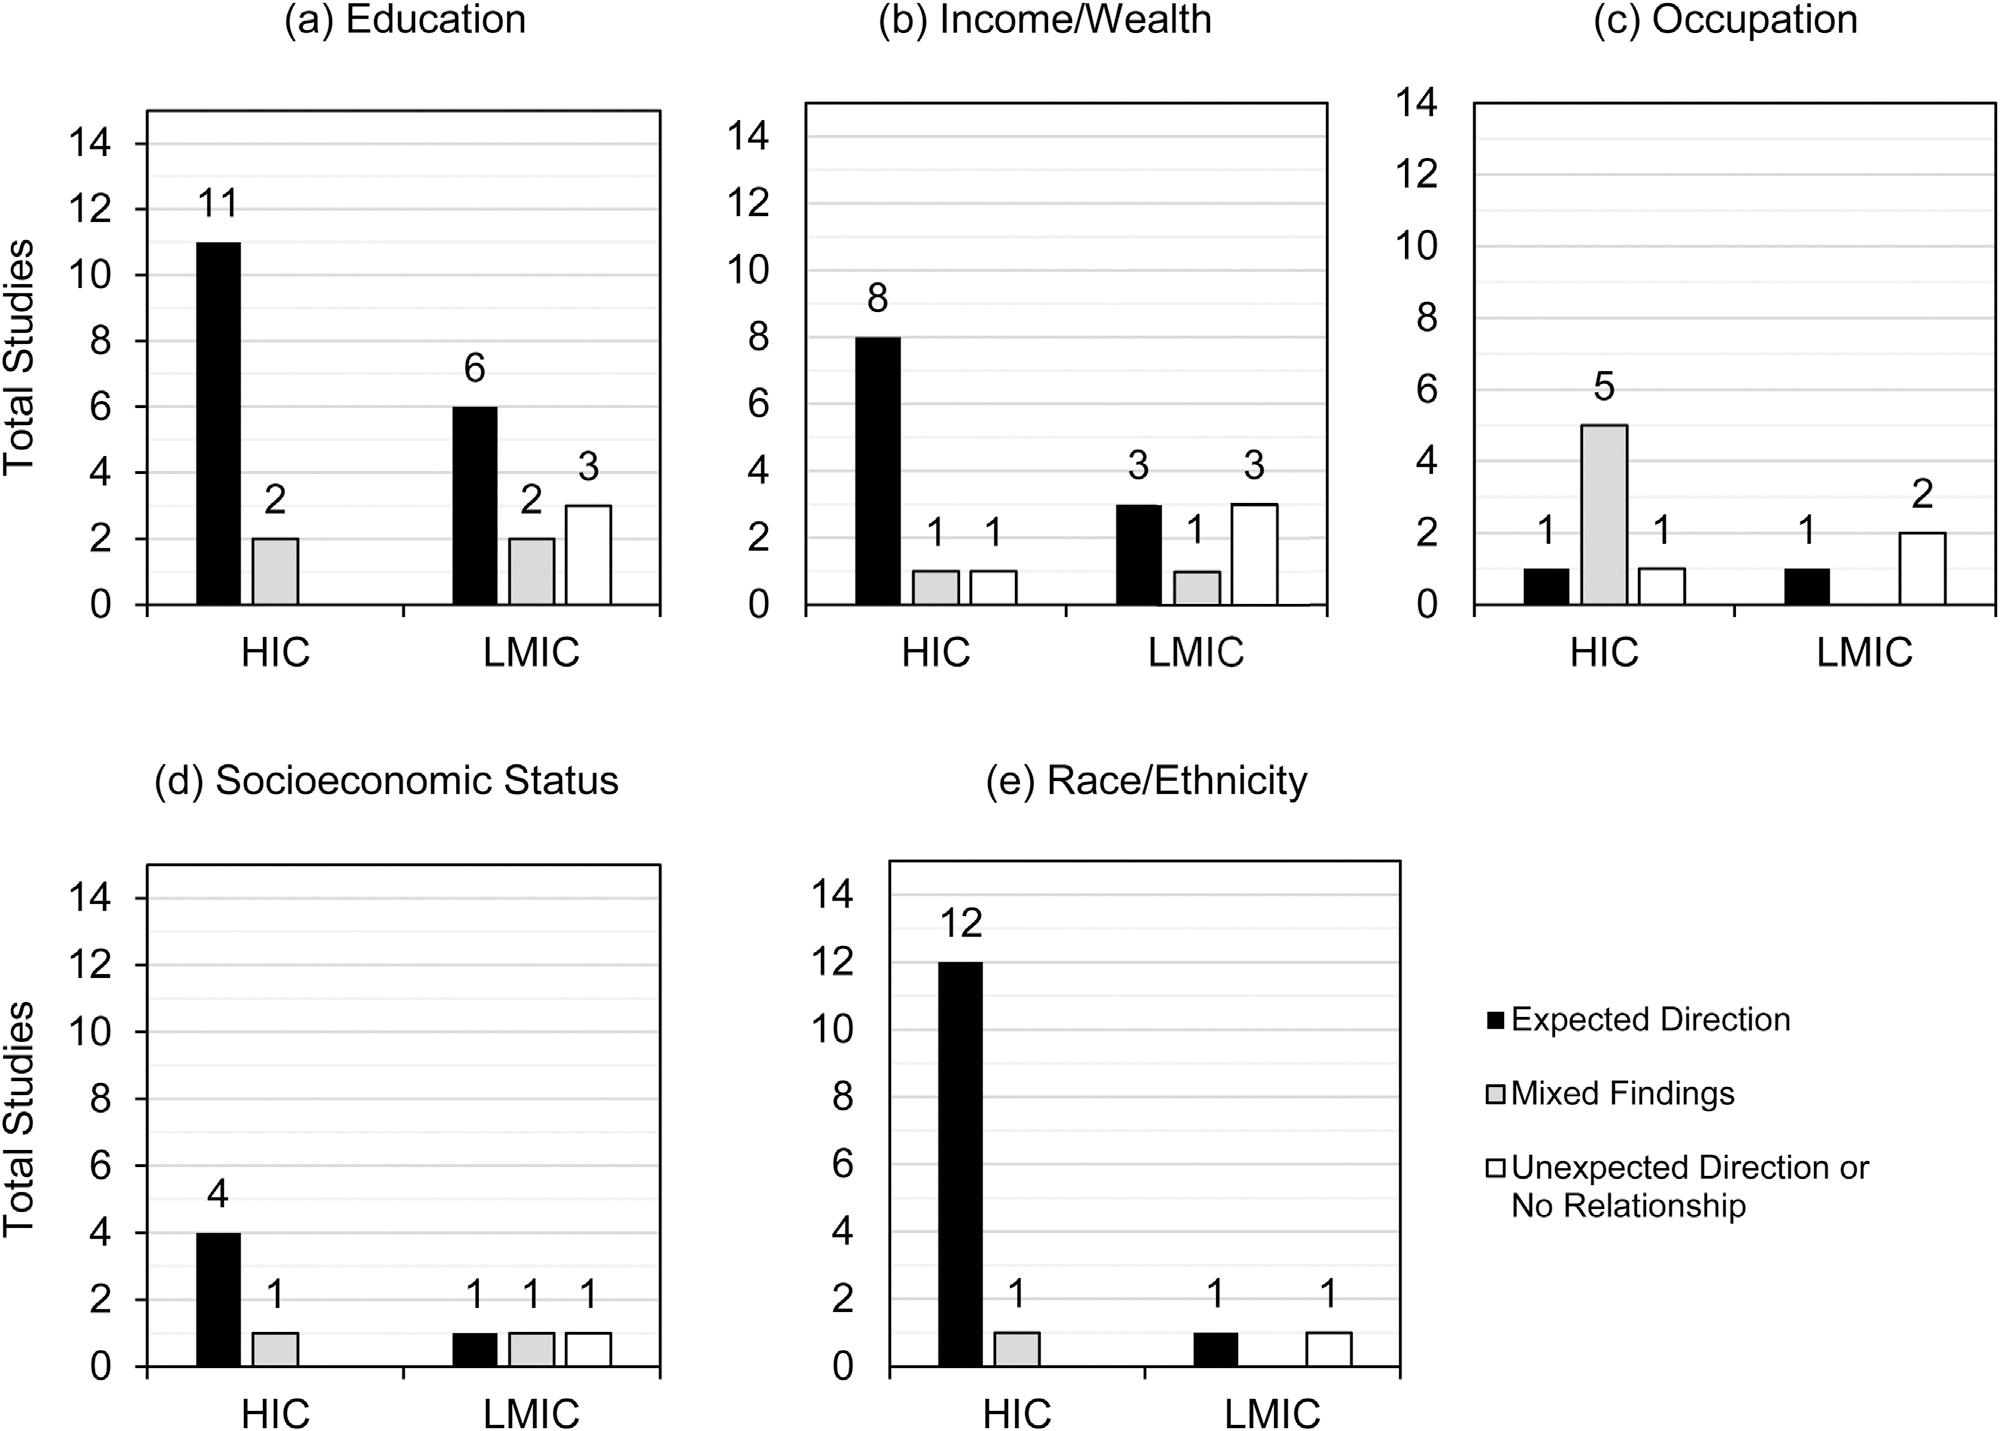
Summary of direction of association reported in studies examining associations between ideal cardiovascular health and (A) education (N = 24), (B) income/wealth (N = 17), (C) occupation (N = 10), (D) socioeconomic status (N = 8), and (E) race/ethnicity (N = 15).*.
High-income countries
Education (n = 13) and race/ethnicity (n = 13) were the most commonly studied social determinants in HICs, followed by income/wealth (n = 10), occupation and employment (n = 7), and SES (n = 5). Findings indicated a robust relationship between higher social status and ideal CVH in nearly every domain. More specifically, higher educational attainment, income/wealth, and composite SES were consistently associated with better CVH in studies conducted in the U.S., Canada, and various European countries. While no unexpected results were reported, some studies found evidence of mixed associations, which could be grouped into two categories: 1) expected associations were found among most individuals, but null or unexpected findings were apparent in specific subgroups (e.g. by gender or race/ethnicity); [35,36] and 2) investigations that did not find evidence for a longitudinal relationship of adult CVH with social determinants measured in adolescence but did find evidence for concomitant associations with social determinants measured in adulthood [37,38].
With respect to studies investigating racial/ethnic differences, all were based in the U.S., with the exception of one study from Israel that examined differences between Jewish and Arab adults [39]. Overall, findings indicated that racial/ethnic groups with the highest social standing (i.e. white individuals in the U.S., Jewish individuals in Israel) were more likely to have ideal CVH compared to marginalized racial/ethnic groups (e.g. Black individuals in the U.S., Arab individuals in Israel). In the U.S., differences in ideal CVH between white individuals and members of other racial/ethnic groups (e.g. Latinx, Asian American, or other) were mixed. While many studies found that these latter groups had worse CVH [10,11,37,40–42], some found that they were more likely to have ideal CVH than white individuals [10,41] and others found no sizeable differences. [37,40,42]
Few studies examined employment and occupation (n = 7). Those that did were characterized by substantial heterogeneity, both in regards to exposure measurement and study findings. For example, some studies assessing occupation characterized occupational categories as reflecting levels of professional prestige [37,40,42], while others did not articulate how occupational categories reflected underlying social structures [43,44], making the interpretation of results challenging. Overall, only one study found associations in the expected direction, [39] while others reported mixed [34,35,43–45] or null [37] results.
Overall, no clear pattern in study quality was noted in findings from HICs. However, studies with the strongest designs (i.e. longitudinal) were somewhat mixed. Investigations among adults examining social determinants measured at one time point in relation to repeated measures of ideal CVH over a decade found associations with education, [45] income, [45] composite SES [32] and race/ethnicity [33,34] in the expected direction. On the other hand, prospective associations between family socioeconomic factors measured in childhood and adult ideal CVH [37,38,46] were inconsistent. Two U.S.-based studies found no evidence of associations [28,29], while one Finnish study found robust evidence that higher composite SES in childhood was associated with greater likelihood of having ideal CVH [35]. Additionally, in this Finnish study, individuals who experienced upward socioeconomic mobility from childhood to adulthood (defined as increases in SES over time) had better ideal CVH at midlife compared to those whose SES was stable from childhood to adulthood [35].
Low- and middle-income countries
For the most part, findings from LMICs mirrored those from HICs, in that higher social status was generally related to better ideal CVH; however, only 11 studies were conducted in these settings and all were cross-sectional. There was also slightly more heterogeneity observed in findings compared to HICs. Overall, education was the most commonly investigated social determinant (n = 11), followed by income/wealth (n = 7) and composite SES (n = 3). Few studies explored associations with occupation or employment (n = 3) or race/ethnicity (n = 2). Associations between education and ideal CVH were in the expected direction in studies from Bosnia, [47] Brazil, [48] China [49,50,51], and Serbia [52]. However, two studies found no relationship between education and ideal CVH in Peru [53] and Malawi, [54] and some mixed and unexpected findings were also reported [19,21,55]. In one study conducted in Bhutan, greater education was associated with a greater likelihood of ideal CVH among women, but no association was noted among men [55]. In contrast, a study conducted in Jamaica [19] found that lower levels of education were associated with a lower likelihood of ideal CVH for women but a greater likelihood for men. Similarly, lower levels of education were also related to greater CVH among adults in Nepal [21]. However, the confidence intervals for the effect estimates reported in these studies included the null value.
With respect to income/wealth, higher levels were related to greater ideal CVH among adults in Brazil [48] and Serbia, [52] and among urban youth in China [50]. However, no association was noted among adults in Bosnia [47] or those residing in rural areas in northern China, [51] despite both studies’ sizeable samples (e.g. n > 2,500) [51]. Mixed or unexpected findings were also reported in Jamaica [19] and Peru [53]. Among the 3 studies that examined patterns by composite SES, results were inconclusive. While one study of adults in Shandong, China found that individuals with higher SES were more likely to have ideal CVH, [56] another carried out across the entire country found that living in a lower SES area was associated with a greater likelihood of ideal CVH [48]. Furthermore, one Brazilian study [57] found expected associations between SES and ideal CVH among women but inverse associations among men.
Relationships between ideal CVH and occupation (n = 3) or race/ethnicity (n = 2) were understudied in LMICs and findings were somewhat mixed. While one study from Bosnia found expected associations with respect to employment status, [47] studies from Malawi [54] and Bhutan [55] indicated no apparent associations. Among the two studies that examined associations with race/ethnicity, one conducted in Brazil [48] reported associations with race in the expected direction, while another from Nepal [21] reported no differences by ethnicity. As was the case in studies from HICs, there was no evidence that the relationship between social determinants and patterns in ideal CVH were related to differences in study quality.
Discussion
Social disparities in ideal CVH: A global phenomenon?
Since ideal CVH was defined, studies from around the world have found that very few adults meet recommendations for all 7 metrics, [6] including in LMICs where the burden of CVD is steadily increasing [7]. In this review, we systematically evaluated research on the social determinants of ideal CVH and we found considerably more studies are conducted in HICs than LMICs. With respect to specific social determinants, education and income/wealth were commonly studied in both HICs and LMICs, but less work examined associations with employment and occupation or composite measures of SES. There was also a dearth of research investigating racial/ethnic disparities in ideal CVH outside of the U.S. Notably, our results indicated that higher social status individuals are more likely to have better CVH in both HICs and LMICs. In HICs, associations were largely consistent across studies of most social determinants, with the exception of studies examining employment and occupation, which yielded mixed results. Findings from LMICs were somewhat more heterogenous; however, given the scarcity of studies from LMICs, it is unclear whether these findings reflect true differences by country context.
Most studies we evaluated suggested that inequities in ideal CVH are evident in both HICs and LMICs with respect to multiple social determinants of health, but particularly education and income/wealth. These factors are widely considered to be “fundamental causes” of disease because they reflect an individual’s access to resources in society, including knowledge, financial capital, social connections, and power [58]. Although the studies included in this review describe overall patterns, a large body of research has documented the direct and indirect pathways by which health disparities are established [59,60], including through inequitable social systems and structures [61] that increase low status individuals’ exposure to societal, interpersonal, and individual-level risk factors (e.g. material disadvantage, [60] environmental toxicants, [62] discrimination, [63] and other forms of psychosocial stress [64]). The associations we noted – particularly with education and income/wealth – are reminders that where there is social inequity, it is likely to play a robust role in shaping the population distribution of ideal CVH. Therefore, unified efforts to redress existing inequities through social policy [65] may help enhance health in both HICs and LMICs and reduce the global burden of CVD.
Gaps in the literature
Given the highly skewed geographic distribution of the studies included in this review, our findings also highlight important overlooked areas of research that warrant further attention. Most notably, we found that empirical work documenting the impact of social determinants of ideal CVH is predominantly carried out in HICs, which represent nearly three quarters of the evidence base but only 38% of countries worldwide. Of the reviewed studies conducted in LMICs, nearly all were from upper-middle-income countries and only one examined associations in a low-income country. The scarcity of reviewed studies from lower-middle and low-income countries – particularly in North Africa, Latin America, the Caribbean, Oceania, and Asia – is noteworthy because global cases of CVD will likely increase dramatically in these regions as their aging populations are expected to double by 2050 [13]. When considering included studies conducted in HICs, geographic representation was also quite limited, as the overwhelming majority were from the U.S. Although a few studies from HICs in Europe, other parts of North America, and the Middle East were included, no work examined the social determinants of ideal CVH in HICs in East Asia (e.g. Japan, Singapore) or Australia. Therefore, our comparative findings should be interpreted with caution.
We also identified gaps in the literature that relate to the social determinants of health that most studies investigated. In both HICs and LMICs, the majority of included studies focused on education and income/wealth, while fewer examined ideal CVH in relation to employment and occupation. Because no single factor can fully encompass SES, [9] examining associations across multiple factors that capture different socioeconomic domains can offer a more comprehensive understanding of differences by social standing. Studies examining occupational class are valuable because they can tap into relational dimensions of social position that may provide insight into underlying power dynamics that create social stratification in society [66,67]. Given the dearth of studies on employment and occupation in our review, it is difficult to draw conclusions based on our results. However, we did find that studies in this area were often characterized by poorly defined exposure measures that did not clearly articulate how occupational categories reflect underlying social structures. Future work in this area should draw on theory-driven approaches to examining employment and occupation as indicators of social standing [66,67,68].
Another social determinant that warrants further study is race/ethnicity. Racial/ethnic differences in health are manifestations of historical and ongoing structural racism against marginalized racial/ethnic groups [69,70]. Despite the fact that disparities are documented in societies around the world, the vast majority of research on ideal CVH came from the U.S., while only 3 studies explored this question in other countries. In many HICs, increased international migration has contributed to both greater racial/ethnic diversity [71] and higher levels of social inequity [72]. Examining racial/ethnic differences in ideal CVH in these settings may shed new light on the ways in which structural racism and other social forces may shape health globally, and highlight the importance of primordial prevention among overlooked marginalized groups.
We also noted some methodological gaps in existing literature that related to study design. Most research included in our review was based on cross-sectional data, which is insufficient to ascertain causal relationships because the assessment of social determinant exposures and ideal CVH occurs at the same time. As a result, findings from these studies may reflect reverse causal associations, namely individuals’ health status influencing their social standing rather than vice versa. While this may be less of a concern when studying social determinants that are fixed at birth (like race/ethnicity), it is a substantial limitation when examining the impact of socioeconomic indicators, which have robust bidirectional relationships with health across the life course [60]. Longitudinal studies that evaluate associations using socioeconomic factors measured prior to ideal CVH assessments provide a stronger basis for causal inference; however, we only identified 8 of such studies, all but one of which were conducted in HICs. To advance our understanding of the ways in which social determinants prospectively shape an individual’s likelihood of having ideal CVH and sustaining it over time – particularly in LMICs – more longitudinal research is needed.
Finally, another important gap relates to the age group most commonly examined. The vast majority of studies included in our review evaluated the social determinants of ideal CVH among adults, while only 3 focused on children and youth [42,50,73]. Since most children are believed to possess optimal CVH at birth, which gradually declines over time [74,75], studying the social determinants of ideal CVH early in life may help identify developmental windows when health deteriorative processes begin. Among studies in our review that sampled younger populations, all 3 were cross-sectional and found that lower social status has a bearing on ideal CVH during childhood and adolescence [42,50,73]. Notably, no work examined associations with ideal CVH measured in both childhood and adulthood. Future research should explore longitudinal associations starting early in life to identify periods that may be high priority targets for social policy aimed at fostering and sustaining ideal CVH across the lifespan [76,77].
Methodological inconsistencies
We also identified several methodological issues in ideal CVH measurement, operationalization, and analysis that are worth noting. Although the AHA established clear guidelines for the definition of each metric in their ideal CVH measure, we found substantial variability in how some metrics were assessed, with diet and physical activity frequently measured using different criteria than what was originally proposed. In many cases, there were only minor differences in the criteria that were used (e.g. some but not all dietary categories were assessed, or different thresholds for physical activity were used). However, some deviations from proposed guidelines were quite substantial. For example, numerous studies assessed diet based solely on fruit and vegetable consumption [10,38,44,53,78,79], and physical activity using simplified measures of the number of activities individuals engaged in during the course of a week [36,37,42,47,79]. Since these variations likely reflect different constraints facing researchers who conduct large-scale epidemiologic studies, it is important for future work to determine whether these different operationalizations of ideal CVH may influence study findings. Furthermore, the validation and standardization of abbreviated behavioral measures may be particularly beneficial for studies conducted in low-resource, LMIC settings.
While all studies included in our review used healthy levels of individual metrics to construct a composite measure of ideal CVH, scores often differed with regard to scale (e.g. 7-point vs. 14-point), and there was no consistency in how scores were analyzed. While some authors examined continuous ideal CVH scores as their primary outcome, others used count scores, categories of CVH (e.g. ideal, intermediate, high), or binary measures (e.g. ideal CVH, poor CVH). To further complicate matters, no universal threshold was used to define ideal (or other) levels of CVH. Despite this heterogeneity, our results indicated fairly robust relationships between several makers of social status and ideal CVH, suggesting that differences in the way ideal CVH was operationalized perhaps had little bearing on identifying associations with social determinants. However, to ensure that this is the case, researchers should consider conducting sensitivity analyses to verify that similar associations are observed when using different operationalizations of ideal CVH.
We also noted inconsistencies in how individuals with prior CVD diagnoses or those currently receiving treatment were handled in analyses. Among the studies included in this review, many excluded individuals with a history of CVD or those who reported taking medication altogether, thereby providing estimates of associations among a healthy sample. In other studies, authors often accounted for these factors when constructing ideal CVH scores (i.e. individuals with a history of CVD were defined as having poor CVH, or those with ideal levels of individual CVH metrics were defined as meeting recommended levels without the aid of medication) or included them as adjustment variables in statistical analyses. In doing so, these studies mitigate the threat of identifying reverse causal associations between social determinants and ideal CVH but are inconsistent with the AHA’s definition of CVH as only present in the absence of manifest disease [1]. In many instances, information on prior CVD history or treatment was not accounted for [10,19,36,41,48,56], possibly contributing to more biased estimates. To improve the rigor of studies moving forward, we recommend that future work uniformly accounts for prior CVD diagnoses and medication use following established AHA guidelines.
Finally, we also observed some variability in the covariate adjustment procedures used across studies. In general, authors rarely reported associations minimally adjusted for age and sex, likely because most results were from exploratory studies focused on multiple social determinants rather than a single exposure of interest. Relatedly, fully adjusted associations reported in many studies often included other related social determinants as covariates, which can have important implications for the interpretation of results depending on a study’s primary research question. For example, when considering racial/ethnic disparities, adjustment for socioeconomic factors may provide a uniquely informative estimate by describing associations over and above potential confounding effects of those factors, pointing to the potential role of structural and interpersonal forms of racism and discrimination that may not be captured by socioeconomic factors alone. At the same time, such a measure would underestimate the true extent of racial inequities since race/ethnicity is often strongly correlated with socioeconomic conditions [70]. With respect to the studies included in this review, most fully adjusted associations also adjusted for the other social determinants, and therefore may be overly conservative.
Limitations and strengths
This review has some limitations. Due to the varied measures authors used to characterize both ideal CVH and social determinants of health across studies, we did not carry out a formal meta-analysis. Instead, we summarized findings in a narrative synthesis. Doing so afforded us more latitude in interpreting results from studies that examined ideal CVH using different outcome measures, including count scores, categories of CVH, or binary measures of either ideal CVH or poor CVH. However, this approach also presented some challenges. Since thresholds used to define ideal levels of CVH varied between studies, findings may not be directly comparable. As a result, we were unable to report a single estimate of the magnitude of associations pooled across studies, and instead summarized overall trends by subjectively evaluating associations as being either in the expected direction, in the unexpected direction, null, or mixed. Informed by recent guidance, [80] we interpreted findings based on the direction and magnitude of point estimates rather than strictly adhering to P-value cutoffs. Other factors are also important to consider when interpreting research findings, so we also provided the full results reported in each study to allow readers to reach their own conclusions.
Since our review included any work that assessed a composite measure of ideal CVH without considering whether different criteria were used to define healthy levels of each individual CVH metric, we were able to include more studies from LMICs, where ideal CVH metrics were rarely characterized using the exact criteria defined by the AHA. This resulted in differences in operationalizations of ideal CVH across studies, but also a wide variation in how studies defined healthy levels of each individual CVH component. Thus, it is possible that non-uniform approaches to ideal CVH measurement may have contributed to the variation we observed in results, particularly in LMICs. Although we were not able to account for this directly in our review, it is worth noting that we formally evaluated the quality of ideal CVH measures used in each study in our risk of bias assessment and found no systematic differences.
Considering our synthesis of findings across HICs and LMICs, it is worth noting that our comparisons were premised on grouping countries with very different social, cultural, and political environments based on a somewhat crude measure of national income. We chose to use the World Bank’s classification of countries based on GNI per capita because it is a widely-used measure of country-level industrialization, and prior epidemiologic research has found that as countries become more industrialized, the leading causes of death transition from nutritional deficiencies and communicable diseases to chronic conditions related to aging, like CVD [16,17]. While our review provides preliminary evidence that social determinants of health shape ideal CVH similarly across multiple contexts, grouping countries as either HICs or LMICs likely obscured potentially important sources of between-country variation that may be informative for understanding population patterns in ideal CVH. Future work would benefit from using more nuanced country classifications to inform global comparisons.
This review also has numerous unique strengths. In addition to carrying out a wide search that spanned multiple social determinants of health, we also reviewed studies published in multiple languages, including English, Spanish, and Portuguese. Although we were limited by conducting our review in only three research databases, we believe that our searches covered the majority of work published in the three languages our research group was proficient in. PubMed and Embase house the bulk of biomedical research published in English around the world. The LILACs database includes over 500,000 scientific articles published in Latin America and the Caribbean. While it is possible that regions not represented by the studies we reviewed may have been excluded due to our language limitations, our work represents the most comprehensive review of the literature to date. Another strength of our review was our focus on community-based studies. While such research provides a comprehensive overview of patterns in ideal CVH globally, it is important to note that our findings may not be generalizable to patient populations. Notably, our review also has the unique strength of including a detailed analysis of the methods and measures used to examine associations between various social determinants and ideal CVH, which we hope will help enhance the quality of evidence in this area moving forward.
Conclusion
Devising transnational strategies to tackle the underlying processes that create social inequities in ideal CVH is critical to reduce the burden of CVD-related morbidity and mortality globally. In this study, we reviewed and synthesized research from HICs and LMICs that explored the impact of these factors on positive CVH using the AHA’s proposed measure of ideal CVH. Findings suggested that the inequitable distribution of ideal CVH – particularly by education and income/wealth – may be a global phenomenon. This work highlights the critical role social policy aimed at reducing inequality can play in improving CVH around the world.
Supplementary Material
Acknowledgments
Dr. Qureshi was supported by National Institutes of Health (NIH) grants T32 098,048 and T32 CA 009,001 at the Harvard T.H. Chan School of Public Health. Dr. Guimond was supported by the Canadian Institutes of Health Research and the Lee Kum Sheung Center for Health and Happiness. Dr. Delaney was supported by NIH grant T32MH017119 at the Harvard T.H. Chan School of Public Health. Dr. Kubzansky was supported by the Lee Kum Sheung Center for Health and Happiness. The content is solely the responsibility of the authors and does not necessarily represent the official views of the NIH.
Footnotes
No potential conflicts of interest relevant to this article were reported.
Supplementary materials
Supplementary material associated with this article can be found, in the online version, at doi:10.1016/j.annepidem.2022.09.006.
References
- [1].Lloyd-Jones DM, Hong Y, Labarthe D, Mozaffarian D, Appel LJ, Van Horn L, et al. Defining and setting national goals for cardiovascular health promotion and disease reduction: the American Heart association’s strategic impact goal through 2020 and beyond. Circulation 2010;121(4):586–613. doi: 10.1161/CIRCULATIONAHA.109.19270. [DOI] [PubMed] [Google Scholar]
- [2].Strasser T. Reflections on cardiovascular diseases. Interdisciplinary Sci Rev 1978;3(3):225–30. doi: 10.1179/030801878791925921. [DOI] [Google Scholar]
- [3].Wilkins JT, Ning H, Berry J, Zhao L, Dyer AR, Lloyd-Jones DM. Lifetime risk and years lived free of total cardiovascular disease. JAMA 2012;308(17):1795–801. doi: 10.1001/jama.2012.14312. [DOI] [PMC free article] [PubMed] [Google Scholar]
- [4].Aneni EC, Crippa A, Osondu CU, Valero-Elizondo J, Younus A, Nasir L, et al. Estimates of mortality benefit from ideal cardiovascular health metrics: a dose response meta-analysis. J Am Heart Assoc 2017;6(12):e006904. doi: 10.1161/JAHA.117.006904. [DOI] [PMC free article] [PubMed] [Google Scholar]
- [5].Fang N, Jiang M, Fan Y. Ideal cardiovascular health metrics and risk of cardiovascular disease or mortality: a meta-analysis. Int J Cardiol 2016;214:279–83. doi: 10.1016/j.ijcard.2016.03.210. [DOI] [PubMed] [Google Scholar]
- [6].Younus A, Aneni EC, Spatz ES, Osondu CU, Roberson L, Ogunmoroti O, et al. A systematic review of the prevalence and outcomes of ideal cardiovascular health in US and non-US populations. Mayo Clin Proc 2016;91(5):649–70. doi: 10.1016/j.mayocp.2016.01.019. [DOI] [PubMed] [Google Scholar]
- [7].Jankovic J, Mandic-Rajcevic S, Davidovic M, Jankovic S. Demographic and socioeconomic inequalities in ideal cardiovascular health: a systematic review and meta-analysis. PLoS ONE 2021;16(8):e0255959. doi: 10.1371/journal.pone.0255959. [DOI] [PMC free article] [PubMed] [Google Scholar]
- [8].World Health Organization. Closing the gap in a generation: health equity through action on the social determinants of health, https://www.who.int/social_determinants/final_report/csdh_finalreport_2008.pdf; 2008. [accessed 01.09.21]. [DOI] [PubMed]
- [9].Havranek EP, Mujahid MS, Barr DA, Blair IV, Cohen MS, Cruz-Flores S, et al. Social determinants of risk and outcomes for cardiovascular disease: A scientific statement from the American heart association. Circulation 2015;132(9):873–98. doi: 10.1161/CIR.0000000000000228. [DOI] [PubMed] [Google Scholar]
- [10].Gebreab SY, Davis SK, Symanzik J, Mensah GA, Gibbons GH, Diez-Roux AV. Geographic variations in cardiovascular health in the United States: Contributions of state- and individual-level factors. J Am Heart Assoc 2015;4(6):e001673. doi: 10.1161/JAHA.114.001673. [DOI] [PMC free article] [PubMed] [Google Scholar]
- [11].Brown AF, Liang LJ, Vassar SD, Escarce JJ, Merkin SS, Cheng E, et al. Trends in racial/ethnic and nativity disparities in cardiovascular health among adults without prevalent cardiovascular disease in the United States, 1988 to 2014. Ann Intern Med 2018;168(8):541–9. doi: 10.7326/M17-0996. [DOI] [PMC free article] [PubMed] [Google Scholar]
- [12].Miranda JJ, Barrientos-Gutierrez T, Corvalan C, Hyder AA, Lazo-Porras M, Oni T, et al. Understanding the rise of cardiometabolic diseases in low- and middle-income countries. Nat Med 2019;25(11):1667–79. doi: 10.1038/s41591-019-0644-7. [DOI] [PubMed] [Google Scholar]
- [13].Roth GA, Mensah GA, Johnson CO, Addolorato G, Ammirati E, Baddour LM, et al. Global burden of cardiovascular diseases and risk factors, 1990–2019: Update from the GBD 2019 Study. J Am Coll Cardiol 2020;76(25):2982–3021. doi: 10.1016/j.jacc.2020.11.010. [DOI] [PMC free article] [PubMed] [Google Scholar]
- [14].Angell SY, McConnell MV, Anderson CAM, Bibbins-Domingo K, Boyle DS, Capewell S, et al. The American Heart Association 2030 impact goal: A presidential advisory from the American heart association. Circulation 2020;141(9):e120–38. doi: 10.1161/CIR.0000000000000758. [DOI] [PMC free article] [PubMed] [Google Scholar]
- [15].Rahman M, Fukui T. Biomedical publication: Global profile and trend. Public Health 2003;117(4):274–80. doi: 10.1016/S0033-3506(03)00068-4. [DOI] [PubMed] [Google Scholar]
- [16].Yusuf S, Reddy S, Ôunpuu S, Anand S. Global burden of cardiovascular diseases: General considerations, the epidemiologic transition, risk factors, and impact of urbanization. Circulation 2001;104(22):2746–53. doi: 10.1161/hc4601.099487. [DOI] [PubMed] [Google Scholar]
- [17].Institute of Medicine Promoting cardiovascular health in the developing world: A critical challenge to achieve global health. Washington, DC: The National Academies Press; 2010. [PubMed] [Google Scholar]
- [18].Seron P, Irazola V, Rubinstein A, Calandrelli M, Ponzo J, Olivera H, et al. Ideal cardiovascular health in the southern cone of Latin America. Public Health 2018;156:132–9. doi: 10.1016/j.puhe.2017.12.017. [DOI] [PMC free article] [PubMed] [Google Scholar]
- [19].McKenzie JA, Younger NO, Tulloch-Reid MK, Govia I, Bennett NR, McFarlane S, et al. Ideal cardiovascular health in urban Jamaica: prevalence estimates and relationship to community property value, household assets and educational attainment. BMJ Open 2020;10(12):e040664. doi: 10.1136/bmjopen-2020-040664. [DOI] [PMC free article] [PubMed] [Google Scholar]
- [20].Gupta B, Gupta R, Sharma KK, Gupta A, Mahanta TG, Deedwania PC. Low prevalence of AHA-defined ideal cardiovascular health factors: A study of urban indian men and women. Glob Heart 2017;12(3):219–25. doi: 10.1016/j.gheart.2014.09.004. [DOI] [PubMed] [Google Scholar]
- [21].Ghimire U, Shrestha N, Gyawali B, Pradhan PMS, Mishra SR. Prevalence of American heart association defined ideal cardiovascular health metrics in Nepal: Findings from a nationally representative cross-sectional study. Int Health 2020;12(4):325–31. doi: 10.1093/inthealth/ihz088. [DOI] [PMC free article] [PubMed] [Google Scholar]
- [22].Ketelaar EJ, Vos AG, Godijk NG, Scheuermaier K, Devillé W, Tempelman H, et al. Ideal cardiovascular health index and its determinants in a rural South African population. Glob Heart 2020;15(1):76. doi: 10.5334/gh.801. [DOI] [PMC free article] [PubMed] [Google Scholar]
- [23].Huffman MD. Cardiovascular health in low- and middle-income countries. Curr Probl Cardiol 2014;39(11):399–419. doi: 10.1016/j.cpcardiol.2014.05.005. [DOI] [PubMed] [Google Scholar]
- [24].Schultz WM, Kelli HM, Lisko JC, Varghese T, Shen J, Sandesara P, et al. Socioeconomic status and cardiovascular outcomes: Challenges and interventions. Circulation 2018;137(20):2166–78. doi: 10.1161/CIRCULATIONAHA.117.029652. [DOI] [PMC free article] [PubMed] [Google Scholar]
- [25].Rosengren A, Smyth A, Rangarajan S, Ramasundarahettige C, Bangdiwala SI, Al-Habib KF, et al. Socioeconomic status and risk of cardiovascular disease in 20 low-income, middle-income, and high-income countries: The Prospective Urban Rural Epidemiologic (PURE) Study. Lancet Global Health 2019;7(6):e748–60. doi: 10.1016/S2214-109X(19)30045-2. [DOI] [PubMed] [Google Scholar]
- [26].O’Neil A, Scovelle AJ, Milner AJ, Kavanagh A. Gender/sex as a social determinant of cardiovascular risk. Circulation 2018;137(8):854–64. doi: 10.1161/CIRCULATIONAHA.117.028595. [DOI] [PubMed] [Google Scholar]
- [27].Rodgers JL, Jones J, Bolleddu SI, Vanthenapalli S, Rodgers LE, Shah K, et al. Cardiovascular risks associated with gender and aging. J Cardiovasc Dev Dis 2019;6(2). doi: 10.3390/jcdd6020019. [DOI] [PMC free article] [PubMed] [Google Scholar]
- [28].Moher D, Shamseer L, Clarke M, Ghersi D, Liberati A, Petticrew M, et al. Preferred reporting items for systematic review and meta-analysis protocols (PRISMA-P) 2015 statement. Syst Rev 2015;4:1. doi: 10.1186/2046-4053-4-1. [DOI] [PMC free article] [PubMed] [Google Scholar]
- [29].Institute of Medicine Finding what works in health care: Standards for systematic reviews. Washington, DC: The National Academies Press; 2011. [PubMed] [Google Scholar]
- [30].Wells GA, Shea B, O’Connell D, et al. The Newcastle-Ottawa Scale (NOS) for assessing the quality of nonrandomised studies in meta-analysis, http://www.ohri.ca/programs/clinical_epidemiology/oxford.asp; 2004. [accessed 01.11.19].
- [31].The World Bank. World Bank Country and Lending Groups, https://datahelpdesk.worldbank.org/knowledgebase/articles/906519-world-bank-country-and-lending-groups; 2021. [accessed 01.09.21].
- [32].Boylan JM, Robert SA. Neighborhood SES is particularly important to the cardiovascular health of low SES individuals. Soc Sci Med 2017;188:60–8. doi: 10.1016/j.socscimed.2017.07.005. [DOI] [PMC free article] [PubMed] [Google Scholar]
- [33].Le-Scherban F, Albrecht SS, Bertoni A, Kandula N, Mehta N, Diez Roux AV. Immigrant status and cardiovascular risk over time: Results from the multi-ethnic study of Atherosclerosis. Ann Epidemiol 2016;26(6):429–35. doi: 10.1016/j.annepidem.2016.04.008. [DOI] [PMC free article] [PubMed] [Google Scholar]
- [34].Lassale C, Cené CW, Asselin A, Sims M, Jouven X, Gaye B. Sociodemographic determinants of change in cardiovascular health in middle adulthood in a biracial cohort. Atherosclerosis 2022;346:98–108. doi: 10.1016/j.atherosclerosis.2022.01.006. [DOI] [PubMed] [Google Scholar]
- [35].De Moraes ACF, Carvalho HB, McClelland RL, Diez-Roux AV, Szklo M. Sex and ethnicity modify the associations between individual and contextual socioeconomic indicators and ideal cardiovascular health: MESA study. J Public Health 2019;41(3):e237–44. doi: 10.1093/pubmed/fdy145. [DOI] [PubMed] [Google Scholar]
- [36].Thomas SC, Umer A, Commodore-Mensah Y, Davidov D, Abildso CG. Length of residence and cardiovascular health among Afro-Caribbean immigrants in New York City. J Racial Ethn Health Disparities 2019;6(3):487–96. doi: 10.1007/s40615-018-00547-8. [DOI] [PMC free article] [PubMed] [Google Scholar]
- [37].Lawrence EM, Hummer RA, Domingue BW, Harris KM. Wide educational disparities in young adult cardiovascular health. SSM-Popul Health 2018;5:249–56. doi: 10.1016/j.ssmph.2018.07.006. [DOI] [PMC free article] [PubMed] [Google Scholar]
- [38].Matthews KA, Boylan JM, Jakubowski KP, Cundiff JM, Lee L, Pardini DA, et al. Socioeconomic status and parenting during adolescence in relation to ideal cardiovascular health in Black and White men. Health Psychol 2017;36(7):673–81. doi: 10.1037/hea0000491. [DOI] [PMC free article] [PubMed] [Google Scholar]
- [39].Benderly M, Chetrit A, Murad H, Abu-Saad K, Gillon-Keren M, Rogowski O, et al. Cardiovascular health among two ethnic groups living in the same region: A population-based study. Int J Cardiol 2017;228:23–30. doi: 10.1016/j.ijcard.2016.11.079. [DOI] [PubMed] [Google Scholar]
- [40].Burroughs Pena MS, Mbassa RS, Slopen NB, Williams DR, Buring JE, Albert MA. Cumulative psychosocial stress and ideal cardiovascular health in older women. Circulation 2019;139(17):2012–21. doi: 10.1161/CIRCULATIONAHA.118.033915. [DOI] [PMC free article] [PubMed] [Google Scholar]
- [41].Ogunmoroti O, Utuama OA, Michos ED, Valero-Elizondo J, Okunrintemi V, Taleb ZB, et al. Does education modify the effect of ethnicity in the expression of ideal cardiovascular health? The Baptist Health South Florida Employee Study. Clin Cardiol 2017;40(11):1000–7. doi: 10.1002/clc.22757. [DOI] [PMC free article] [PubMed] [Google Scholar]
- [42].Yang Q, Yuan K, Gregg EW, Loustalot F, Fang J, Hong Y, et al. Trends and clustering of cardiovascular health metrics among U.S. adolescents 1988–2010. J Adolesc Health 2014;55(4):513–20. doi: 10.1016/j.jadohealth.2014.03.013. [DOI] [PMC free article] [PubMed] [Google Scholar]
- [43].Nriagu BN, Ako AA, Wang C, De Roos AJ, Wallace R, Allison MA, et al. Occupations associated with poor cardiovascular health in women: The Women’s Health Initiative observational study. J Occup Environ Med 2021. doi: 10.1097/JOM.00000000000021. [DOI] [PubMed] [Google Scholar]
- [44].Shockey TM, Sussell AL, Odom EC. Cardiovascular health status by occupational group: 21 States, 2013. MMWR Morb Mortal Wkly Rep 2016;65(31):793–8. doi: 10.15585/mmwr.mm6531a1. [DOI] [PubMed] [Google Scholar]
- [45].Estrella ML, Rosenberg NI, Durazo-Arvizu RA, Gonzalez HM, Loop MS, Singer RH, et al. The association of employment status with ideal cardiovascular health factors and behaviors among Hispanic/Latino adults: Findings from the Hispanic Community Health Study/Study of Latinos (HCHS/SOL). PLoS ONE 2018;13(11):e0207652. doi: 10.1371/journal.pone.0207652. [DOI] [PMC free article] [PubMed] [Google Scholar]
- [46].Savelieva K, Pulkki-Raback L, Jokela M, Kubzansky LD, Elovainio M, Mikkilä V, et al. Intergenerational transmission of socioeconomic position and ideal cardiovascular health: 32-year follow-up study. Health Psychol 2017;36(3):270–9. doi: 10.1037/hea0000441. [DOI] [PubMed] [Google Scholar]
- [47].Jankovic J, Eric M, Stojisavljevic D, Marinkovic J, Jankovic S. Socio-economic differences in cardiovascular health: Findings from a cross-sectional study in a middle-income country. PLoS ONE 2015;10(10):e0141731. doi: 10.1371/journal.pone.0141731. [DOI] [PMC free article] [PubMed] [Google Scholar]
- [48].Machado LBM, Silva BLS, Garcia AP, Oliveira RA, Barreto SM, Maria de Jesus MF, et al. Ideal cardiovascular health score at the ELSA-Brasil baseline and its association with sociodemographic characteristics. Int J Cardiol 2018;254:333–7. doi: 10.1016/j.ijcard.2017.12.03748. [DOI] [PubMed] [Google Scholar]
- [49].Bi Y, Jiang Y, He J, Xu Y, Wang L, Xu M, et al. Status of cardiovascular health in Chinese adults. J Am Coll Cardiol 2015;65(10):1013–25. [DOI] [PubMed] [Google Scholar]
- [50].Dong H, Yan Y, Liu J, Zhao X, Cheng H, Hou D, et al. Alarming trends in ideal cardiovascular health among children and adolescents in Beijing, China, 2004 to 2014. Int J Cardiol 2017;231:264–70. doi: 10.1016/j.ijcard.2016.12.027. [DOI] [PubMed] [Google Scholar]
- [51].Zhao Y, Yan H, Yang R, Li Q, Dang S, Liu R, et al. Status of cardiovascular health among adults in a rural area of Northwest China: Results from a cross-sectional study. Medicine (Baltimore) 2016;95(28):e4245. doi: 10.1097/MD.0000000000004245. [DOI] [PMC free article] [PubMed] [Google Scholar]
- [52].Jankovic J, Davidovic M, Bjegovic-Mikanovic V, Jankovic S. Status of cardiovascular health in the Republic of Serbia: Results from the National Health Survey. PLoS ONE 2019;14(3):e0214505. doi: 10.1371/journal.pone.0214505. [DOI] [PMC free article] [PubMed] [Google Scholar]
- [53].Benziger CP, Zavala-Loayza JA, Bernabe-Ortiz A, Gilman RH, Checkley W, Smeeth L, et al. Low prevalence of ideal cardiovascular health in Peru. Heart 2018;104(15):251–1256. doi: 10.1136/heartjnl-2017-312255. [DOI] [PMC free article] [PubMed] [Google Scholar]
- [54].Pengpid S, Peltzer K. Ideal cardiovascular health in a nationally representative population-based sample of adults in Malawi. Glob Heart 2021;16(1):24. doi: 10.5334/gh.986. [DOI] [PMC free article] [PubMed] [Google Scholar]
- [55].Pengpid S, Peltzer K. National trends in ideal cardiovascular health among adults in Bhutan from three cross-sectional surveys in 2007, 2014, and 2019. Sci Rep 2022;12(1):5660. doi: 10.1038/s41598-022-09688-7. [DOI] [PMC free article] [PubMed] [Google Scholar]
- [56].Ren J, Guo XL, Lu ZL, Zhang JY, Tang JL, Chen X, et al. Ideal cardiovascular health status and its association with socioeconomic factors in Chinese adults in Shandong, China. BMC Public Health 2016;16:942. doi: 10.1186/s12889-016-3632-6. [DOI] [PMC free article] [PubMed] [Google Scholar]
- [57].Oliveira RS, Schneider BC, Callo-Quinte G, Oliveira IO, Gonçalves H, Wehrmeister FC, et al. Prevalence of ideal cardiovascular health in young adults: A birth cohort from southern Brazil. Am Heart J 2021;235:65–73. doi: 10.1016/j.ahj.2021.01.014. [DOI] [PubMed] [Google Scholar]
- [58].Link BG, Phelan J. Social conditions as fundamental causes of disease. J Health Soc Behav 1995;Extra Issue:80–94. [PubMed] [Google Scholar]
- [59].Braveman P, Gottlieb L. The social determinants of health: It’s time to consider the causes of the causes. Public Health Rep 2014;129(S2):19–31. doi: 10.1177/00333549141291S206. [DOI] [PMC free article] [PubMed] [Google Scholar]
- [60].Berkman LF, Kawachi I, Glymour MM. Social epidemiology editors. New York, NY: Oxford University Press; 2014. [Google Scholar]
- [61].Churchwell K, Elkind MS, Benjamin RM, Carson AP, Chang EK, Lawrence W, et al. Structural racism as a fundamental driver of health disparities: A presidential advisory from the American Heart Association. Circulation 2020;142(24):e454–68. doi: 10.1161/CIR.0000000000000936. [DOI] [PubMed] [Google Scholar]
- [62].Gee GC, Payne-Sturges DC. Environmental health disparities: A framework integrating psychosocial and environmental concepts. Environ Health Perspect 2004;112(17):1645–53. doi: 10.1289/ehp.7074. [DOI] [PMC free article] [PubMed] [Google Scholar]
- [63].Lewis TT, Williams DR, Tamene M, Clark CR. Self-reported experiences of discrimination and cardiovascular disease. Curr Cardiovasc Risk Rep 2014;8(1):365. doi: 10.1007/s12170-013-0365-2. [DOI] [PMC free article] [PubMed] [Google Scholar]
- [64].Steptoe A, Kivimäki M. Stress and cardiovascular disease. Nat Rev Cardiol 2012;9(6):360–70. doi: 10.1038/nrcardio.2012.45. [DOI] [PubMed] [Google Scholar]
- [65].Braveman PA, Kumanyika S, Fielding J, LaVeist T, Borrell LN, Manderscheid R, et al. Health disparities and health equity: The issue is justice. Am J Public Health 2011;101(S1):S149–55. doi: 10.2105/AJPH.2010.300062. [DOI] [PMC free article] [PubMed] [Google Scholar]
- [66].Prins SJ, McKetta S, Platt J, Muntaner C, Keyes KM, Bates LM. Mental illness, drinking, and the social division and structure of labor in the United States: 2003–2015. Am J Ind Med 2019;62(2):131–44. doi: 10.1002/ajim.22935. [DOI] [PMC free article] [PubMed] [Google Scholar]
- [67].Prins SJ, Bates LM, Keyes KM, Muntaner C. Anxious? Depressed? You might be suffering from capitalism: Contradictory class locations and the prevalence of depression and anxiety in the USA. Sociol Health Illn 2015;37(8):1352–72. doi: 10.1111/1467-9566.12315. [DOI] [PMC free article] [PubMed] [Google Scholar]
- [68].Prins SJ, McKetta S, Platt J, Muntaner C, Keyes KM, Bates LM. The serpent of their agonies: Exploitation as structural determinant of mental illness. Epidemiol 2020;32(2):303–9. doi: 10.1097/EDE.0000000000001304. [DOI] [PMC free article] [PubMed] [Google Scholar]
- [69].Williams DR. Race and health: Basic questions, emerging directions. Annals of Epidemiol 1997;7(5):322–33. doi: 10.1016/s1047-2797(97)00051-3. [DOI] [PubMed] [Google Scholar]
- [70].Williams DR, Priest N, Anderson NB. Understanding associations among race, socioeconomic status, and health: Patterns and prospects. Health Psychol 2016;35(4):407. doi: 10.1037/hea0000242. [DOI] [PMC free article] [PubMed] [Google Scholar]
- [71].Ford R, Jennings W. The changing cleavage politics of Western Europe. Annu Rev Political Sci 2020;23:295–314. [Google Scholar]
- [72].Beckfield J. Unequal Europe: Regional integration and the rise of european inequality. New York, NY: Oxford University Press; 2019. [Google Scholar]
- [73].Henriksson P, Henriksson H, Labayen I, Huybrechts I, Gracia-Marco M, Ortega FB, et al. Correlates of ideal cardiovascular health in European adolescents: The HELENA study. Nutr Metab Cardiovasc Dis 2018;28(2):187–94. doi: 10.1016/j.numecd.2017.10.018. [DOI] [PubMed] [Google Scholar]
- [74].Steinberger J, Daniels SR, Hagberg N, Isasi CR CR, Kelly AS, Lloyd-Jones D, et al. Cardiovascular health promotion in children: Challenges and opportunities for 2020 and beyond. Circulation 2016;134(12):e236–55. doi: 10.1161/CIR.0000000000000441. [DOI] [PMC free article] [PubMed] [Google Scholar]
- [75].Shay CM, Ning H, Daniels SR, Rooks CR, Gidding SS, Lloyd-Jones DM. Status of cardiovascular health in US adolescents: prevalence estimates from the National Health and Nutrition Examination Surveys (NHANES) 2005–2010. Circulation 2013;127(13):1369–76. doi: 10.1161/CIRCULATIONAHA.113.001559. [DOI] [PubMed] [Google Scholar]
- [76].Labarthe DR. From cardiovascular disease to cardiovascular health: A quiet revolution? Circ Cardiovasc Qual Outcomes 2012;5(6):e86–92. doi: 10.1161/CIRCOUTCOMES.111.964726. [DOI] [PubMed] [Google Scholar]
- [77].Shay CM, Gooding HS, Murillo R, Foraker R. Understanding and improving cardiovascular health: An update on the American heart association’s concept of cardiovascular health. Prog Cardiovasc Dis 2015;58(1):41–9. doi: 10.1016/j.pcad.2015.05.003. [DOI] [PubMed] [Google Scholar]
- [78].Bambs C, Kip KE, Dinga A, Mulukutla SR, Aiyer AN, Reis SE. Low prevalence of ideal cardiovascular health in a community-based population: The Heart Strategies Concentrating on Risk Evaluation (Heart SCORE) study. Circulation 2011;123(8):850–7. doi: 10.1161/CIRCULATIONAHA.110.980151. [DOI] [PMC free article] [PubMed] [Google Scholar]
- [79].Empana JP, Perier MC, Singh-Manoux A, Gaye B, Thomas F, Prugger C, et al. Cross-sectional analysis of deprivation and ideal cardiovascular health in the Paris Prospective Study 3. Heart 2016;102(23):1890–7. doi: 10.1136/heartjnl-2016-309502. [DOI] [PubMed] [Google Scholar]
- [80].Wasserstein RL, Schirm AL, Lazar NA. Moving to a world beyond “p< 0.05″. Amer Statistician 2019;73(S1):1–9. doi: 10.1080/00031305.2019.1583913. [DOI] [Google Scholar]
- [81].Alam MT, Echeverria SE, DuPont-Reyes MJ, Vasquez E, Murillo R, Gonzalez T, et al. Educational attainment and prevalence of cardiovascular health (Life’s Simple 7) in Asian Americans. Int J Environ Res Public Health 2021;18(4):1480. doi: 10.3390/ijerph18041480. [DOI] [PMC free article] [PubMed] [Google Scholar]
- [82].Egan BM, Li J, Sutherland SE, Jones DW, Ferdinand KC, Hong Y, et al. Sociodemographic determinants of Life’s Simple 7: Implications for achieving cardiovascular health and health equity goals. Ethn Dis 2020;30(4):637–50. doi: 10.18865/ed.30.4.637. [DOI] [PMC free article] [PubMed] [Google Scholar]
- [83].Foraker RE, Bush C, Greiner MA, Sims M, Henderson K, Smith S, et al. Distribution of cardiovascular health by individual- and neighborhood-level socioeconomic status: Findings from the Jackson Heart Study. Glob Heart 2019;14(3):241–50. doi: 10.1016/j.gheart.2019.04.00784. [DOI] [PubMed] [Google Scholar]
- [84].Graciani A, Leon-Munoz LM, Guallar-Castillon P, Rodriguez-Artalejo F, Bane-gas JR. Cardiovascular health in a southern Mediterranean European country: A nationwide population-based study. Circ Cardiovasc Qual Outcomes 2013;6(1):90–8. doi: 10.1161/CIRCOUTCOMES.112.967893. [DOI] [PubMed] [Google Scholar]
- [85].Harrison S, Couillard C, Robitaille J, Vohl MC, Bélanger M, Desroches S, et al. Assessment of the American Heart Association’s Life’s Simple 7 score in French-speaking adults from Quebec. Nutr Metab Cardiovasc Dis 2019;29(7):684–91. doi: 10.1016/j.numecd.2019.03.006. [DOI] [PubMed] [Google Scholar]
- [86].Cabeza de Baca T, Burroughs Pena MS, Slopen N, Williams D, Buring J, Albert MA. Financial strain and ideal cardiovascular health in middle-aged and older women: data from the women’s health study. Am Heart J 2019;215:129–38. doi: 10.1016/j.ahj.2019.06.002. [DOI] [PMC free article] [PubMed] [Google Scholar]
- [87].Lee C, Park S, Boylan JM. Cardiovascular health at the intersection of race and gender: identifying life-course processes to reduce health disparities. J Gerontol B Psychol Sci Soc Sci 2021;76(6):1127–39. doi: 10.1093/geronb/gbaa208. [DOI] [PMC free article] [PubMed] [Google Scholar]
- [88].Mujahid MS, Moore LV, Petito LC, Kershaw KN, Watson LK, Diez Roux AV. Neighborhoods and racial/ethnic differences in ideal cardiovascular health (the Multi-ethnic study of Atherosclerosis). Health Place 2017;44:61–9. doi: 10.1016/j.healthplace.2017.01.005. [DOI] [PMC free article] [PubMed] [Google Scholar]
Associated Data
This section collects any data citations, data availability statements, or supplementary materials included in this article.