

Abstract
Pathological blood clotting, or thrombosis, limits vital blood flow to organs; such deprivation can lead to catastrophic events including myocardial infarction, pulmonary embolism, and ischemic stroke. Prompt restoration of blood flow greatly improves outcomes. We explored whether aptamers could serve as molecular imaging probes to rapidly detect thrombi. An aptamer targeting thrombin, Tog25t, was found to rapidly localize to and visualize pre-existing clots in the femoral and jugular veins of mice using fluorescence imaging and, when circulating, was able to image clots as they form. Since free aptamer is quickly cleared from circulation, contrast is rapidly developed, allowing clot visualization within minutes. Moreover, administration of an antidote oligonucleotide further enhanced contrast development, causing the unbound aptamer to clear within 5min while impacting the clot-bound aptamer more slowly. These findings suggest that aptamers can serve as imaging agents for rapid detection of thrombi in acute care and perioperative settings.
Keywords: MT: Oligonucleotides: Diagnostics and Biosensors, aptamers, RNA, imaging, thrombosis, clot imaging
Graphical abstract
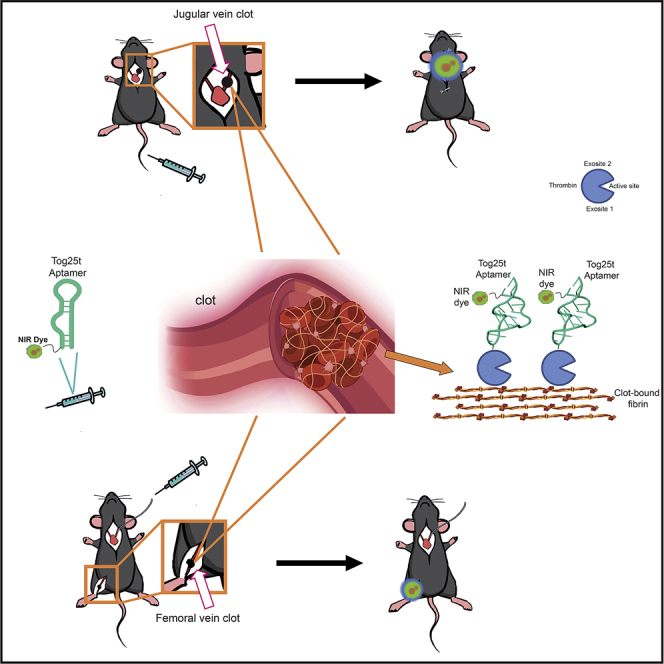
Blood clotting limits vital blood flow to organs, often leading to catastrophic events. To explore whether aptamers could serve as molecular imaging probes to rapidly detect clots, the thrombin aptamer Tog25t was used to rapidly visualize both pre-existing clots and forming clots. Moreover, an antidote oligonucleotide enhanced aptamer-based clot detection.
Introduction
Vascular thrombosis, formation of a pathological blood clot, is a major underlying factor in cardiovascular and neurovascular disorders and a common event among patients with cancer (reviewed in Raskob et al.1). More recently, thrombotic events have been frequently observed in patients with COVID-19.2 Thus, thrombi currently contribute to the mortality and morbidity associated with four of the top five leading causes of death in the United States.3 Additionally, thrombi are a major post-surgical complication.
Existing methods for thrombi detection, including magnetic resonance imaging (MRI), computed tomography (CT) angiography, and ultrasound, primarily function by visualizing absent blood flow or stenosis, assumed to result from thrombus presence, rather than by directly imaging the clot. Thus, current imaging methods cannot distinguish whether the restricted blood flow is due to ongoing thrombosis or rather the result of other forms of stenosis. These methods also have limited sensitivity and cannot ascertain thrombi molecular/cellular features, severely limiting the application of precision medicine to treat thrombotic events. Thus, a major unmet medical need exists to develop precise methods that can rapidly detect and characterize thrombi. In particular, prompt identification of thrombi would dramatically improve outcomes for patients since the responsiveness of thrombi to treatment and the survival of surrounding tissues decrease with thrombus age and prolonged occlusion.
A highly promising, alternative approach is to detect thrombotic events by molecular imaging, where the molecular clot component is directly recognized and imaged (reviewed in Wang and Peter4). This approach allows for direct imaging of the clot itself instead of relying on the absence of blood flow to identify a clot. Such molecular thrombi imaging requires an imaging probe able to circulate within the blood and penetrate the clot, ideally with a short circulating half-life that allows for rapid clearance of unbound probe. RNA and DNA aptamers bind to targets with high affinity and specificity (reviewed in Conrad et al.,5 Osborne and Ellington,6 and Nimjee et al.7) and, as small ligands with short circulation times, have desirable pharmacokinetic properties for imaging. Although similar to antibodies in terms of their affinity for their targets, aptamers are amenable to chemical synthesis and modification and thus easily tailored to the application at hand. Uniquely, aptamer function can be rapidly controlled using short complementary oligonucleotide “antidotes” that anneal to the aptamer and disrupt its structure.8,9 Notably, such antidotes have been shown to effectively turn off aptamer targeting and function in humans within minutes.7,10,11 Finally, aptamers have proven to be nontoxic and nonimmunogenic.12,13,14,15
During blood clot formation, the coagulation factor prothrombin is cleaved to generate the serine protease thrombin, which plays a central role in thrombogenesis and remains associated with the formed thrombus. Thus, while prothrombin is constantly in circulation, thrombin is only generated once clotting is initiated and is not otherwise present, making thrombin detection specific to the presence of a thrombus. Thrombin localizes to blood clots by binding via its exosite-1 to fibrin strands in the clots (Figure S1).16 We previously isolated a 2′fluoro (2′F) pyrimidine-modified RNA aptamer, termed Tog25t, that has high affinity for human and porcine thrombin yet is not a particularly potent anticoagulant.17 Subsequent X-ray crystal structures of Tog25t bound to thrombin revealed that while the aptamer forms an extended contact with over 1,000 square Å on exosite-2 of thrombin, it does not alter either the thrombin active site or exosite-1,18 suggesting that Tog25t should still target and access clot-bound thrombin (Figure S1). Additionally, Tog25t is expected to have affinity only for clot-bound thrombin, as once thrombin dissociates from blood clots, it is quickly inactivated by binding to the protein antithrombin, and Tog25t does not bind the thrombin-antithrombin complex.19
Thus, we sought to use the Tog25t aptamer as a thrombus-specific imaging probe to develop an efficient method of active clot detection and ongoing localized thrombin generation. Additionally, we aimed to exploit the rapid antidote reversal of aptamers to develop a class of reversible, titratable imaging agents that can be tailored for faster imaging. To develop and optimize this method, we utilized near-infrared (NIR) fluorescent imaging by conjugating Tog25t to an NIR dye. In murine thrombosis models, Tog25t can rapidly bind and detect existing clots in mice. Subsequent antidote treatment sped up the detection of thrombi by removing Tog25t from circulation and allowing for distinct, clear imaging of blood-clot-bound Tog25t. Moreover, Tog25t’s rapid on rate also allows for detection of newly forming clots in vivo. Our results demonstrate that thrombin is a suitable target for imaging newly formed clots and that aptamer-antidote pairs serve as rapid binding-rapid reversal imaging probes that may prove useful in a variety of clinical settings.
Results
Dye-conjugated Tog25t targets human, mouse, and rhesus thrombin
Due to the high-affinity interactions between Tog25t and thrombin exosite 2, we explored aptamer targeting to active clots, as exosite 2 should remain accessible when thrombin is clot bound (Figure S1). While Tog25t was selected against both human and porcine thrombin,17 the ability to bind mouse thrombin would allow for small-animal pre-clinical imaging studies. To determine if Tog25t binds mouse thrombin, we compared the binding of 5′ P32-labeled Tog25t to both human and mouse thrombin via a double-filter nitrocellulose and nylon filter-binding assay. As shown in Figure 1A, Tog25t does cross-react with mouse thrombin, although with reduced affinity compared with human thrombin (Kd = 36.7 ± 4.02 vs. 1.25 ± 0.13, respectively). Additionally, Tog25t maintained a similar Bmax for both human and mouse thrombin (0.61 ± 0.0071 vs. 0.65 ± 0.016, respectively).
Figure 1.

The Tog25t aptamer targets human, mouse, and rhesus thrombin as evidenced by direct binding and anticoagulant activity
(A) Double-filter nitrocellulose and nylon filter binding of P32-labeled Tog25t to human or mouse thrombin. N = 3. (B) Secondary structure of Tog25t. The blue circle represents the dye AF680 that is conjugated to the 5′ end of the aptamer. The nucleotide changes used to generate the Tog25t control 1 and control 2 are shown in red and blue, respectively. (C–E) aPTT coagulation assays examining the anticoagulant activity of 1 μM Tog25t or AF680-Tog25t in (C) human plasma, (D) mouse plasma, and (E) rhesus plasma. Shown is the increase in clotting time (clot time extension) over the average baseline clotting time for the plasma. n = 6–18. ∗∗p = 0.0011 and ∗∗∗p ≤ 0.00015 compared with AF680-Tog25t. ∗∗∗∗p ≤ 0.00001 compared with Tog25t.
Tog25t was previously shown to modestly inhibit plasma clot formation by targeting human thrombin.17 Therefore, Tog25t activity can be verified ex vivo using an activated partial thromboplastin time (aPTT) clinical coagulation assay, which measures the time to fibrin clot formation after plasma activation. To develop Tog25t into a pre-clinical imaging agent, we conjugated the aptamer to an NHS-ester Alexa Fluor 680 (AF680) NIR dye (Figure 1B). As expected, AF680-Tog25t functioned the same as unlabeled Tog25t, extending clot time ∼35 s over baseline in human plasma (Figure 1C). Two different point mutants of Tog25t, control 1 (“no stem 1”) and control 2 (“no stem 2”) (Figure 1B), which do not bind thrombin,17 were used as controls for Tog25t specificity. Neither unlabeled nor AF680-labeled controls altered aPTT clotting time in human plasma (Figure 1C).
To confirm that AF680-Tog25t retains affinity for murine thrombin, we examined the effect on aPTT clotting assay time over baseline in mouse plasma. AF680-Tog25t extended clotting ∼30 s in murine plasma, similar to its activity in human plasma, while neither control mutant altered clotting over baseline (Figure 1D). Importantly, AF680-Tog25t also had a half-life in mouse serum of ∼6 h (Figure S2), sufficiently long for clot imaging. As expected, Tog25t also recognizes rhesus thrombin, with AF680-Tog25t extending clotting time ∼15 s over baseline in rhesus plasma (Figure 1E). Thus, Tog25t is amenable to modification for imaging applications and can target thrombin from multiple species, two properties of the aptamer required for preclinical studies.
Intravital microscopy reveals that Tog25t rapidly binds to existing clots in vivo
To determine if AF680-Tog25t can bind thrombin and image pre-existing clots in vivo, murine femoral vein thrombi detection was performed using intravital microscopy. After placement of a jugular catheter, mice were injected with fibrin antibody to visualize the clot. The femoral vein was then exposed and damaged with an electrolytic stimulus to form a discrete thrombus (Figure 2A, steps 1–3). Subsequent imaging of the vessel shows accumulation of the fibrin antibody at the clot site (Figure 2A, step 4; Figure 2B; Videos S1 and S2). Twenty minutes after blood clot formation, AF680-Tog25t or control 2 (2 nmol) was injected via jugular catheter (Figure 2A, step 5), as visualized by the bright AF680 signal seen at 23 min (Figures 2A, step 6, and 2B; Videos S1 and S2). By 10–15 min post-aptamer injection, AF680-Tog25t had bound to the clot (Video S1; Figure 2B), while the AF680-control 2 aptamer did not bind the clot and was largely cleared from the vasculature within 5–10 min (Video S2). AF680-Tog25t remained clot bound for the remainder of the experiment (>60 min), forming a halo-type structure that tapered in the direction of blood flow (Video S1). These images demonstrate that AF680-Tog25t rapidly binds and detects blood clots in vivo and that unbound aptamer is rapidly cleared from the circulation, allowing for rapid contrast development in the vasculature (within 10–15 min).
Figure 2.

Intravital microscopy reveals that Tog25t binds to pre-existing clots in vivo
(A) Procedural overview of the intravital microscopy femoral vein thrombosis imaging model. (1) Mice were injected with fibrin antibody (antifibrin) via a jugular catheter and (2) a femoral vein exposed. (3) An electrolytic stimulus was used to injure the femoral vein to form a discrete subocclusive clot. (4) Intravital imaging was begun, and (5) 20 min after clot initiation, 2 nmol AF680-Tog25t or AF680-control 2 was injected via the jugular catheter. (6) Intravital imaging was continued to visualize aptamer fluorescence. (B) Still images captured during intravital microscopy study, with antifibrin signal shown in green and aptamer signal shown in red. Note that aptamers were injected immediately following the 20 min image. Shown are images from a representative mouse for each treatment. n = 4 mice per treatment.
Representative video from a mouse injected with fibrin antibody (anti-fibrin) via a jugular catheter before exposing a femoral vein. An electrolytic stimulus was used to injure the femoral vein to form a discrete sub-occlusive clot. Intravital imaging was begun, and 20 mins after clot initiation, 2 nmoles of AF680-Tog25t injected via the jugular catheter. The video covers from the time of clot initiation, appearing as green signal due to anti-fibrin staining, to 1 hr after clot initiation. AF680-Tog25t signal appears in red.
Representative video from a mouse injected with fibrin antibody (anti-fibrin) via a jugular catheter before exposing a femoral vein. An electrolytic stimulus was used to injure the femoral vein to form a discrete sub-occlusive clot. Intravital imaging was begun, and 20 mins after clot initiation, 2 nmoles of AF680-Control 2 injected via the jugular catheter. The video covers from the time of clot initiation, appearing as green signal due to anti-fibrin staining, to 1 hr after clot initiation. AF680-Control 2 signal appears in red.
Tog25t detects pre-existing, active blood clots in mice
While intravital microscopy provides direct, temporal visualization of aptamer-based thrombi imaging, many acute care thrombi imaging applications (e.g., ischemic stroke or myocardial infarction) will likely require whole-body imaging to detect pre-existing, active clots. Therefore, we established a murine jugular vein thrombosis model to determine whether AF680-Tog25t can also be used to image preformed blood clots in animals. As shown in the Figure 3A procedural overview, a FeCl3 patch was used to form left jugular vein clots, and a baseline image obtained prior to aptamer injection. AF680-Tog25t or control 2 (2 nmol) were then injected via tail vein, and mice imaged over time for aptamer fluorescence. As expected, prior to aptamer injection, there was no detectable fluorescent signal (Figures 3B and 3C). Immediately after injection of either AF680-Tog25t or control 2, a general fluorescent signal appeared throughout the mouse (<15 min time points), as expected for a fluorescent reagent that just entered circulation. However, in AF680-Tog25t-injected mice, the aptamer localized to the clot, and the signal disappeared from the rest of the animal (Figure 3B). By 15 min post-aptamer administration AF680-Tog25t is localizing to the jugular blood clot. Over the next 1–2 h, background was shown to decrease, and the aptamer clearly visualized the thrombus (95 and 145 min time points). In contrast, the AF680-control 2 aptamer never selectively localizes to the clot, instead disappearing from the animal by ∼30 min after injection and never concentrating in the damaged jugular vein (Figure 3C). Thus, Tog25t can specifically detect and image pre-existing clots in small animals.
Figure 3.

Tog25t detects pre-existing, active clots in whole animals in vivo as visualized via FMT imaging
(A) Procedural overview of the FMT jugular vein thrombosis imaging model. (1) The jugular vein in mice was exposed and (2) a subocclusive clot formed by chemical injury to the vessel using a FeCl3 patch on the vein. (3) Subsequently, the mice were sutured and (4) imaged via FMT. (5) Next, mice were injected via tail vein with 2 nmol of either AF680-Tog25t or AF680-control 2 (6–7) before additional FMT imaging to visualize aptamer fluorescence until fluorescent signal disappeared. (B and C) FMT images from steps 4, 6, and 7 of the procedure for mice injected with (B) AF680-Tog25t or (C) AF680-control 2. Shown are images from a representative mouse for each treatment with jugular vein clots highlighted with white circles. Numbers at the bottom of each mouse image = clot fluorescent signal (counts x pixels/input energy) in oval areas shown over the damaged jugular veins. n = 3–7 mice per treatment.
Circulating Tog25t detects newly forming clots in animals
An unmet medical need also exists to rapidly detect newly forming clots during or following a medical procedure. Therefore, the murine jugular vein thrombosis model was modified to determine whether AF680-Tog25t can image newly forming clots as well when present during a surgical procedure. As shown in the Figure 4A experimental overview, mice were injected via tail vein with either AF680-Tog25t or control 2 (2 nmol). A surgery was then performed, and a new blood clot was induced in the jugular vein. Subsequently, the surgical incision was closed, and the mouse quickly imaged via fluorescence molecular tomography (FMT). As shown in Figure 4B, the circulating aptamer allowed for rapid detection of this newly forming clot in the left jugular vein. Notably, no fluorescent signal in the right jugular vein or in animals injected with AF680-control 2 aptamer was observed.
Figure 4.

Circulating Tog25t detects forming clots in whole animals as visualized via FMT imaging
(A) Procedural overview of the FMT jugular vein thrombosis imaging model. (1) Mice were imaged via FMT before (2) tail vein injection of 2 nmol of either AF680-Tog25t or AF680-control 2. (3) Subsequently, the jugular vein was exposed and (4) a subocclusive clot formed by chemical injury to the vessel using a FeCl3 patch on the vein. (5) Next, the mice were sutured, and (6) FMT imaging continued to visualize aptamer fluorescence. (B and C) FMT images from steps 1 and 6 of the procedure. Shown are images from a representative mouse for each treatment both prior to aptamer injection and at a time point of 80 min after aptamer injection with jugular vein clots highlighted with white circles. Numbers at the bottom of each mouse image = clot fluorescent signal (counts × pixels/input energy) in oval areas shown over damaged jugular veins. n = 4 mice per treatment.
Collectively, these three animal blood clot imaging models demonstrate that AF680-Tog25t can be utilized to detect pre-existing clots generated by different methods (electrolytic injury versus chemical), and newly forming clots can be imaged by intravital microscopy and using whole animal in vivo methods.
Development of a 2′ O-methyl RNA antidote that disrupts Tog25t function
To further explore potentially useful properties of aptamer-based imaging probes, we sought to identify an antidote oligonucleotide capable of annealing to Tog25t and disrupting its ability to bind thrombin. Therefore, we evaluated a series of 10–16 nucleotide long single-stranded DNA antidotes that spanned the length of Tog25t (Figure 5A) for their ability to reverse anticoagulant activity of Tog25t. As expected, none of the antidotes impacted clotting time (Figure 5B). The 3 shortest antidotes, antidotes 1–3 (A1–A3), did not reverse Tog25t activity (Figure 5C). However, the longer antidotes, A4–A6, reversed Tog25t anticoagulation, returning aPTT clotting time to baseline (Figure 5C).
Figure 5.

A 2′ O-methyl RNA antidote disrupts Tog25t function and reverses aptamer binding to a forming clot
(A) Antidote candidate sequences 1–6 (A1–A6). Each antidote is antisense to the portion of the Tog25t sequence that is highlighted in green. (B and C) aPTT coagulation assays examining anticoagulant activity in human plasma of 2 μM candidate antidotes ± 1 μM Tog25t. (B) Actual clotting time for antidote oligonucleotides alone and (C) the increase in clotting time (clot time extension) over the average baseline clotting time for the Tog25t aptamer plus or minus antidote addition. n = 6–48. (D) Predicted secondary structure of Tog25t with the antidote A4 target region on the aptamer identified by yellow circles. A4 is antisense to the identified Tog25t region. The blue circle represents the dye AF680 that is conjugated to the 5′ end of the aptamer. (E) aPTT coagulation assays examining anticoagulant activity in human plasma of 2 μM antidotes ± 1 μM AF680-Tog25t. Shown is the increase in clotting time (clot time extension) over the average baseline clotting time. n = 6–18. (F) Procedural overview of the FMT jugular vein thrombosis imaging model. (1) Mice were imaged via FMT before (2) tail vein injection of 2 nmol of either AF680-Tog25t or AF680-control 2. (3) Subsequently, the jugular vein was exposed and (4) a subocclusive clot formed by chemical injury to the vessel using a FeCl3 patch on the vein. (5) Next, the mice were sutured, and (6) FMT imaging continued to visualize aptamer fluorescence. (7) 10 nmol antidote mA4 was then injected via tail vein, and (8) FMT imaging continued to look for fluorescence. (G) FMT images from steps 1, 6, and 8 of the procedure. Shown are images from a representative mouse with the jugular vein clot highlighted with white ovals. Numbers at the bottom of each mouse image = clot fluorescent signal (counts × pixels/input energy). n = 3 mice per treatment. ∗∗∗p ≤ 0.00002 compared with Tog25t. ∗∗∗∗p < 0.000001 compared with AF680-Tog25t.
To develop an antidote with increased serum stability, we synthesized antidote A4 as a 2′ O-methyl (2′OMe) RNA analog (mA4) (Figure 5D). While the aptamer AF680-Tog25t anticoagulated human plasma ∼35 s over baseline, mA4 reversed this anticoagulation, returning clotting time to baseline (Figure 5E). Importantly, a sequence-scrambled 2′OMe RNA control antidote (scramA4) did not reverse AF680-Tog25t anticoagulation, demonstrating the specificity of the mA4 antidote for Tog25t. Thus, mA4 antidote specifically reverses aptamer AF680-Tog25t’s ability to maintain the RNA structure required to recognize and bind thrombin.
Antidote oligonucleotide administration reverses aptamer binding to a newly forming clot
To determine whether antidote treatment also modifies AF680-Tog25t binding to clots in mice, we employed the whole animal in vivo model to image forming clots before and after antidote injection. As shown for aptamer-alone-treated mice (Figure 4), AF680-Tog25t was injected via tail vein prior to surgery and intraprocedural induction of a left jugular thrombus (Figure 5F). Figure 5G shows that the thrombin aptamer once again localized to the newly forming clot in the jugular vein. After visualizing a clot-bound aptamer, antidote mA4 was injected via tail vein, and mice were imaged again (overview Figure 5F). Immediately after antidote injection (or as rapidly as the animal could be returned to the imager, ∼4 min), the thrombin aptamer signal disappeared from the blood clot (Figure 5G). Thus, remarkably, antidote treatment quickly removes clot-bound Tog25t that had incorporated into new, forming clots.
A Tog25t and antidote combination speeds detection of pre-existing clots
While AF680-Tog25t clearly detects and images preformed clots, it takes 1–2 h for the unbound aptamer to clear from the animal and localize only to the blood clot. Thus, we explored the possibility of using antidote administration to speed AF680-Tog25t detection of pre-existing clots. Similar to aptamer-alone-treated mice, a left jugular clot was induced, and the mice were imaged prior to injection with AF680-Tog25t. After imaging for aptamer fluorescence, antidote mA4 was injected via tail vein at either 25 or 45 min post-aptamer administration, and imaging continued until the fluorescent signal disappeared (overview in Figure 6A). As before, AF680-Tog25t was initially distributed throughout the circulation (Figures 6B and 6C). However, within 5 min of antidote injection, the aptamer signal predominately localized to the clot and was no longer present in the general circulation. Interestingly, initially a strong signal came from the clearance organs (liver/spleen), likely due to clearance of aptamer from the general circulation. For mice injected with antidote at 25 min, AF680-Tog25t was still detectable on the clot until 65 min after antidote injection (Figure 6B), while mice injected with antidote at 45 min cleared the AF680-Tog25t signal by 40 min after antidote injection (Figure 6C). Interestingly, this clearance difference corresponds with the 20 min time difference between the antidote injections. The mice injected with antidote at 25 min required another 20 min to completely clear the AF680-Tog25t signal, while the mice injected with antidote at 45 min cleared the AF680-Tog25t signal much more quickly.
Figure 6.

A Tog25t and antidote combination speeds detection of pre-existing clots as visualized via FMT imaging
(A) Procedural overview of the FMT jugular vein thrombosis imaging model. (1) The jugular vein in mice was exposed and (2) a subocclusive clot formed by chemical injury to the vessel using a FeCl3 patch on the vein. (3) Subsequently, the mice were sutured and (4) imaged via FMT. (5) Next, mice were injected via tail vein with 2 nmol of either AF680-Tog25t or AF680-control 2 (6) before additional FMT imaging to visualize aptamer fluorescence. (7) 10 nmol antidote mA4 was then injected via tail vein at either 25 or 45 min after aptamer injection, and (8) FMT imaging continued to look for fluorescence. (B and C) FMT images from steps 4, 6, and 8 of the procedure. Shown are images from representative mice for each treatment with the jugular vein clot highlighted with white ovals. Numbers at the bottom of each mouse image = clot fluorescent signal (counts × pixels/input energy). n = 3–4 mice per treatment.
As expected based on the other imaging studies, the antidote increased AF680-Tog25t removal from the circulation and the clot but still allowed for distinct, clear imaging of the clot. Thus, compared with the 1–2 h needed to specifically image the clot with AF680-Tog25t alone, it took less than 30 min to image the clot with the AF680-Tog25t and antidote combination, a significant reduction in time to blood clot detection.
Discussion
To enable efficient and specific imaging of thrombi, we developed an aptamer-antidote pair that serves as a rapid binding, rapid clearance-inducing probe and contrast agent. Using the Tog25t aptamer that recognizes thrombin with high affinity, we created an imaging agent for the essential clotting factor thrombin. Thrombin is an ideal target for blood clot imaging given that it is formed during thrombogenesis and remains associated with active clots, becoming inactivated by binding to antithrombin upon dissociation from a clot. As thrombin’s biodistribution is tightly controlled and limited to sites of active clotting, and Tog25t only binds thrombin and not prothrombin or thrombin-antithrombin complexes, thrombin-aptamer complexes will only form on active or newly forming clots.
We examined and optimized Tog25t thrombi imaging by conjugating the aptamer to the NIR dye AF680. Circulating AF680-Tog25t bound to thrombin allows for specific detection of jugular blood clot formation in mice in an antidote-reversible manner, demonstrating that an aptamer-antidote pair can be used to turn on and off clot imaging. Importantly, both whole-animal NIR imaging of jugular clots and intravital microscopy of femoral vein clots in mice demonstrated that AF680-Tog25t targets and images newly forming and preformed clots. Subsequent antidote treatment sped up detection of clots by removing AF680-Tog25t from the circulation and allowed for rapid, distinct imaging of clot-bound AF680-Tog25t. Thus, we developed a reversible, titratable thrombus imaging agent that can be tailored to facilitate faster imaging.
We also established that Tog25t recognizes rhesus thrombin, demonstrating the probable utility of Tog25t thrombin imaging in nonhuman primate models. Additionally, as our intravital microscopy study revealed that Tog25t localizes to and distinguishes clots from background within ∼10–15 min after intravenous (i.v.) injection, the aptamer functions on a time frame that is amenable to large animal pre-clinical imaging. Importantly, in our whole-animal imaging models, the Tog25t antidote began functioning within 5 min of i.v. injection, consistent with previous clinical studies showing that antidotes can effectively turn off and modulate aptamer targeting and function in humans within minutes.7,10,11 Together, these data suggest that Tog25t holds promise for translation into primates including rhesus monkeys and humans.
A few other probes have been developed to image thrombin, including a DNA thrombin aptamer20 cross-linked to microbubbles for ultrasound imaging.21 However, as this aptamer targets thrombin exosite I and competes with fibrinogen for binding,22,23 it is only able to bind thrombin dissociated from the clot and is not able to directly image clot-bound thrombin. Other imaging agents have been developed to image thrombin activity via fluorescence, MRI, and positron emission tomography (PET).24,25,26 However, these probes do not directly bind thrombin and instead rely on protease-cleavable peptides activated by thrombin protease activity. Additionally, once cleaved, they cannot be inactivated. Here, we developed a probe that directly binds thrombin irrespective of thrombin active site function. Additionally, we demonstrate that the Tog25t thrombin probe can both rapidly bind and be reversed and inactivated via antidote treatment, which further accelerates contrast development. Notably, while this study focused on developing Tog25t as a thrombin probe for in vivo imaging, it also has potential for use in assays that analyze thrombin function and interactions, similar to assays such as fluorescence resonance energy transfer (FRET) assays that have been used to monitor thrombin-factor XI interactions.27
The field of aptamer-based imaging is still in an early development stage (reviewed in Dougherty et al.28). Recently a DNA fibrinogen binding aptamer was modified with contrast molecules and used for proof-of-principle in vitro thrombus imaging via CT and MRI as well as ex vivo thrombus imaging via fluoroscopy.29,30 These studies demonstrate the potential to use modified aptamer-based agents for thrombus imaging via CT and MRI. Numerous other imaging modalities are options for imaging with an appropriate contrast/detection agent including ultrasound and PET imaging.31 Due to the ease of synthesis and modification of aptamers, an optimized aptamer can easily be designed for any of these clinically relevant imaging applications. While we focused on NIR imaging for this study, conjugating the Tog25t aptamer to a CT, PET, or MRI probe would be a straightforward path to develop the aptamer into a clinically translatable agent. Moreover, the availability of aptamers to multiple other thrombi-associated clotting factors32,33,34,35,36,37,38,39,40 may prove invaluable for performing molecular clot composition evaluation and to support the development of personalized medicine approaches for treating thrombotic disorders.
As demonstrated here, aptamer imaging activity can be quickly modulated using antidotes specific to the aptamer. This ability to accelerate clot detection and reverse aptamer imaging has the potential to allow for molecular clot imaging on a quick timescale and to reduce the time required to specific clot detection. As time to thrombus detection is crucial in many contexts, such as in the case of patients arriving at the emergency room with ischemic stroke or pulmonary embolism, reducing time to clot detection has significant clinical implications. Further, detecting newly forming clots during or following medical interventions, such as endovascular thrombectomy31 or carotid endarterectomy, may allow for the development of improved approaches to reduce or rapidly address such complications and improve clinical outcomes. Additionally, this rapid binding-rapid reversal imaging method holds promise for use in other imaging contexts, outside of thrombi imaging, to molecularly image other complex pathological processes.
Materials and methods
Aptamer and antidote transcription
Unlabeled Tog25t (GGG AAC AAA GCU GAA GUA CUU ACC C), control 1 (GGG AAC AAA GCU GAA GUA CAA ACC C), and control 2 (GGG AAC AAA GCU GAA GUA CUU AGG G) were generated by in vitro transcription of double-strand DNA templates using 2′F CTP and UTP (TriLink Biotechnologies, San Diego, CA, USA), 2′-hydroxy GTP and ATP (MilliporeSigma, St. Louis, MO, USA), and Y636F mutant T7 RNA polymerase.41
Binding affinity assays
In-vitro-transcribed Tog25t was dephosphorylated by incubation with bacterial alkaline phosphatase (Thermo Fisher Scientific, Waltham, MA, USA) at 65°C for 1 h followed by phenol/chloroform/isoamyl alcohol extraction and ethanol precipitation. Dephosphorylated Tog25t was then radiolabeled using T4 polynucleotide kinase (New England Biolabs, Ipswich, MA, USA) and [γ-32P] ATP (PerkinElmer, Waltham, MA, USA) and excess [γ-32P] ATP removed using a G-25 spin column. Radiolabeling efficiency was determined using a Tri-Carb 2800TR Liquid Scintillation Analyzer (PerkinElmer). Subsequently, apparent binding affinities of Tog25t to human and mouse thrombin (Hematologic Technologies, Essex Junction, VT, USA) were determined via double-filter nitrocellulose and nylon binding assays using trace amounts (10,000 counts per minute [cpm]) of radiolabeled Tog25t incubated with serial dilutions of thrombin protein (ranging from 0–5 μM). 32P-labeled Tog25t was denatured and folded in binding solution (20 mM HEPES [pH 7.4] + 150 mM NaCl + 2 mM CaCl2 + 0.01% BSA) by incubating at 65°C for 5 min followed by cooling at room temperature (RT) for 2 min. Next, both 32P-labeled Tog25t and thrombin protein dilutions in binding solution were separately incubated at 37°C for 5 min before mixing together and incubating for another 5 min at 37°C. 32P-Tog25t bound to thrombin protein was then partitioned from unbound 32P-Tog25t by passing the mixture through a 0.45 μm nitrocellulose filter (VWR, Radnor, PA, USA), capturing the unbound 32P-Tog25t on a nylon membrane (PerkinElmer) and washing with wash buffer (binding buffer without BSA). Thrombin-bound and unbound 32P-Tog25t were quantitated using a Storm 825 phosphorimager (GE Healthcare, Chicago, IL, USA). The corrected fraction bound was determined for each protein concentration after correcting for nonspecific background binding of 32P-Tog25t to the nitrocellulose filter as described42 and a nonlinear regression one site binding fit applied in GraphPad Prism 9 to determine apparent Kd.
Aptamer and antidote synthesis and dye conjugation
All DNA antidotes were synthesized by Integrated DNA Technologies (Coralville, IA, USA). Dye-labeled Tog25t (GGG AAC AAA GCU GAA GUA CUU ACC C), control 2 (AF680-GGG AAC AAA GCU GAA GUA CUU AGG G), and antidote mA4 (GGG UAA GUA CUU CAG) were either synthesized by BioSynthesis (Lewisville, TX, USA) or synthesized in house. Dye-labeled control 1 (GGG AAC AAA GCU GAA GUA CAA ACC C) and scrambled mA4 (UAG GUC AUC AGG UAG) were synthesized in house. All oligonucleotides were synthesized by solid phase synthesis on a Mermade 12 synthesizer (Biosearch Technologies, Middleton, WI, USA) as previously described.43 Briefly, the aptamers were synthesized using 2′-F-modified pyrimidines and 2′OH purines, and the antidotes synthesized using 2′OMe amidites, on an inverted dT CPG column. Synthesis reagents were purchased from Glen Research (Sterling, VA, USA) and Chemgenes (Wilmington, MA, USA). All aptamers were synthesized bearing a 5′ amine using an amine phosphoramidite. Aptamers and antidotes were purified by reversed-phase high-performance liquid chromatography (HPLC) on a 10 × 50 mm Xbridge C18 column heated to 65°C (Waters, Milford, MA, USA) using a linear gradient of acetonitrile in 0.1 M TEAA (pH 7.5). Purified aptamers bearing a 5′ amine linker were dissolved in 100 mM NaBorate buffer (pH 8.5) at a concentration of at least 100 μM and reacted with 2- to 10-fold molar excess 20 mM NHS ester-activated AF680 (Thermo Fisher Scientific) dissolved in anhydrous DMSO overnight at 4°C. Reactions were monitored by analytical HPLC to verify completion and subsequently purified by reversed-phase HPLC as described above.
aPTT coagulation assays
Aptamer and antidote effects on clotting in an aPTT assay were determined using a STart 4 mechanical coagulometer (Diagnostica Stago, Asnie’res sur Seine Cedex, France). Aptamers were diluted to 31 μM in DPBS with Ca2+ and Mg2+ (Thermo Fisher Scientific) and folded by heating at 65°C for 5 min followed by cooling at RT for 3 min. For experiments where aptamers and antidotes were tested together, the aptamers were folded separately prior to the addition of 2-fold excess antidote. Plasma was citrated to prevent clotting prior to assay activation. Pooled normal human plasma was purchased from George King Biomedical (Overland Parks, KS), while pooled C57BL/6J mouse plasma was obtained via venipuncture of the posterior vena cava from mice anesthetized with 2% isoflurane (All mouse work was conducted in accordance with the Guide for the Care and Use of Laboratory Animals44 and approved by the Duke University Instituational Animal Care and Use Committee (protocols A046-19-02, A068-16-03, and A106-13-04). Rhesus monkey plasma was obtained from blood samples collected via peripheral vessel from animals sedated with ketamine hydrochloride (10 mg/kg) (provided by A. Tarantal from stored specimens). Fresh, pooled mouse blood was spun down to isolate plasma, while rhesus plasma was frozen in aliquots and shipped by overnight courier, then thawed for aPTT assays. Male and female C57BL/6J mice were obtained from The Jackson Laboratory (Bar Harbor, ME, USA). For the aPTT assay, 5 μL aptamer or aptamer plus antidote (or control DPBS with Ca2+ and Mg2+) was added to 50 μL plasma and 50 μL TriniCLOT aPTT S (Trinity Biotech, Bray, Co Wicklow, Ireland) and incubated for 5 min at 37°C. Clotting was initiated by addition of 50 μL 0.02 M CaCl2 and the time to clot formation determined.
Data were analyzed by unpaired t tests with individual variances in Graphpad Prism.
Imaging of jugular vein thrombosis models
All jugular vein imaging studies were conducted in accordance with the Guide for the Care and Use of Laboratory Animals44 and approved by the Duke University Institutional Animal Care and Use Committee (protocols A046-19-02, A068-16-03, and A106-13-04). Male and female C57BL/6J mice were obtained from The Jackson Laboratory. Mice were anesthetized with ketamine:xylazine (100 mg/kg: 10 mg/kg; redose to maintain anesthesia of 30 mg/kg: 3 mg/kg) and acepromazine (3 mg/kg) or with isofluorane and the left jugular vein isolated. A subocclusive jugular thrombosis was induced by soaking a 1 × 2 mm Whatman paper patch in 5% ferric chloride for 3 min before placing the patch on the vein for 30 s, briefly removing the patch, and then placing it on the vein for an additional 30 s. After initiation of thrombosis, mice were sutured closed and imaged using a FMT2500LX (PerkinElmer). Mice were injected either before or after blood clot formation via tail vein injection of 2 nmol AF680-Tog25t or AF680-control 2. Mice injected with antidote received a 5-fold excess (10 nmol) of antidote via tail vein.
Intravital microscopy
All intravital microscopy imaging studies were conducted in accordance with the Guide for the Care and Use of Laboratory Animals44 and approved by the University of North Carolina Institutional Animal Care and Use Committee. Male C57BL/6J mice were obtained from The Jackson Laboratory. Mice were anesthetized with pentobarbital (50 mg/kg body weight) and the left jugular vein isolated for catheter placement. The right femoral vein was surgically exposed by groin incision and placed under microscopic view with a Wild/Leica operating microscope connected to an intravital laser and filter setup as previously described.45 Imaging of the right femoral vein was initiated, and fibrin-specific antibody (59D8)46,47 labeled with AF532 (Thermo Fisher Scientific) was injected via the jugular catheter. Subsequently, an electrolytic injury was induced on the surface of the right saphenous vein by touching the surface of the vessel with the blunt end of a 70 μm diameter steel needle (Surgical Specialties, Reading, PA, USA) connected to an anode, with the circuit completed by touching local subdermal tissue with the cathode, and a 30 s, 1.5 V current applied. Twenty minutes after clot initiation, AF680-Tog25t or AF680-control 1 was injected via the jugular catheter, and imaging continued for 2 h after clot formation.
Acknowledgments
We thank George Pitoc for assistance with setting up equipment for the mouse experiments and Holly Moody for technical assistance with mice. This work was supported by the National Institutes of Health (HL147147 and OD011107). Funding for open access charge came from the National Institutes of Health.
Author contributions
Conceptualization, B.P.G., L.K., K.-A.S.-B., S.M.N., and B.A.S.; funding acquisition, A.F.T. and B.A.S.; investigation, B.P.G., L.K., K.-A.S.-B., J.M.L., R.E.R., and B.C.C.; methodology, B.P.G., L.K., and K.-A.S.-B.; resources, A.F.T.; supervision, B.A.S.; visualization, B.P.G. and B.C.C.; writing – original draft, B.P.G.; writing – review & editing, J.M.L., B.C.C., A.F.T. and B.A.S.
Declaration of interests
Duke University has submitted patent applications on the use of aptamer-based clot imaging.
Footnotes
Supplemental information can be found online at https://doi.org/10.1016/j.omtn.2023.01.009.
Supplemental information
Data availability
All data generated or analyzed during this study are included in this published article and its supplemental information files.
References
- 1.Raskob G.E., Angchaisuksiri P., Blanco A.N., Buller H., Gallus A., Hunt B.J., Hylek E.M., Kakkar A., Konstantinides S.V., McCumber M., et al. Thrombosis: a major contributor to global disease burden. Arterioscler. Thromb. Vasc. Biol. 2014;34:2363–2371. doi: 10.1161/ATVBAHA.114.304488. [DOI] [PubMed] [Google Scholar]
- 2.Xiong X., Chi J., Gao Q. Prevalence and risk factors of thrombotic events on patients with COVID-19: a systematic review and meta-analysis. Thromb. J. 2021;19:32. doi: 10.1186/s12959-021-00284-9. [DOI] [PMC free article] [PubMed] [Google Scholar]
- 3.Ahmad F.B., Anderson R.N. The leading causes of death in the US for 2020. JAMA. 2021;325:1829–1830. doi: 10.1001/jama.2021.5469. [DOI] [PMC free article] [PubMed] [Google Scholar]
- 4.Wang X., Peter K. Molecular imaging of atherothrombotic diseases. Arterioscler. Thromb. Vasc. Biol. 2017;37:1029–1040. doi: 10.1161/ATVBAHA.116.306483. [DOI] [PubMed] [Google Scholar]
- 5.Conrad R.C., Giver L., Tian Y., Ellington A.D. In vitro selection of nucleic acid aptamers that bind proteins. Methods Enzymol. 1996;267:336–367. doi: 10.1016/s0076-6879(96)67022-0. [DOI] [PubMed] [Google Scholar]
- 6.Osborne S.E., Ellington A.D. Nucleic acid selection and the challenge of combinatorial chemistry. Chem. Rev. 1997;97:349–370. doi: 10.1021/cr960009c. [DOI] [PubMed] [Google Scholar]
- 7.Nimjee S.M., White R.R., Becker R.C., Sullenger B.A. Aptamers as therapeutics. Annu. Rev. Pharmacol. Toxicol. 2017;57:61–79. doi: 10.1146/annurev-pharmtox-010716-104558. [DOI] [PMC free article] [PubMed] [Google Scholar]
- 8.Rusconi C.P., Scardino E., Layzer J., Pitoc G.A., Ortel T.L., Monroe D., Sullenger B.A. RNA aptamers as reversible antagonists of coagulation factor IXa. Nature. 2002;419:90–94. doi: 10.1038/nature00963. [DOI] [PubMed] [Google Scholar]
- 9.Nimjee S.M., Keys J.R., Pitoc G.A., Quick G., Rusconi C.P., Sullenger B.A. A novel antidote-controlled anticoagulant reduces thrombin generation and inflammation and improves cardiac function in cardiopulmonary bypass surgery. Mol. Ther. 2006;14:408–415. doi: 10.1016/j.ymthe.2006.04.006. [DOI] [PubMed] [Google Scholar]
- 10.Dyke C.K., Steinhubl S.R., Kleiman N.S., Cannon R.O., Aberle L.G., Lin M., Myles S.K., Melloni C., Harrington R.A., Alexander J.H., et al. First-in-human experience of an antidote-controlled anticoagulant using RNA aptamer technology: a phase 1a pharmacodynamic evaluation of a drug-antidote pair for the controlled regulation of factor IXa activity. Circulation. 2006;114:2490–2497. doi: 10.1161/CIRCULATIONAHA.106.668434. [DOI] [PubMed] [Google Scholar]
- 11.Sullenger B.A., Nair S. From the RNA world to the clinic. Science. 2016;352:1417–1420. doi: 10.1126/science.aad8709. [DOI] [PMC free article] [PubMed] [Google Scholar]
- 12.Chan M.Y., Cohen M.G., Dyke C.K., Myles S.K., Aberle L.G., Lin M., Walder J., Steinhubl S.R., Gilchrist I.C., Kleiman N.S., et al. Phase 1b randomized study of antidote-controlled modulation of factor IXa activity in patients with stable coronary artery disease. Circulation. 2008;117:2865–2874. doi: 10.1161/CIRCULATIONAHA.107.745687. [DOI] [PubMed] [Google Scholar]
- 13.DeAnda A., Jr., Coutre S.E., Moon M.R., Vial C.M., Griffin L.C., Law V.S., Komeda M., Leung L.L., Miller D.C. Pilot study of the efficacy of a thrombin inhibitor for use during cardiopulmonary bypass. Ann. Thorac. Surg. 1994;58:344–350. doi: 10.1016/0003-4975(94)92206-3. [DOI] [PubMed] [Google Scholar]
- 14.Eyetech Study Group Anti-vascular endothelial growth factor therapy for subfoveal choroidal neovascularization secondary to age-related macular degeneration: phase II study results. Ophthalmology. 2003;110:979–986. doi: 10.1016/S0161-6420(03)00085-X. [DOI] [PubMed] [Google Scholar]
- 15.Chan M.Y., Rusconi C.P., Alexander J.H., Tonkens R.M., Harrington R.A., Becker R.C. A randomized, repeat-dose, pharmacodynamic and safety study of an antidote-controlled factor IXa inhibitor. J. Thromb. Haemost. 2008;6:789–796. doi: 10.1111/j.1538-7836.2008.02932.x. [DOI] [PubMed] [Google Scholar]
- 16.Fenton J.W., 2nd, Olson T.A., Zabinski M.P., Wilner G.D. Anion-binding exosite of human alpha-thrombin and fibrin(ogen) recognition. Biochemistry. 1988;27:7106–7112. doi: 10.1021/bi00418a066. [DOI] [PubMed] [Google Scholar]
- 17.White R., Rusconi C., Scardino E., Wolberg A., Lawson J., Hoffman M., Sullenger B. Generation of species cross-reactive aptamers using "toggle" SELEX. Mol. Ther. 2001;4:567–573. doi: 10.1006/mthe.2001.0495. [DOI] [PubMed] [Google Scholar]
- 18.Long S.B., Long M.B., White R.R., Sullenger B.A. Crystal structure of an RNA aptamer bound to thrombin. RNA. 2008;14:2504–2512. doi: 10.1261/rna.1239308. [DOI] [PMC free article] [PubMed] [Google Scholar]
- 19.Jeter M.L., Ly L.V., Fortenberry Y.M., Whinna H.C., White R.R., Rusconi C.P., Sullenger B.A., Church F.C. RNA aptamer to thrombin binds anion-binding exosite-2 and alters protease inhibition by heparin-binding serpins. FEBS Lett. 2004;568:10–14. doi: 10.1016/j.febslet.2004.04.087. [DOI] [PubMed] [Google Scholar]
- 20.Bock L.C., Griffin L.C., Latham J.A., Vermaas E.H., Toole J.J. Selection of single-stranded DNA molecules that bind and inhibit human thrombin. Nature. 1992;355:564–566. doi: 10.1038/355564a0. [DOI] [PubMed] [Google Scholar]
- 21.Nakatsuka M.A., Barback C.V., Fitch K.R., Farwell A.R., Esener S.C., Mattrey R.F., Cha J.N., Goodwin A.P. In vivo ultrasound visualization of non-occlusive blood clots with thrombin-sensitive contrast agents. Biomaterials. 2013;34:9559–9565. doi: 10.1016/j.biomaterials.2013.08.040. [DOI] [PMC free article] [PubMed] [Google Scholar]
- 22.Russo Krauss I., Merlino A., Randazzo A., Novellino E., Mazzarella L., Sica F. High-resolution structures of two complexes between thrombin and thrombin-binding aptamer shed light on the role of cations in the aptamer inhibitory activity. Nucleic Acids Res. 2012;40:8119–8128. doi: 10.1093/nar/gks512. [DOI] [PMC free article] [PubMed] [Google Scholar]
- 23.Padmanabhan K., Padmanabhan K.P., Ferrara J.D., Sadler J.E., Tulinsky A. The structure of alpha-thrombin inhibited by a 15-mer single-stranded DNA aptamer. J. Biol. Chem. 1993;268:17651–17654. doi: 10.2210/pdb1hut/pdb. [DOI] [PubMed] [Google Scholar]
- 24.Jaffer F.A., Tung C.-H., Gerszten R.E., Weissleder R. In vivo imaging of thrombin activity in experimental thrombi with thrombin-sensitive near-infrared molecular probe. Arterioscler. Thromb. Vasc. Biol. 2002;22:1929–1935. doi: 10.1161/01.atv.0000033089.56970.2d. [DOI] [PubMed] [Google Scholar]
- 25.Page M.J., Lourenço A.L., David T., LeBeau A.M., Cattaruzza F., Castro H.C., VanBrocklin H.F., Coughlin S.R., Craik C.S. Non-invasive imaging and cellular tracking of pulmonary emboli by near-infrared fluorescence and positron-emission tomography. Nat. Commun. 2015;6:8448. doi: 10.1038/ncomms9448. [DOI] [PMC free article] [PubMed] [Google Scholar]
- 26.Wang Y., Xu M., Yang N., Gao S., Li S., Zhang J., Bi Y., Ren S., Hou Y., Jiang M., et al. A thrombin-responsive nanoprobe for in vivo visualization of thrombus formation through three-dimensional optical/computed tomography hybrid imaging. ACS Appl. Mater. Interfaces. 2021;13:27814–27824. doi: 10.1021/acsami.1c04065. [DOI] [PubMed] [Google Scholar]
- 27.Bar Barroeta A., Marquart J.A., Meijers J.C. A FRET-based assay for the quantification of the thrombin-factor XI interaction. Thromb. Res. 2022;214:23–28. doi: 10.1016/j.thromres.2022.04.006. [DOI] [PubMed] [Google Scholar]
- 28.Dougherty C.A., Cai W., Hong H. Applications of aptamers in targeted imaging: state of the art. Curr. Top. Med. Chem. 2015;15:1138–1152. doi: 10.2174/1568026615666150413153400. [DOI] [PMC free article] [PubMed] [Google Scholar]
- 29.Koudrina A., O'Brien J., Garcia R., Boisjoli S., Kan P.T.M., Tsai E.C., DeRosa M.C. Assessment of aptamer-targeted contrast agents for monitoring of blood clots in computed tomography and fluoroscopy imaging. Bioconjug. Chem. 2020;31:2737–2749. doi: 10.1021/acs.bioconjchem.0c00525. [DOI] [PubMed] [Google Scholar]
- 30.Koudrina A., McConnell E.M., Zurakowski J.A., Cron G.O., Chen S., Tsai E.C., DeRosa M.C. Exploring the unique contrast properties of aptamer-gadolinium conjugates in magnetic resonance imaging for targeted imaging of thrombi. ACS Appl. Mater. Interfaces. 2021;13:9412–9424. doi: 10.1021/acsami.0c16666. [DOI] [PubMed] [Google Scholar]
- 31.Mokin M., Rojas H., Levy E.I. Randomized trials of endovascular therapy for stroke--impact on stroke care. Nat. Rev. Neurol. 2016;12:86–94. doi: 10.1038/nrneurol.2015.240. [DOI] [PubMed] [Google Scholar]
- 32.Woodruff R.S., Ivanov I., Verhamme I.M., Sun M.-F., Gailani D., Sullenger B.A. Generation and characterization of aptamers targeting factor XIa. Thromb. Res. 2017;156:134–141. doi: 10.1016/j.thromres.2017.06.015. [DOI] [PMC free article] [PubMed] [Google Scholar]
- 33.Woodruff R.S., Xu Y., Layzer J., Wu W., Ogletree M.L., Sullenger B.A. Inhibiting the intrinsic pathway of coagulation with a factor XII-targeting RNA aptamer. J. Thromb. Haemost. 2013;11:1364–1373. doi: 10.1111/jth.12302. [DOI] [PMC free article] [PubMed] [Google Scholar]
- 34.Woodruff R.S., Sullenger B., Becker R.C. The many faces of the contact pathway and their role in thrombosis. J. Thromb. Thrombolysis. 2011;32:9–20. doi: 10.1007/s11239-011-0578-5. [DOI] [PubMed] [Google Scholar]
- 35.Sullenger B., Woodruff R., Monroe D.M. Potent anticoagulant aptamer directed against factor IXa blocks macromolecular substrate interaction. J. Biol. Chem. 2012;287:12779–12786. doi: 10.1074/jbc.M111.300772. [DOI] [PMC free article] [PubMed] [Google Scholar]
- 36.Buddai S.K., Layzer J.M., Lu G., Rusconi C.P., Sullenger B.A., Monroe D.M., Krishnaswamy S. An anticoagulant RNA aptamer that inhibits proteinase-cofactor interactions within prothrombinase. J. Biol. Chem. 2010;285:5212–5223. doi: 10.1074/jbc.M109.049833. [DOI] [PMC free article] [PubMed] [Google Scholar]
- 37.Oney S., Nimjee S.M., Layzer J., Que-Gewirth N., Ginsburg D., Becker R.C., Arepally G., Sullenger B.A. Antidote-controlled platelet inhibition targeting von Willebrand factor with aptamers. Oligonucleotides. 2007;17:265–274. doi: 10.1089/oli.2007.0089. [DOI] [PubMed] [Google Scholar]
- 38.Gunaratne R., Kumar S., Frederiksen J.W., Stayrook S., Lohrmann J.L., Perry K., Bompiani K.M., Chabata C.V., Thalji N.K., Ho M.D., et al. Combination of aptamer and drug for reversible anticoagulation in cardiopulmonary bypass. Nat. Biotechnol. 2018;36:606–613. doi: 10.1038/nbt.4153. [DOI] [PMC free article] [PubMed] [Google Scholar]
- 39.Nimjee S.M., Sullenger B.A. Therapeutic aptamers: evolving to find their clinical niche. Curr. Med. Chem. 2020;27:4181–4193. doi: 10.2174/0929867326666191001125101. [DOI] [PMC free article] [PubMed] [Google Scholar]
- 40.Nimjee S.M., Dornbos D., 3rd, Pitoc G.A., Wheeler D.G., Layzer J.M., Venetos N., Huttinger A., Talentino S.E., Musgrave N.J., Moody H., et al. Preclinical development of a vWF aptamer to limit thrombosis and engender arterial recanalization of occluded vessels. Mol. Ther. 2019;27:1228–1241. doi: 10.1016/j.ymthe.2019.03.016. [DOI] [PMC free article] [PubMed] [Google Scholar]
- 41.Sousa R., Padilla R. A mutant T7 RNA polymerase as a DNA polymerase. EMBO J. 1995;14:4609–4621. doi: 10.1002/j.1460-2075.1995.tb00140.x. [DOI] [PMC free article] [PubMed] [Google Scholar]
- 42.Wong I., Lohman T.M. A double-filter method for nitrocellulose-filter binding: application to protein-nucleic acid interactions. Proc. Natl. Acad. Sci. USA. 1993;90:5428–5432. doi: 10.1073/pnas.90.12.5428. [DOI] [PMC free article] [PubMed] [Google Scholar]
- 43.Wilner S.E., Wengerter B., Maier K., de Lourdes Borba Magalhães M., Del Amo D.S., Pai S., Opazo F., Rizzoli S.O., Yan A., Levy M. An RNA alternative to human transferrin: a new tool for targeting human cells. Mol. Ther. Nucleic Acids. 2012;1:e21. doi: 10.1038/mtna.2012.14. [DOI] [PMC free article] [PubMed] [Google Scholar]
- 44.National Research Council (US) Committee for the Update of the Guide for the Care and Use of Laboratory Animals . Edn. 8th. National Academies Press; 2011. Guide for the Care and Use of Laboratory Animals. [PubMed] [Google Scholar]
- 45.Cooley B.C. In vivo fluorescence imaging of large-vessel thrombosis in mice. Arterioscler. Thromb. Vasc. Biol. 2011;31:1351–1356. doi: 10.1161/ATVBAHA.111.225334. [DOI] [PMC free article] [PubMed] [Google Scholar]
- 46.Hui K.Y., Haber E., Matsueda G.R. Monoclonal antibodies to a synthetic fibrin-like peptide bind to human fibrin but not fibrinogen. Science. 1983;222:1129–1132. doi: 10.1126/science.6648524. [DOI] [PubMed] [Google Scholar]
- 47.Runge M.S., Bode C., Matsueda G.R., Haber E. Antibody-enhanced thrombolysis: targeting of tissue plasminogen activator in vivo. Proc. Natl. Acad. Sci. USA. 1987;84:7659–7662. doi: 10.1073/pnas.84.21.7659. [DOI] [PMC free article] [PubMed] [Google Scholar]
Associated Data
This section collects any data citations, data availability statements, or supplementary materials included in this article.
Supplementary Materials
Representative video from a mouse injected with fibrin antibody (anti-fibrin) via a jugular catheter before exposing a femoral vein. An electrolytic stimulus was used to injure the femoral vein to form a discrete sub-occlusive clot. Intravital imaging was begun, and 20 mins after clot initiation, 2 nmoles of AF680-Tog25t injected via the jugular catheter. The video covers from the time of clot initiation, appearing as green signal due to anti-fibrin staining, to 1 hr after clot initiation. AF680-Tog25t signal appears in red.
Representative video from a mouse injected with fibrin antibody (anti-fibrin) via a jugular catheter before exposing a femoral vein. An electrolytic stimulus was used to injure the femoral vein to form a discrete sub-occlusive clot. Intravital imaging was begun, and 20 mins after clot initiation, 2 nmoles of AF680-Control 2 injected via the jugular catheter. The video covers from the time of clot initiation, appearing as green signal due to anti-fibrin staining, to 1 hr after clot initiation. AF680-Control 2 signal appears in red.
Data Availability Statement
All data generated or analyzed during this study are included in this published article and its supplemental information files.