Abstract
Many aspects of plant photoperception are mediated by the phytochrome (Phy) family of bilin-containing photoreceptors that reversibly interconvert between inactive Pr and active Pfr conformers1,2. Despite extensive biochemical studies, full understanding of plant Phy signalling has remained unclear due to the absence of relevant 3D models. Here we report a cryo-electron microscopy structure of Arabidopsis PhyB in the Pr state that reveals a topologically complex dimeric organization that is substantially distinct from its prokaryotic relatives. Instead of an anticipated parallel architecture, the C-terminal histidine-kinase-related domains (HKRDs) associate head-to-head, whereas the N-terminal photosensory regions associate head-to-tail to form a parallelogram-shaped platform with near two-fold symmetry. The platform is internally linked by the second of two internal Per/Arnt/Sim domains that binds to the photosensory module of the opposing protomer and a preceding ‘modulator’ loop that assembles tightly with the photosensory module of its own protomer. Both connections accelerate the thermal reversion of Pfr back to Pr, consistent with an inverse relationship between dimer assembly and Pfr stability. Lopsided contacts between the HKRDs and the platform create profound asymmetry to PhyB that might imbue distinct signalling potentials to the protomers. We propose that this unique structural dynamism creates an extensive photostate-sensitive surface for conformation-dependent interactions between plant Phy photoreceptors and their signalling partners.
Many organisms use an array of photoreceptors that help to tune their growth/motility and development to their ambient light environment. One prominent class includes the Phy photoreceptors, which are universal among plants and widely scattered throughout the fungal and bacterial kingdoms2–4. Phy photoreceptors autocatalytically bind to a bilin (or open-chain tetrapyrrole) prosthetic group to enable the sensation of red and far-red light through Pr–Pfr photointerconversion and thermal reversion of Pfr back to Pr. In plants, this Pr–Pfr exchange provides a master photoswitch for quantifying light fluence rate, duration and spectral quality, which in turn enables responses to day–night cycles, photoperiod and neighbour competition1,5. Moreover, some plant Phy photoreceptors sense temperature through thermal reversion, the rate of which strongly accelerates as temperature rises6–8.
Phy photoreceptors typically comprise a photosensory module (PSM) formed by sequential N-terminal Per/Arnt/Sim (nPAS), cGMP-specific phosphodiesterase/adenylyl cyclase/FhlA (GAF) and Phy-specific (PHY) domains, followed by a region that promotes dimerization (Fig. 1a). PSM geometry is stabilized by (1) a figure-of-eight knot that links the GAF domain to an N-terminal extension (NTE) upstream of the nPAS domain; (2) a helical spine connecting the GAF and PHY domains; and (3) a hairpin (or tongue) motif extending from the PHY domain to contact the GAF domain near the chromophore9–11. The GAF domain cradles the bilin through numerous chromophore–protein interactions, which are altered during photoconversion by rotation of the D pyrrole through a Z to E isomerization of the C15=C16 methine bridge10,12–15. Studies with bacterial Phy photoreceptors showed that this rotation induces refolding of the hairpin from β-stranded to α-helical, which displaces the PHY domain relative to the GAF domain12,13,15,16. As a transmitter histidine kinase (HK) module is often appended downstream, a common outcome of these conformational changes is the initiation/suppression of a two-component kinase cascade3,17,18.
Fig. 1 |. Overall 3D structure of the asymmetric Arabidopsis PhyB dimer.
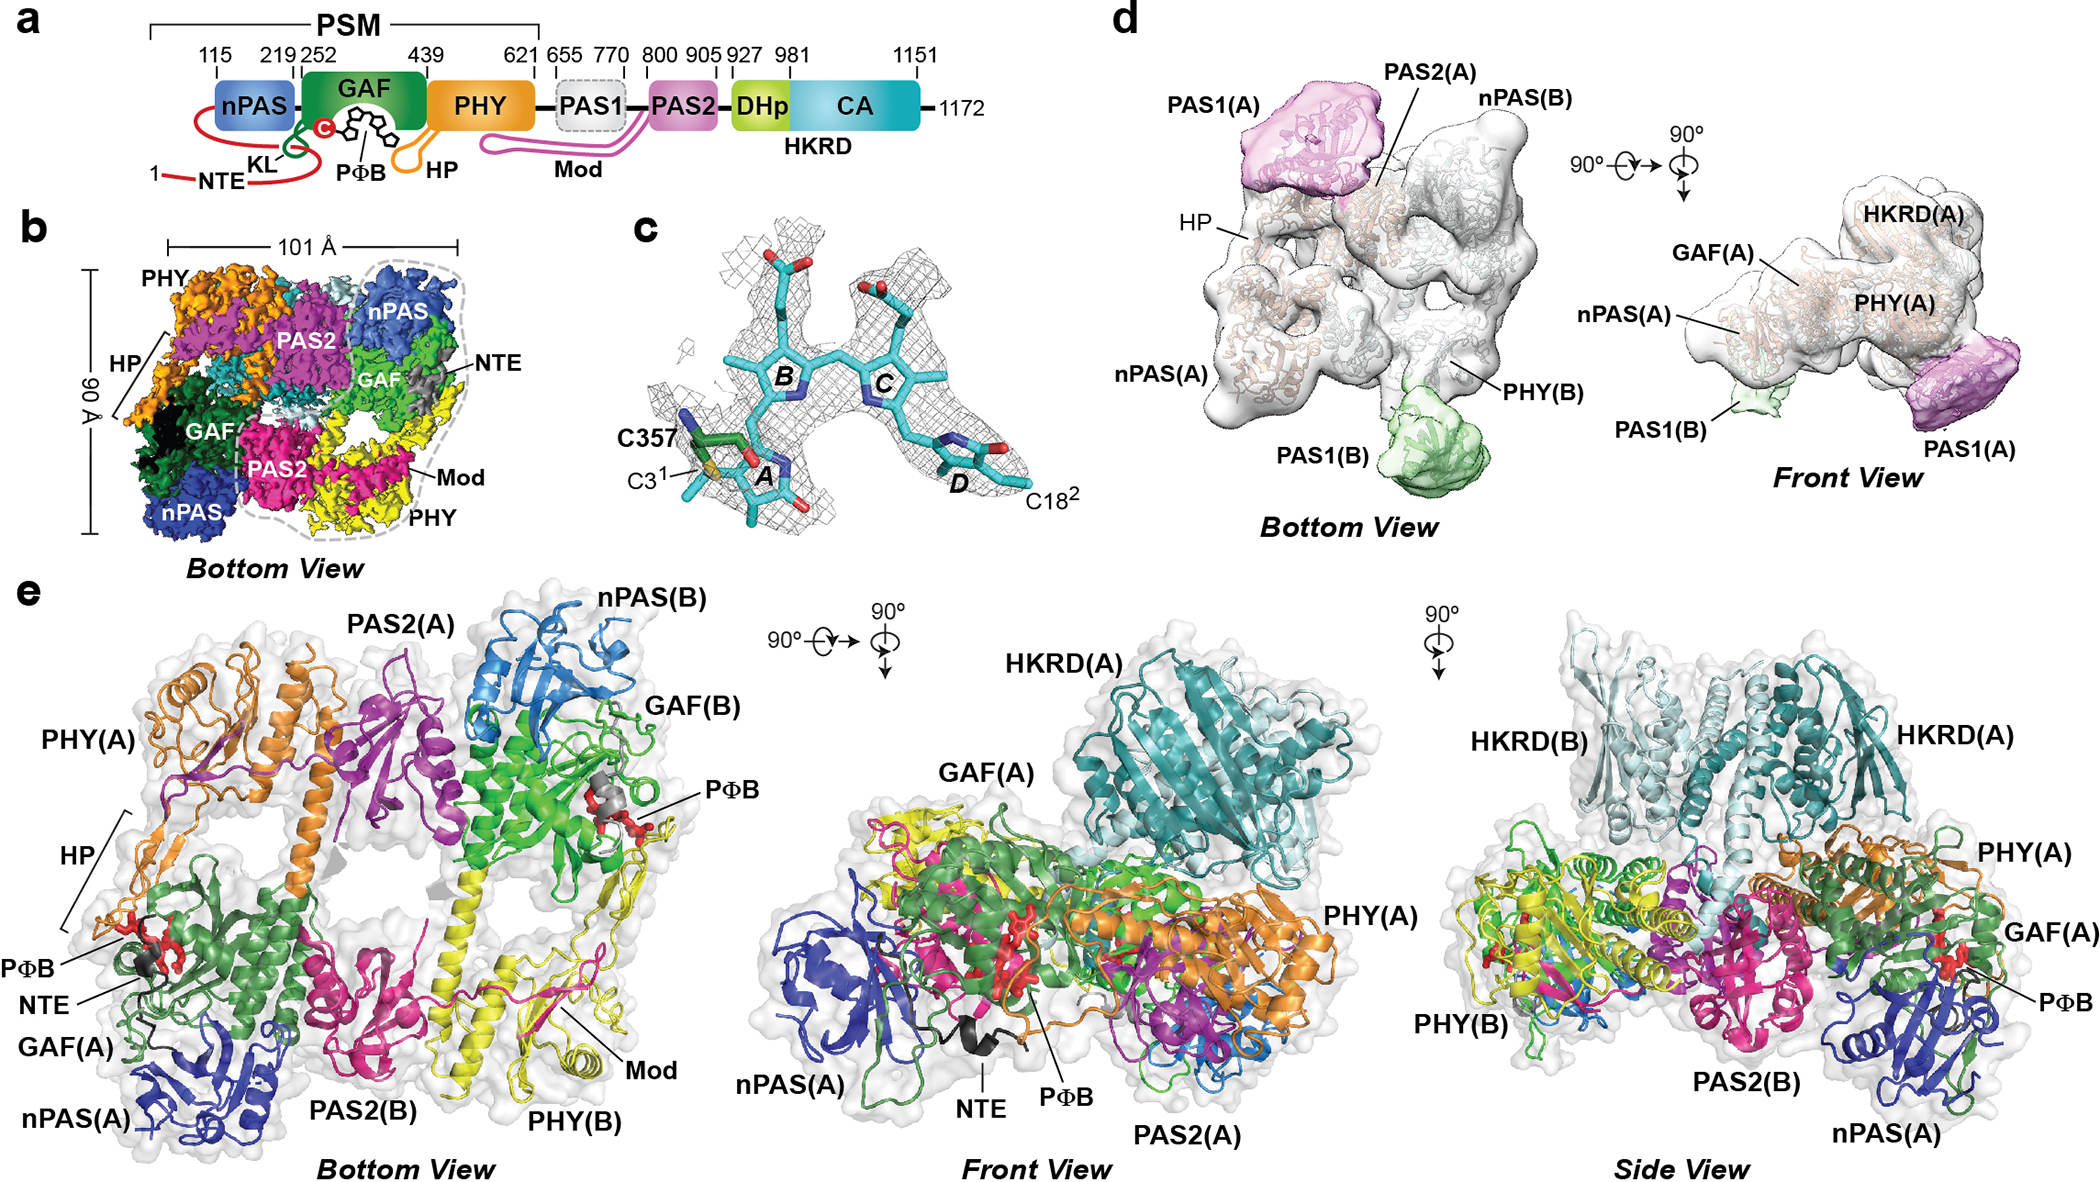
a, Domain organization of PhyB. The PΦB chromophore, the nPAS, GAF and PHY domains, and the NTE, knot loop (KL) and hairpin (HP) features within the PSM, the internal PAS1 and PAS2 domains, the modulator loop (Mod) preceding the PAS2 domain, and the DHp and CA domains within the HKRD are shown. The numbers locate the features within the PhyB polypeptide. b, Surface-rendered cryo-EM 3D map of the PhyB core dimer without the PAS1 domain in bottom view at a resolution of 3.3 Å. The dashed grey line delineates protomer B. c, EM density of PΦB in protomer A (grey) superposed with the atomic model in sticks. d, Bottom (left) and front (right) views of a surface-rendered, 15 Å resolution 3D map of the PhyB dimer, positioning the PAS1 domain in each protomer. e, Cartoon (colour) and transparent surface representations (light grey) of the 3.3 Å model of dimeric PhyB in bottom (left), front (middle) and side (right) views. Whereas the PSMs are arranged head-to-tail within the dimer, the HKRDs are arranged head-to-head. Features in protomers A and B are coloured individually. PΦB is shown in red sticks. The HKRD was deleted from the bottom view for clarity.
Although considerable progress has been made in understanding prokaryotic Phy photoreceptors, we do not yet appreciate how plant Phy photoreceptors signal despite their importance to numerous agriculturally relevant processes, ranging from seed germination and chloroplast development to shade avoidance and flowering time1,5. Major differences compared with their microbial relatives include the insertion of two predicted PAS domains (PAS1 and PAS2) after the PSM that could influence signal transmission internally19,20 (Fig. 1a), and substantial divergence of their HKRDs from those in bona fide transmitter kinases that might compromise a phosphotransferase activity21–23. A prevailing notion is that plant Phy photoreceptors in the Pfr state translocate from the cytoplasm to the nucleus where they associate with a collection of binding partners1. This includes a family of Phy-interacting factor (PIF) transcriptional regulators of which their actions are minimized by Pfr-induced, ubiquitin-mediated proteolysis1,24. In fact, these photoreversible Phy–PIF interactions are retained in heterologous systems, therefore inviting various optogenetic applications25–28. How plant Phy photoreceptors bind to PIFs in a light-regulated manner, the role(s) of the internal PAS domains, the function(s) of the HKRD beyond its dimerization potential29,30 and even whether plant Phy architectures resemble their prokaryotic brethren are currently unclear.
The structure of the Arabidopsis PhyB dimer
To address these questions, we generated an atomic-resolution cryo-electron microscopy (cryo-EM) model of the PhyB isoform from Arabidopsis thaliana assembled recombinantly with its native phytochromobilin (PΦB) chromophore8,31 (Extended Data Fig. 1a, b and Supplementary Methods). From nearly 1 million particle images, we selected through 2D and 3D classifications 154,901 images to construct and refine a 3D map at an average resolution of 3.3 Å (Extended Data Fig. 1c–h, Supplementary Video 1 and Extended Data Table 1). Using available plant PSM structures as guides32,33, we modelled nearly all residues of the PSM, residues 770–1151 encompassing the internal PAS2 domain and the dimerization histidine phosphotransfer (DHp) and catalytic ATP-binding (CA) subdomains within the HKRD, and PΦB covalently linked to Cys357 (Fig. 1b, c and Extended Data Figs. 2c and 3). Probably owing to intrinsic disorder8, well-defined EM density was absent for the first 101 residues and the last 21 residues. EM density for the predicted PAS1 domains (residues 622–769) could be seen in some 2D class averages, but were not resolved in the final 3.3 Å map. To visualize this region, we downsampled the particle images and performed 3D variability analysis to obtain a 15 Å map (Extended Data Fig. 1c) revealing PAS1 density at the expected positions but without distinguishing features (Fig. 1d).
The 3D model was confirmed by comparisons of the protomers to each other, superpositions with the X-ray crystallographic models of the PSM from Arabidopsis PhyB and other plant Phy photoreceptors32,33 and by comparisons with CA domain structures from bacterial transmitter HKs34–37 (Extended Data Figs. 2, 3 and 7e). Except for the DHp domain, the Cα positions in the PhyB model showed high congruity between sister domains across the dimer with root-mean-square deviations (r.m.s.d.) of 0.70–1.1 Å (Extended Data Table 2), and to orthologous regions from other Phy photoreceptors and transmitter HKs. Residues surrounding the bilin, many of which are essential for photochemistry8,16,32, also strongly overlapped between the EM and PSM crystallographic models of Arabidopsis PhyB (Extended Data Fig. 2f). Moreover, EM density was well defined for PΦB, which—similar to other plant Phy photoreceptors32,33—adopted a 5(Z)syn-10(Z)syn-15(Z)anti configuration in the two protomers with the D pyrrole rings tilted by 62° and 59°, respectively, relative to the co-planar A–C rings (Fig. 1c and Extended Data Fig. 2c, d).
As anticipated, the PAS2 domain was similar in structure to the nPAS domain (Extended Data Fig. 4b, c). Owing to poor local resolution, the PAS1 region was computationally modelled using TrRosetta ab initio. Its predicted PAS-type fold was consistent in size to its cryo-EM density with an α-helical segment possibly connecting it to the preceding PHY domain (Fig. 1d and Extended Data Fig. 4d).
To further support the model, we assayed PhyB for sensitivity to chymotrypsin and glutamyl endopeptidase using mass spectrometry to identify the released peptides (Extended Data Fig. 5). Most sensitive were the NTE and PAS1 regions, which are predicted to be mobile, and the α-helical tips of the DHp, which are solvent exposed, whereas the most protected were the GAF and PHY domains and regions occluded by dimerization. Cleavage N-terminal to the PAS1 domain was consistent with previous demonstrations that a region in plant Phy photoreceptors immediately after the PSM is protease hypersensitive38,39.
The PhyB dimer has an asymmetric topology
Examination of the 3D model revealed a PhyB architecture that was considerably different from expectations. Although bacterial Phy photoreceptors mostly assume a linear and symmetric head-to-head dimeric arrangement centred at an extended helical spine40–42, the PhyB dimer architecture was more topologically complicated and asymmetric without a central axis (Fig. 1b, e and Extended Data Fig. 4a). The PSMs were arranged head-to-tail without direct contact, thus explaining why they are monomeric in isolation39. Instead, the PAS2 domain and a newly identified 19-residue β-hairpin motif between the PAS1 and PAS2 domains, designated the modulator loop, mediated dimeric assembly of the PSMs (Fig. 1b, e and Extended Data Fig. 3f). These interactions of around 1,800 Å2 involving all domains from the nPAS to the PAS2 yielded an extensive parallelogram-shaped platform of at least 8,000 Å2 (Fig. 1b, e), which could easily accommodate various binding partners1. The Arabidopsis PhyB PSM crystal structure revealed a head-to-head dimer with extensive contact along its core helices32; we now conclude that this arrangement reflects a crystal packing artifact as seen in other plant PSM models33.
By contrast, the HKRDs assemble head-to-head (Fig. 1e), similar to those from bacterial transmitter HK modules34–37. However, instead of perching symmetrically above the PSMs, the pseudo-two-fold symmetric axis of the HKRDs was tilted 53° away from the vertical, resulting in a 103° rotation and 6.8 Å shift of the DHp and CA domains in protomer B relative to their counterparts in protomer A (Figs. 1e and 2a). This profound lean was anchored by a sizable lopsided interface between the HKRDs and the topside of the PSM–PAS2 platform that included connections between the CA and PHY domains of protomer A, and between the CA and GAF domains of protomer B (Fig. 2d, e). We predict that this HKRD lean does not toggle back and forth with both sides of the platform but becomes fixed after dimer assembly given the extent of this interface, and might be common among plant Phy photoreceptors given that numerous conserved residues participate (Extended Data Fig. 6).
Fig. 2 |. Asymmetry in the PhyB dimer.
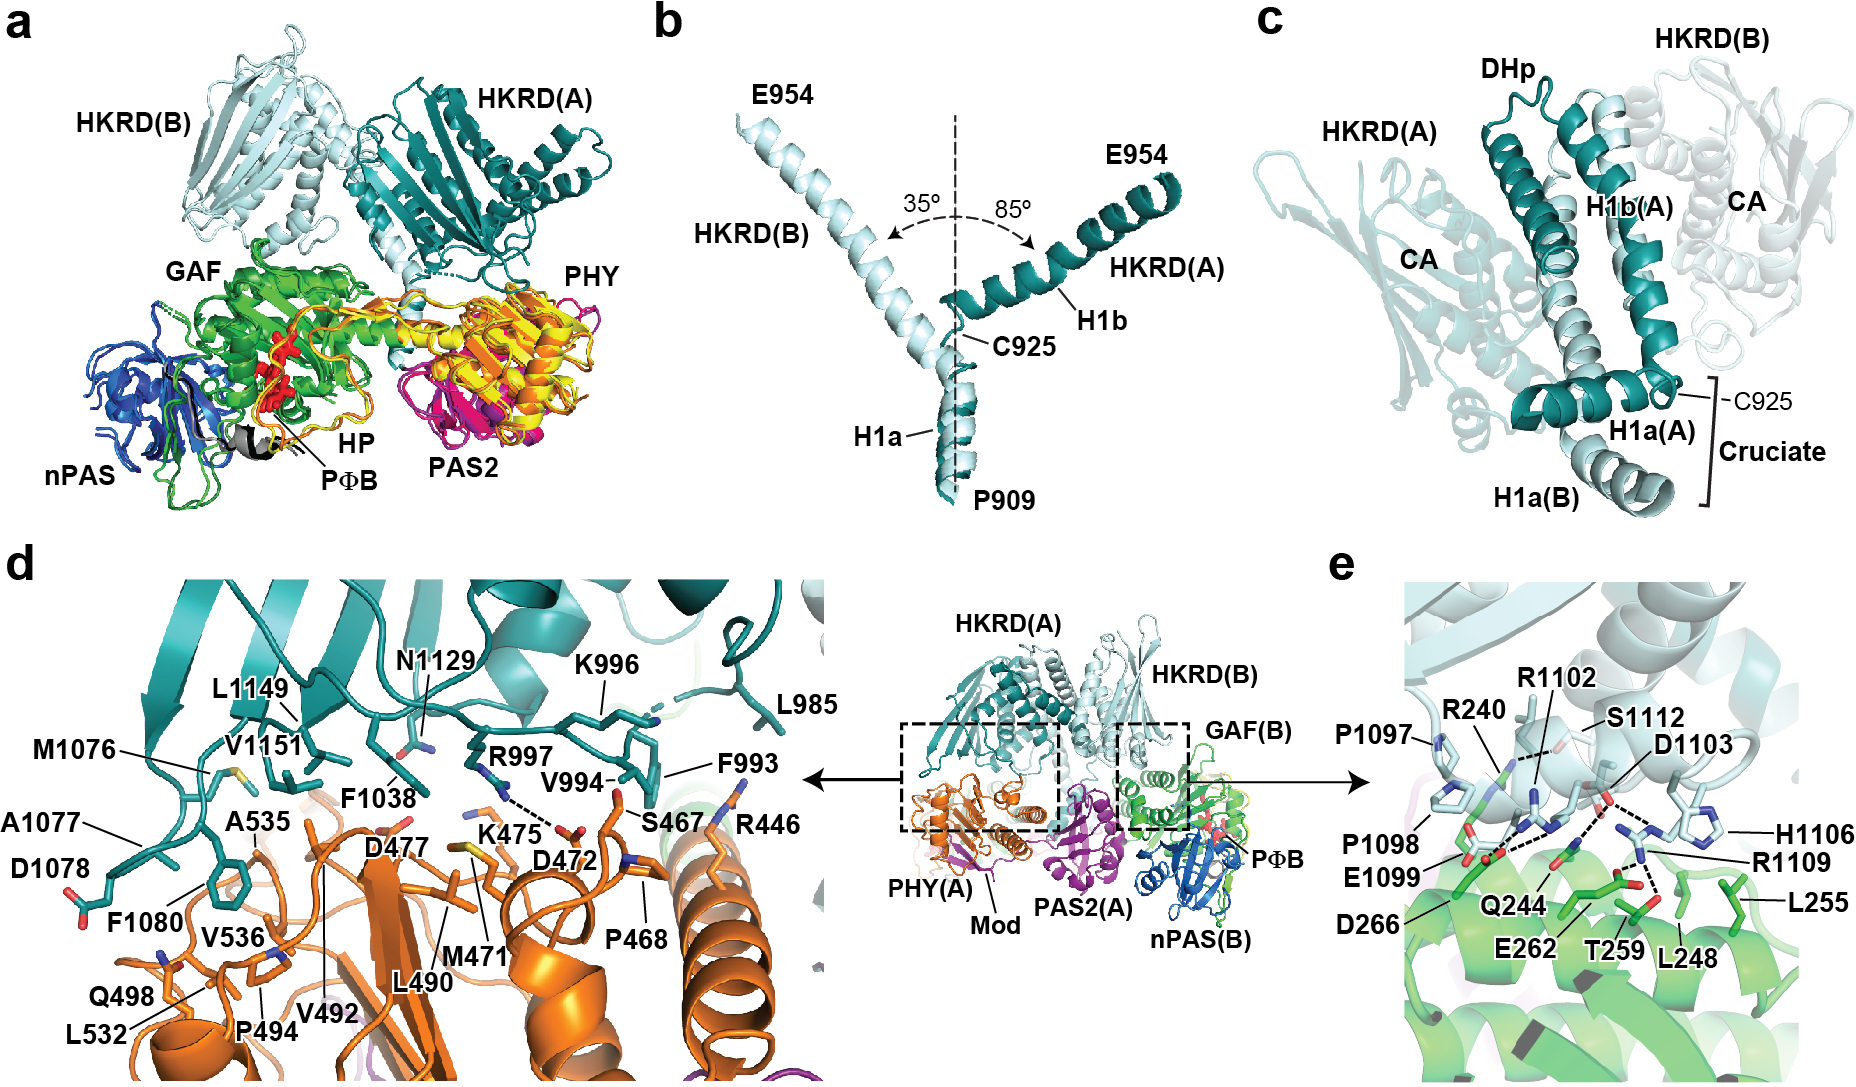
a, Superposition of protomers A and B based on the subtending PSM–PAS2 module, revealing the distinct HKRD positions in the two protomers. Domains are coloured as in Fig. 1e. b, Alignment of the DHp α1 helices to illustrate the distinct positions of the helical H1a and H1b segments in the DHp domain from protomers A and B that diverge at the cruciate. c, View of the DHp domains showing the intertwined H1a and H1b segments (protomers are coloured in dark and light cyan). The cruciate bend at Cys925 allows the switch from a head-to-tail orientation for the paired PSMs to a head-to-head orientation for the paired HKRDs. d, e, Focused views of the asymmetric connections between the HKRDs and the PSMs. d, Contacts between the HKRD from protomer A and the PHY domain in protomer A. e, Contacts between the HKRD of protomer B and the GAF domain of protomer B. Hydrogen bonds are indicated by the dashed lines.
The tilt of the HKRDs relative to the PSM–PAS2 platform also induces a sharp bend in helix α1 within the DHp domain that transitions PhyB from antiparallel to parallel associations (Fig. 2b). Whereas DHp domains in transmitter HKs typically associate through paired long and straight α1 helices that continue from the sensory modules34–37, these α-helices in PhyB are not similarly contiguous. Rather, they arise following strand β5 of the PAS2 domain, and are kinked at Cys925, therefore generating two helical segments (H1a and H1b) (Fig. 2c). The straight H1b segments associate normally with helix α2 to form the DHp four-helix bundle, whereas the H1a segments, collectively designated the cruciates, swivel around each other and are angled nearly perpendicular to the PSM–PAS2 platform. The non-identical connections between the two CA domains and the PSM–PAS2 platform then enforce different bends in the cruciates. Whereas the axis of H1a diverges from H1b by only 35° in protomer B, it is nearly perpendicular in protomer A (Fig. 2b).
The PHY–PAS2 bidomain stabilizes the PhyB dimer
The head-to-tail followed by head-to-head architecture of Arabidopsis PhyB implies that it contributes to a unique signalling mechanism of the plant photoreceptors. Particularly notable are the PAS2–(nPAS–GAF) contacts between the two protomers and the modulator–PHY contact within each protomer, which are substantial and involve numerous conserved residues. The PAS2–(nPAS–GAF) connection includes a mix of hydrophobic and electrostatic interactions between helices α3 and α4 from the PAS2 domain of one protomer and helices α1 and α6 of the GAF domain and helix α4 from the nPAS domain of the other protomer (Fig. 3a). By contrast, modulator–PHY binding involves largely invariant hydrophobic contacts which allow the modulator to wrap around the helical core and extend the PHY domain β-sheet core by two β-strands (Figs. 1e, 4a, b and Extended Data Fig. 4a). Notably, the tip of the modulator loop contains an invariant GDY motif that projects towards the hairpin, suggesting that this interface is photostate sensitive (Fig. 4b, c and Extended Data Figs. 3f, 6).
Fig. 3 |. The PSMs of PhyB are held by cross-protomer contacts between the PAS2 domain and the nPAS–GAF region that also destabilize Pfr.
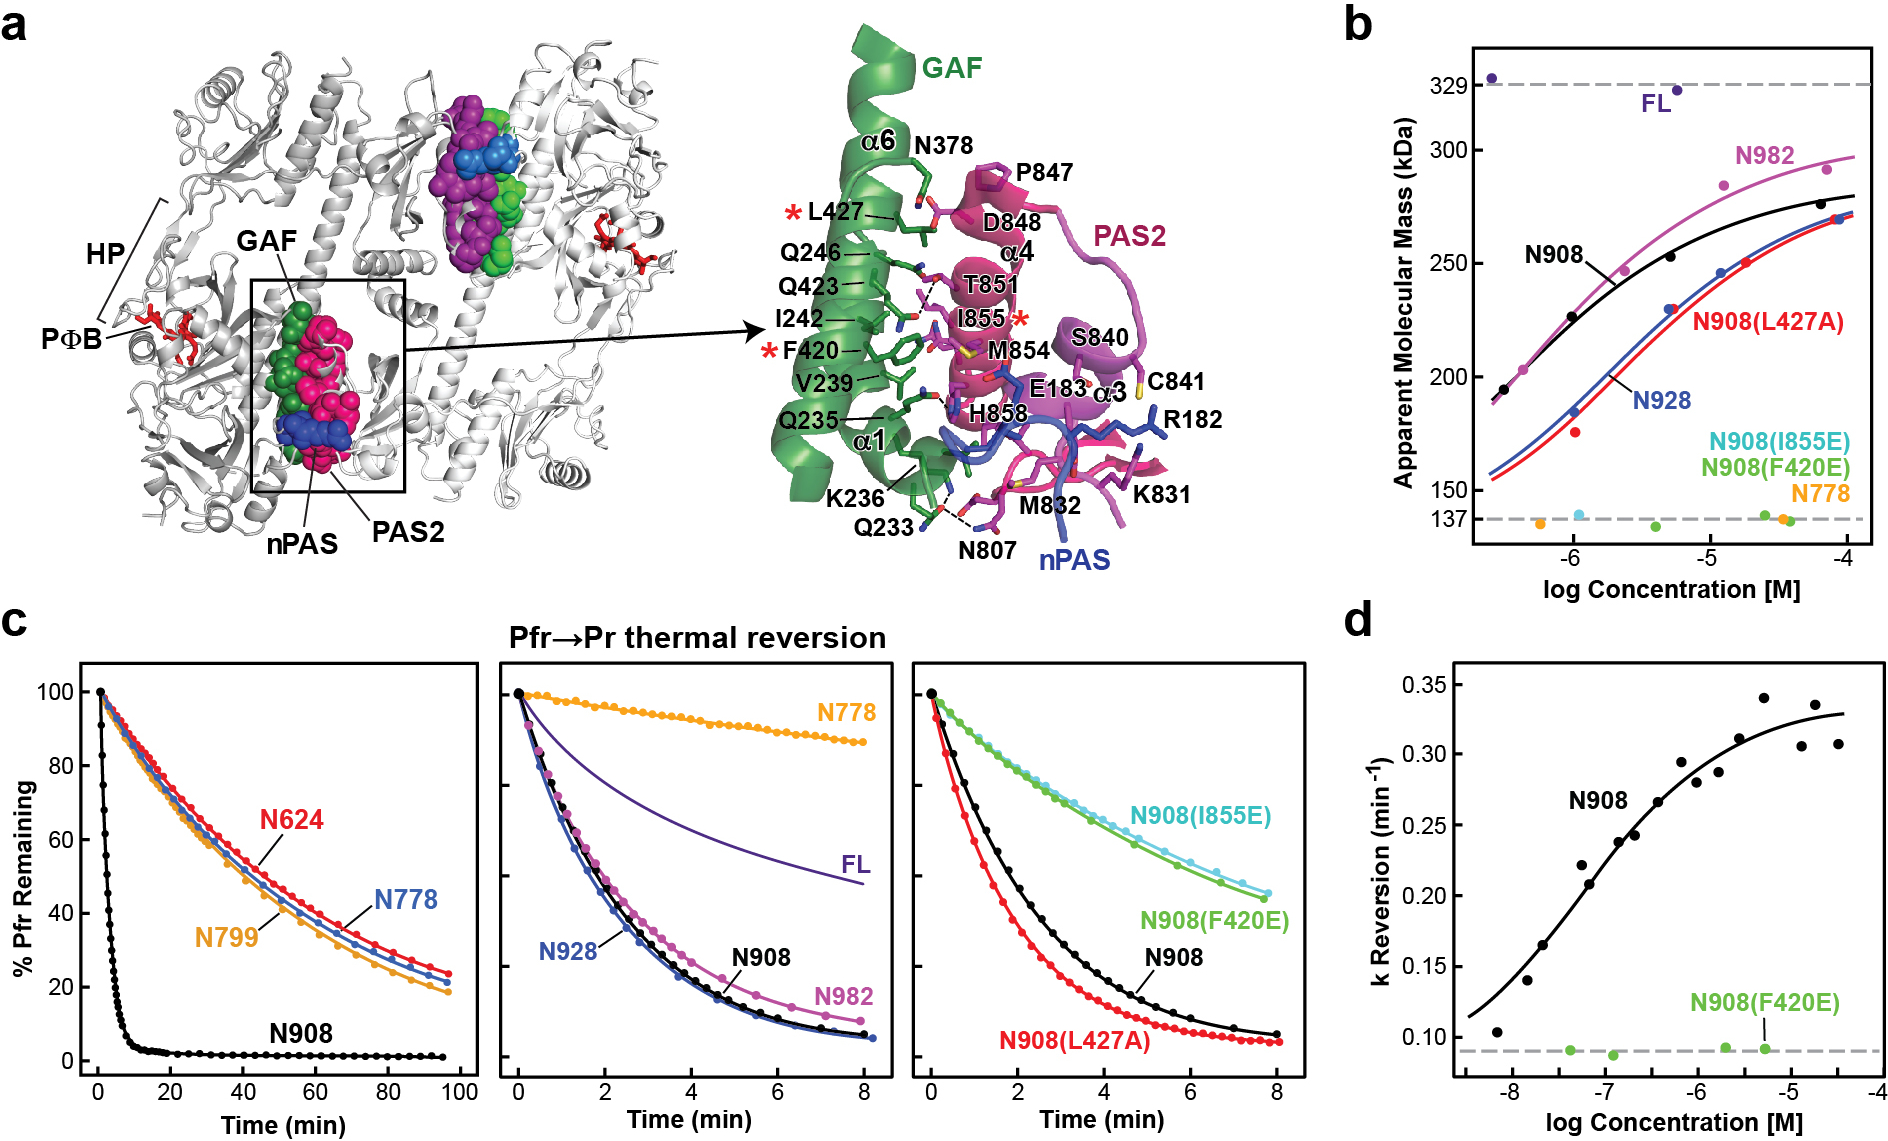
a, Overall (left) and close-up (right) cartoon views of the primarily hydrophobic interface between the PAS2 domain of one protomer and the GAF and nPAS domains of the second protomer. The red asterisks highlight residues examined by site-directed mutagenesis in b and c. b, SEC analysis of mutants in the PAS2–(nPAS-GAF) interface demonstrating its importance to dimer stability. The apparent molecular mass as a function of protein concentration for full-length PhyB, the N982, N928, N908 and N778 fragments, and informative mutations in the N908 fragment at the PAS2–(nPAS–GAF) interface (L427A, F420E and I855E; see asterisks in a) are shown. Data points represent individual measurements and the solid lines are the best fits to the data. c, Precluding dimer formation by mutation of the PAS2–(nPAS–GAF) contact slows Pfr to Pr thermal reversion. The PhyB mutants shown in b along with the N624 and N799 truncations were photoconverted to Pfr and allowed to revert back to Pr at 25 °C in the dark. Normalized data points and fit lines from reactions representative of three technical replicates are shown for reversion measurements at 725 nm (see Extended Data Table 3 for rate constant and s.d. values). The thermal reversion trace of full-length PhyB was as previously described8. d, Suppressing dimerization of N908 by lowering protein concentrations decreases the apparent rate constant (k) for thermal reversion at 21 °C. Individual data points are shown with the corresponding best fit line. Data from the monomeric N908(F420E) mutant are included for comparison. The exact location of the mutations, SDS–PAGE analysis, and Pr and Pfr absorption spectra of the mutant biliproteins are shown in Extended Data Figs. 6 and 8.
Fig. 4 |. Interactions between the modulator loop and the PAS2 and PHY domains within each protomer stabilize PhyB dimerization but destabilize Pfr.
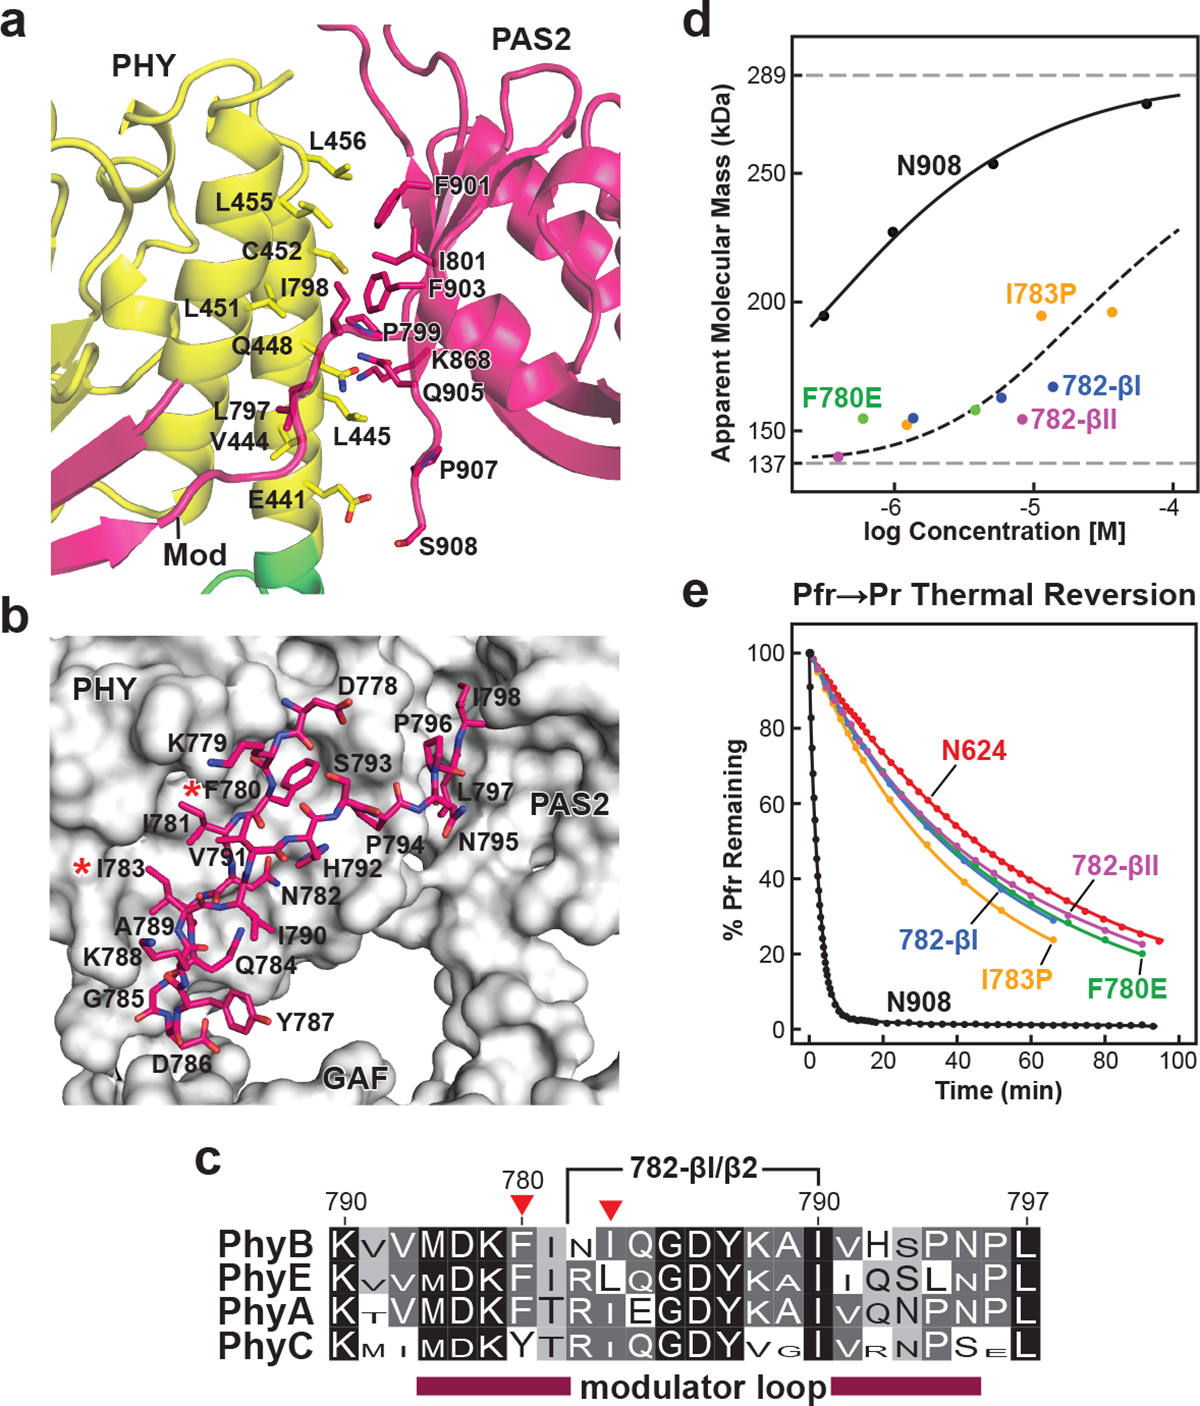
a, Cartoon view of the intraprotomer hydrophobic interface between the PHY and PAS2 domains. Interface residues are shown as sticks and are labelled. b, Close-up stick view of the modulator loop together with a grey surface view of the GAF, PHY and PAS2 domains of its protomer. The red asterisks highlight the point mutations tested in d and e. c, Amino acid sequence conservation of the modulator loop among angiosperm Phy photoreceptors. Identical and similar amino acids are shown in black and grey boxes, respectively, the font height of which is proportional to its percentage identity within each subfamily. The red arrowheads locate Phe780 and Ile783. The region replaced in the 782-β1 and 782-β2 turn mutants is indicated. d, SEC analysis of modulator loop mutants in the N908 polypeptide as a function of protein concentration, demonstrating the importance of the feature to PhyB dimer stability. The modulator loop was shortened by replacing residues 782–790 (NIQGDYKAI) with type I (NPDG) and type II β turns (NPGR). Individual data points are shown with the best fit line. The dashed grey lines show the calculated molecular mass of the N908 fragment at low and high protein concentrations; the dashed black line collectively shows the trend for all modulator mutants. e, Weakening the modulator loop–PHY contact slows Pfr to Pr thermal reversion. Preparations described in d were photoconverted to Pfr and allowed to revert back to Pr in darkness at 25 °C. The N624 truncation was included for comparison. Normalized data points and fit lines from reactions representative of three technical replicates are shown for reversion measurements at 725 nm (see Extended Data Table 3 for rate constant and s.d. values). The exact location of the mutations, SDS–PAGE analysis, and Pr and Pfr absorption spectra of the mutant biliproteins are shown in Extended Data Figs. 6 and 8.
Predicting that the interprotomer PAS2–(nPAS–GAF) and intraprotomer modulator–PHY connections contribute to dimerization beyond that provided by the paired HKRDs31, we examined dimer assembly using size-exclusion chromatography (SEC) analysis of a collection of photochemically-active PhyB variants, sequentially removing the CA (N982), DHp (N928), cruciate (N908), and modulator loop and PAS2 (N778) regions (Fig. 3b and Extended Data Fig. 8). Whereas full-length PhyB is an obligate dimer31 (Fig. 3b), the N778 fragment was monomeric regardless of protein concentration, therefore locating the critical dimerization site(s) within the PAS2 and HKRD regions (Fig. 3b). The N908 and N982 fragments did not form obligate dimers but self-associated with similar moderate affinities, therefore confirming that the PSM–PAS2 and HKRD interfaces both contribute to dimerization. The HK bidomains of prokaryotic transmitter kinases assemble by two different mechanisms, one through which the CA domain makes little to no contact with the opposing protomer, and a second through which the CA domain interacts with both DHps via helix α1 of the opposing protomer and helix α2 of its own protomer37,43. PhyB does the latter using an extensive interprotomer interface contributed by 48 residues within helices α1, α2 and α4 of the CA domain and helix α1 of the opposing DHp, which probably drives strong self-assembly (Extended Data Fig. 7a–c).
We found that the PAS2–(nPAS–GAF) interprotomer interface also contributes to dimer stability by examining mutations designed to compromise key contact points within the moderately dimeric N908 truncation31 (Fig. 3a). Notably, the single antagonistic F420E and I855E substitutions eliminated dimerization, whereas the less intrusive L427A substitution reduced self-assembly (Fig. 3b). We also examined the importance of the modulator–PHY interface by introducing F780E and I783P replacements into N908 that would disrupt a hydrophobic contact and assembly of the modulator–PHY domain β-sheet, respectively, or by shortening the modulator loop with premature type-I and type-II β-turns (Fig. 4c). Each of these modulator–PHY interface mutants strongly impaired dimerization even at high protein concentrations despite not contacting the opposing protomer (Fig. 4d). Together, we conclude that PhyB dimerization involves a host of unexpected interfaces beyond those provided by HKRDs.
Dimerization affects thermal reversion
As full-length PhyA and PhyB have much faster Pfr to Pr thermal reversion compared with their respective PSMs8,31, we examined whether dimerization through these newfound interfaces in PhyB influences thermal reversion and therefore retention of the active Pfr state. Whereas the constitutively dimeric full-length chromoprotein displayed moderate reversion rates, the N928 and N908 fragments missing the CA and CA + DHp domains, respectively, were very fast, revealing that the CA domains help to stabilize Pfr despite their distance from the bilins (Fig. 3c). Notably, thermal reversion of further truncations eliminating the PAS2–nPAS–GAF and modulator–PHY interfaces (N624 and N778) were substantially slower, demonstrating that the PAS2 and modulator loop regions destabilize Pfr while stabilizing dimerization. An analysis of site-directed mutants that affect the modulator loop and PAS2 interfaces in the N908 truncation revealed a similar trend. The N908(L427A) mutation, which retained dimerization, also retained rapid thermal reversion, whereas the N908(F420E) and N908(I855E) mutants that precluded dimerization reverted more slowly (Fig. 3c). The modulator loop mutants had an even greater impact and suppressed thermal reversion of the N908 fragment to rival the slow rates of the PSM and N778 fragments (Fig. 4e).
For a direct link between thermal reversion and dimerization, we measured the reversion rates for the N908 fragment over a 10,000-fold range of protein concentrations that varied the dimer–monomer equilibrium. As shown in Fig. 3d, when tested at high concentrations to encourage dimerization, N908 reverted rapidly, whereas increasing dilutions that progressively favoured monomerization slowed reversion, eventually approaching the low rates observed for the constitutively monomeric N908(F420E) mutant that disrupts the PAS2–(nPAS–GAF) interface. From these data, a dissociation constant (Kd) of ~26 nM was calculated for the N908 dimer.
Arabidopsis PhyB is probably not a protein kinase
A long-standing hypothesis based on amino acid sequence similarity to bacterial transmitter HKs is that plant Phy photoreceptors are photoregulated protein kinases23, with a number of studies supporting or discounting this possibility21,22,29,30,44. Our 3D view of the PhyB HKRD now offers an additional perspective. When overlaid with the analogous HK regions from bona fide transmitter kinases34–37, strong structural similarity was evident for PhyB despite the weak sequence conservation, therefore confirming the predicted HK ancestry of plant Phy photoreceptors (Extended Data Fig. 7a). The DHp domains in PhyB generated the requisite four-helix bundle but, as previously noted21,22, it replaced the solvent-accessible histidine phosphodonor with a glutamine (Extended Data Figs. 3e, 7c, d), therefore negating a canonical two-component phosphotransfer. Similarly, the CA domains in PhyB superposed well with those from bacterial transmitter kinases (1.23–3.36 Å r.m.s.d.) (Extended Data Fig. 7c, e). However, close packing of helices α3 and α4 occluded the predicted ATP-binding pocket, which, together with the absence of key nucleotide-coordinating residues in PhyB (and other land plant Phy photoreceptors), suggested that this region binds poorly to ATP, if at all (Extended Data Figs. 3g, 6, 7f). Ab initio computational docking of ADP to PhyB using Rosetta also yielded untenable arrangements, even when the putative ATP-binding pocket was modelled in silico to resemble the ADP-bound conformation of bona fide transmitter HKs36 (Extended Data Fig. 7f, g).
To directly examine the potential kinase activity of PhyB, we assayed for autophosphotransferase activity in comparison to a functional Phy HK from Pseudomonas syringae (PsBphP)17. Whereas PsBphP readily directed phosphotransfer in a Pfr-dependent manner, no activity was observed for Arabidopsis PhyB when testing the full-length dimer as well as partial fragments missing the CA and DHp regions (N982) or encompassing just the PSM (N624) (Extended Data Fig. 7h, i). Collectively, our analyses raise doubts that plant Phy photoreceptors are protein kinases and suggest that the phosphotransferase activities that were previously observed for purified preparations21,44 reflect vestiges of their HK heritage.
Implications for Phy evolution and signalling
In contrast to prokaryotic Phy photoreceptors described to date40–42, our 3D model of PhyB reveals a complex topology, which we propose is critical to dimer integrity and signalling potential. Although the PSM of PhyB is structurally comparable to its bacterial progenitors with its knot, helical spine, hairpin and buried bilin features, PhyB innovated several new aspects brought about by the two PAS domains and the modulator loop separating the PSM and HKRD. Both the PAS2 domain and the modulator loop strengthen self-assembly through inter- and intramolecular contacts, respectively, while the positioning of the PAS2 and DHp cruciates enable a seamless transition from the head-to-tail association of the PSM–PAS2 platform to head-to-head association of the HKRDs. When these features are considered together with the intramolecular knot and hairpin, a strikingly high level of interconnectivity becomes apparent within PhyB, with sequence homology suggesting that it pervades all plant Phy photoreceptors. Our hypothesis is that these features help to stabilize the two protomers, both individually and after dimerization, to help to focus the conformational changes that occur during Pr–Pfr interconversion towards a productive signalling outcome.
Surprisingly, platform dimerization, the modulator–PHY interface and the HKRD each control Pfr memory by influencing thermal reversion. As reversion differs markedly among the plant Phy isoforms8,45, its adjustment through modification of the dimer interface might be fundamental to the varied photosensitivities among the isoforms—such as PhyA, which detects low-fluence light environments with high sensitivity, versus PhyB, which effectively senses full sun and photoperiod1,8,19—and to the unique ability of PhyB to sense temperature6–8. Although the function(s) of the mobile PAS1 domain are currently unclear, we expect that it also contributes to plant Phy signalling possibly by helping the PSM–PAS2 platform to accommodate Phy-binding partners.
The asymmetric architecture of the PhyB dimer probably also has implications for plant Phy signalling in relation to Pfr–Pfr homodimers versus Pr–Pfr heterodimers. For example, it has been proposed that PhyB is biologically active only as the Pfr homodimer, and inactive as the heterodimer, whereas the reverse might be true for PhyA45,46. As a consequence, PhyB would require intense light for full activation, whereas PhyA would be more effective in low-light environments in which the peak populations of heterodimers are expected. Such distinctions could be amplified by the innate structural asymmetry of the PhyB dimer, with the lean of the HKRD to one side of PSM–PAS2 platform generating two chromophore environments, one of which might be more efficient in Pr to Pfr photoconversion, and/or more resistant to Pfr to Pr thermal reversion (Figs. 1e, 2 and Supplementary Video 2). In support, previous kinetics studies of purified PhyB detected two rate constants for both photoconversion and thermal reversion that could reflect this asymmetry8. By contrast, it is possible that PhyB dimers become more symmetric after photoconversion by discouraging the tilted-platform–HKRDs interaction with concomitant ramifications on Pr–Pfr interconversion and/or signalling potential.
With respect to Phy evolution, the unexpected quaternary arrangement of the PhyB dimer should further guide phylogenetic understandings of plant Phy photoreceptors19,47. Assuming that the introduction of the internal PAS repeats was pivotal, glaucophyte algae probably contained the direct ancestors as they were the first eukaryotes to display an internal PAS domain preceding a canonical transmitter HK domain, which was followed by prasinophyte Phy photoreceptors that contained tandem PAS domains. The modulator loop seems to be unique to charophytes and land plants, as is a compromised HKRD without the phosphoacceptor histidine, suggesting that plant Phy photoreceptors then radiated monophyletically from these algal relatives after evolving a non-kinase signalling mechanism that leveraged their convoluted architecture for light-regulated PIF binding.
A compelling aspect of our PhyB structure is the sizable platform generated by the paired PSM–PAS2 regions that provides a plausible mechanism for plant Phy signalling involving reversible interactions with various binding partners1. In particular, previous studies showed that PIFs bind to monomeric PSM fragments of PhyB in a reversible manner25,27,28, with the binding site tentatively mapped to a cleft at the junction of the PAS and GAF domains48. As this cleft sits at opposite poles of the platform, it is easy to imagine that dimeric PIFs bind diagonally across this surface, with their affinity sensitive to the hairpin-driven contortions expected in each PSM during photoconversion12,13. We further speculate that PIF binding to this platform stimulates its phosphorylation, not by an activity intrinsic to PhyB given its diverged HKRD sequence and distance from the PIF-binding site, but by an associated kinase such as the PPK photoregulatory protein kinases shown to phosphorylate PIFs in a Phy-dependent manner49. This modification then triggers the degradation of both PhyB and PIFs. Clearly, this Arabidopsis PhyB model now provides an excellent entry point to appreciate Pr–Pfr interconversion of plant Phy photoreceptors, how they interact with their downstream partners, and how PhyB in particular might be optimized for PIF-driven optogenetic applications25–28.
Online content
Any methods, additional references, Nature Research reporting summaries, source data, extended data, supplementary information, acknowledgements, peer review information; details of author contributions and competing interests; and statements of data and code availability are available at https://doi.org/10.1038/s41586-022-04529-z.
Methods
Methods and the associated references are provided in the Supplementary Information. Statistical methods and sample sizes are included in the figure legends. No blinding or randomization was needed.
Extended Data
Extended Data Fig. 1 |. Workflow and resolution estimation for the cryo-EM map of Arabidopsis PhyB.
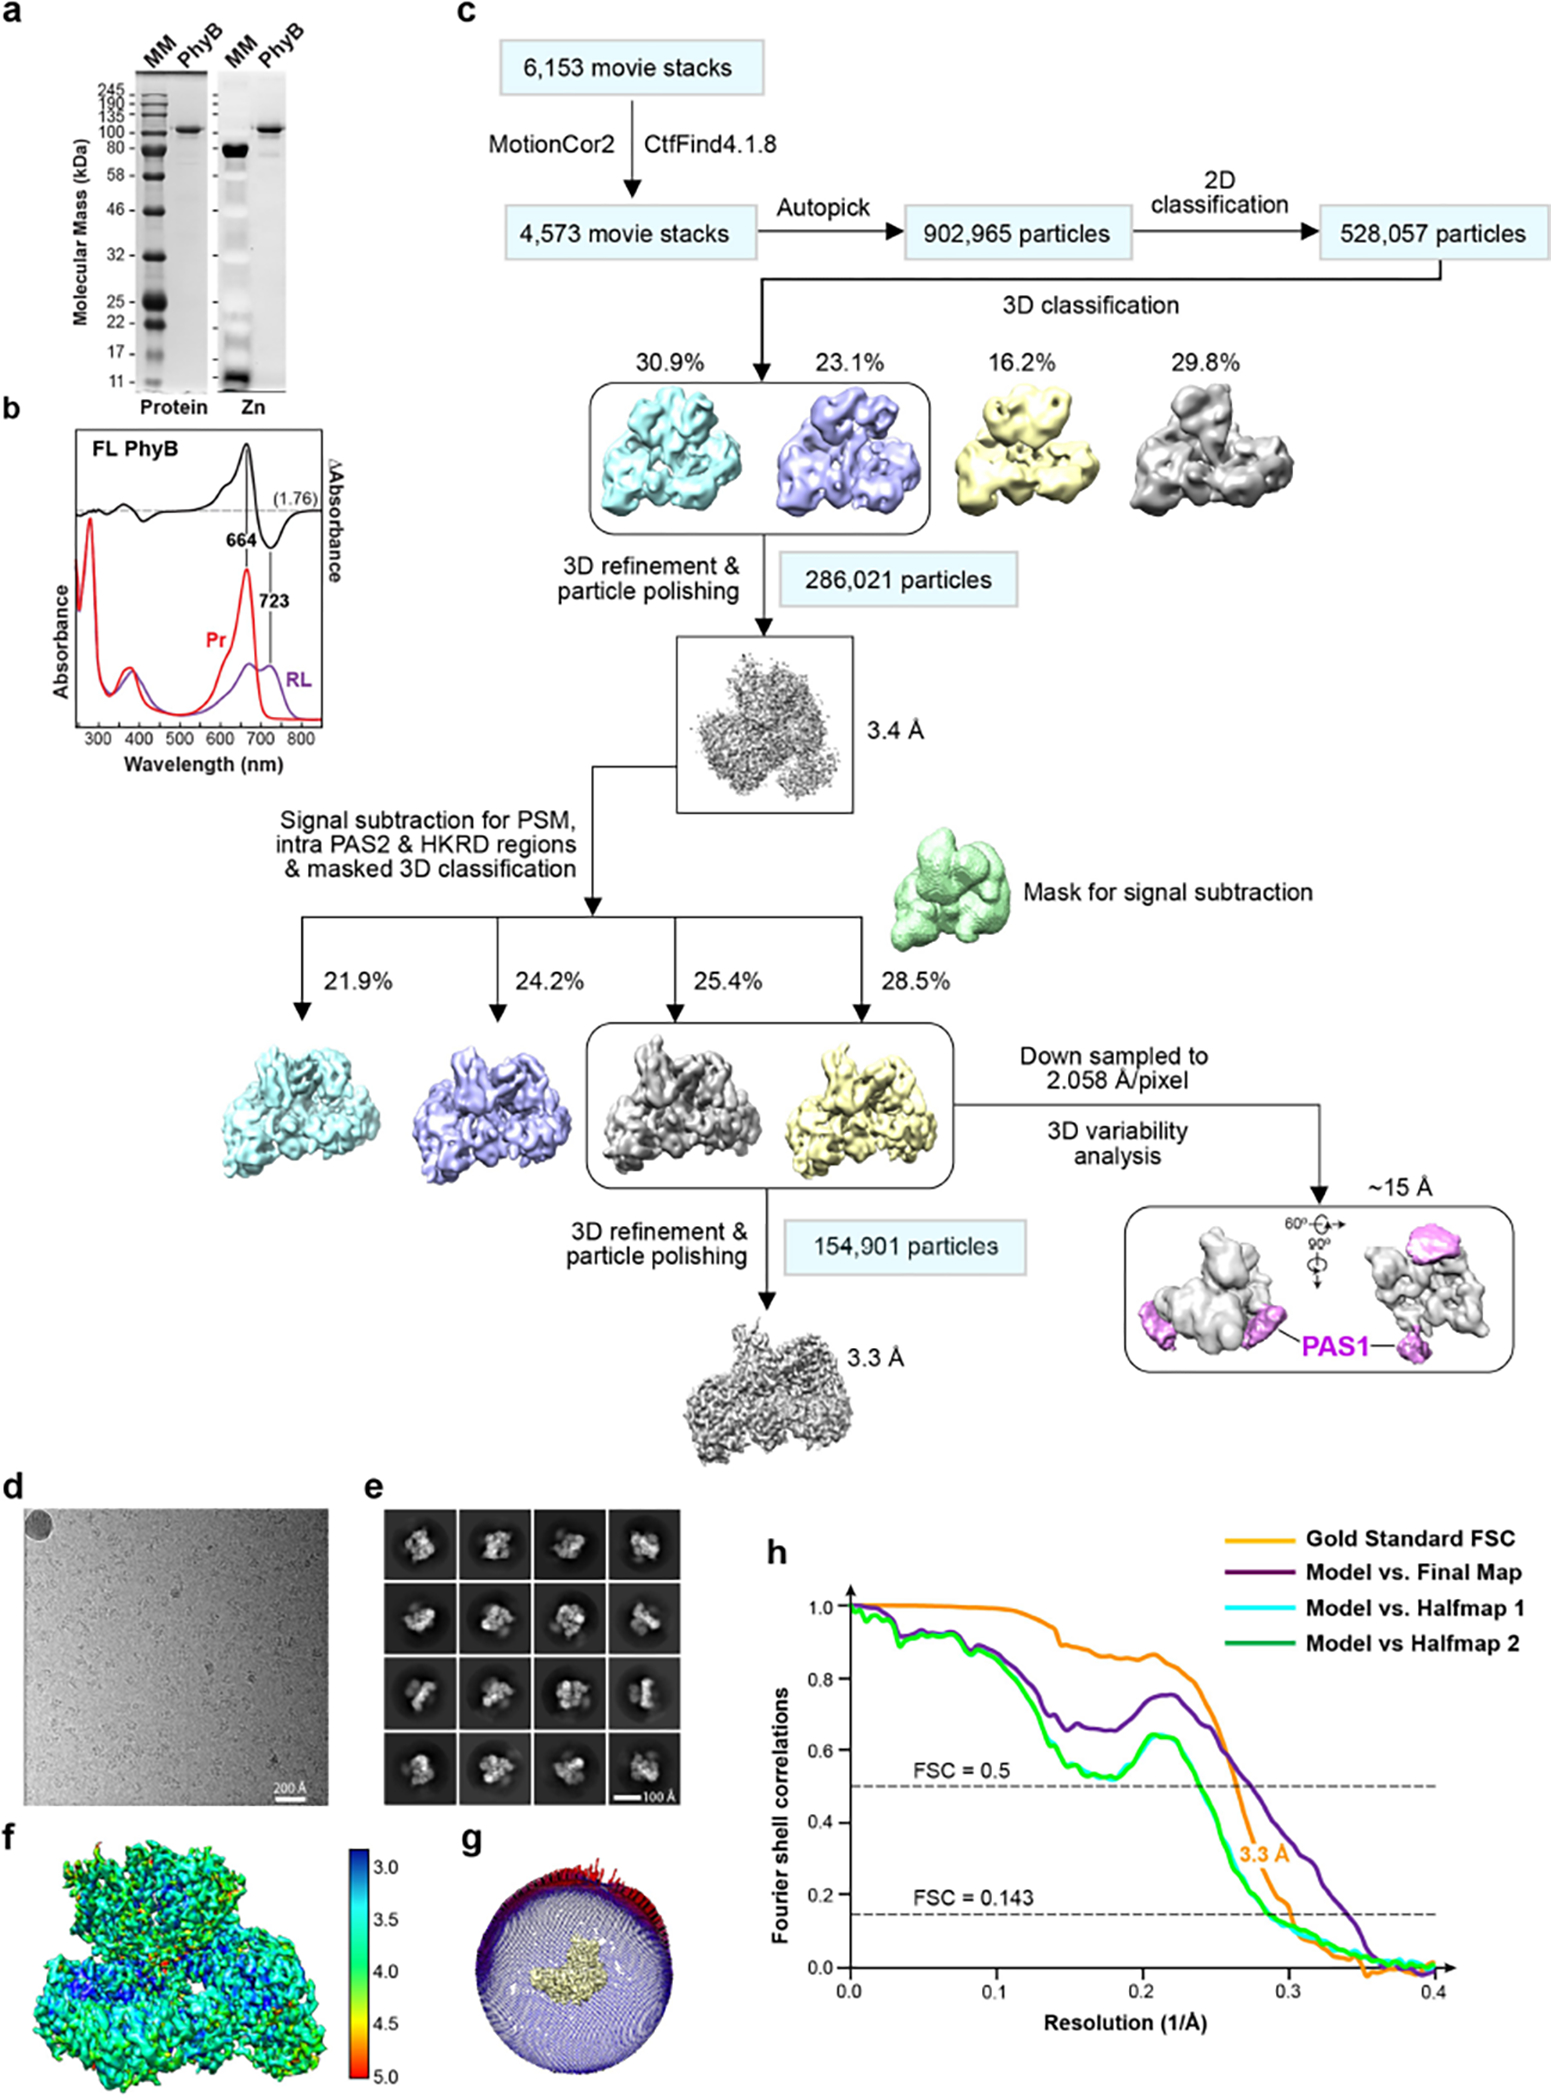
a, SDS-PAGE analysis of the recombinant full-length biliprotein. Gels were either stained for protein with Coomassie blue (left) or assayed for bound PΦB by zinc-induced fluorescence (right). MM, molecular mass standards. Samples were indistinguishable to those described by Burgie et al.2 b, UV-vis absorbance spectra of PhyB. The spectra were collected from dark-adapted samples (Pr) or after saturating irradiation with 660-nm red light (RL, mostly Pfr). Absorption maxima were determined from the difference spectrum shown at 70% amplitude. The spectral change ratio (SCR)8 at 723 nm is indicated in parenthesis. c, Work flow for data processing of the cryo-EM images of the PhyB dimer. In the first refined overall map at 3.4-Å resolution, all PhyB domains were present but the regions encompassing the PAS1 domain were poorly resolved. Focused refinement, excluding the PAS1 domains, led to the 3.3-Å final map (lower left panel). Lower right panel shows that the EM density of the flexible PAS1 domains (purple), which were captured at 15-Å resolution by 3D variability analysis of down-sampled particle images. d–h, Resolution estimation of the 3.3-Å 3D map. d, A representative cryo-EM micrograph sampled from 6,153 micrographs collected. e, Sampling of 2D class averages. f, Colored-coded local resolution of the 3D map. g, Eulerian angle distribution of raw particle images used in the final 3D reconstruction. h, Gold-standard Fourier shell correlation (FSC) and the validation of the atomic model by correlation curves comparing the model to the final and two half maps.
Extended Data Fig. 2 |. Superposition of the cryo-EM map densities of the PSM, PΦB, and the bilin-binding GAF domain pocket with the X-ray crystallographic model of the PSM.
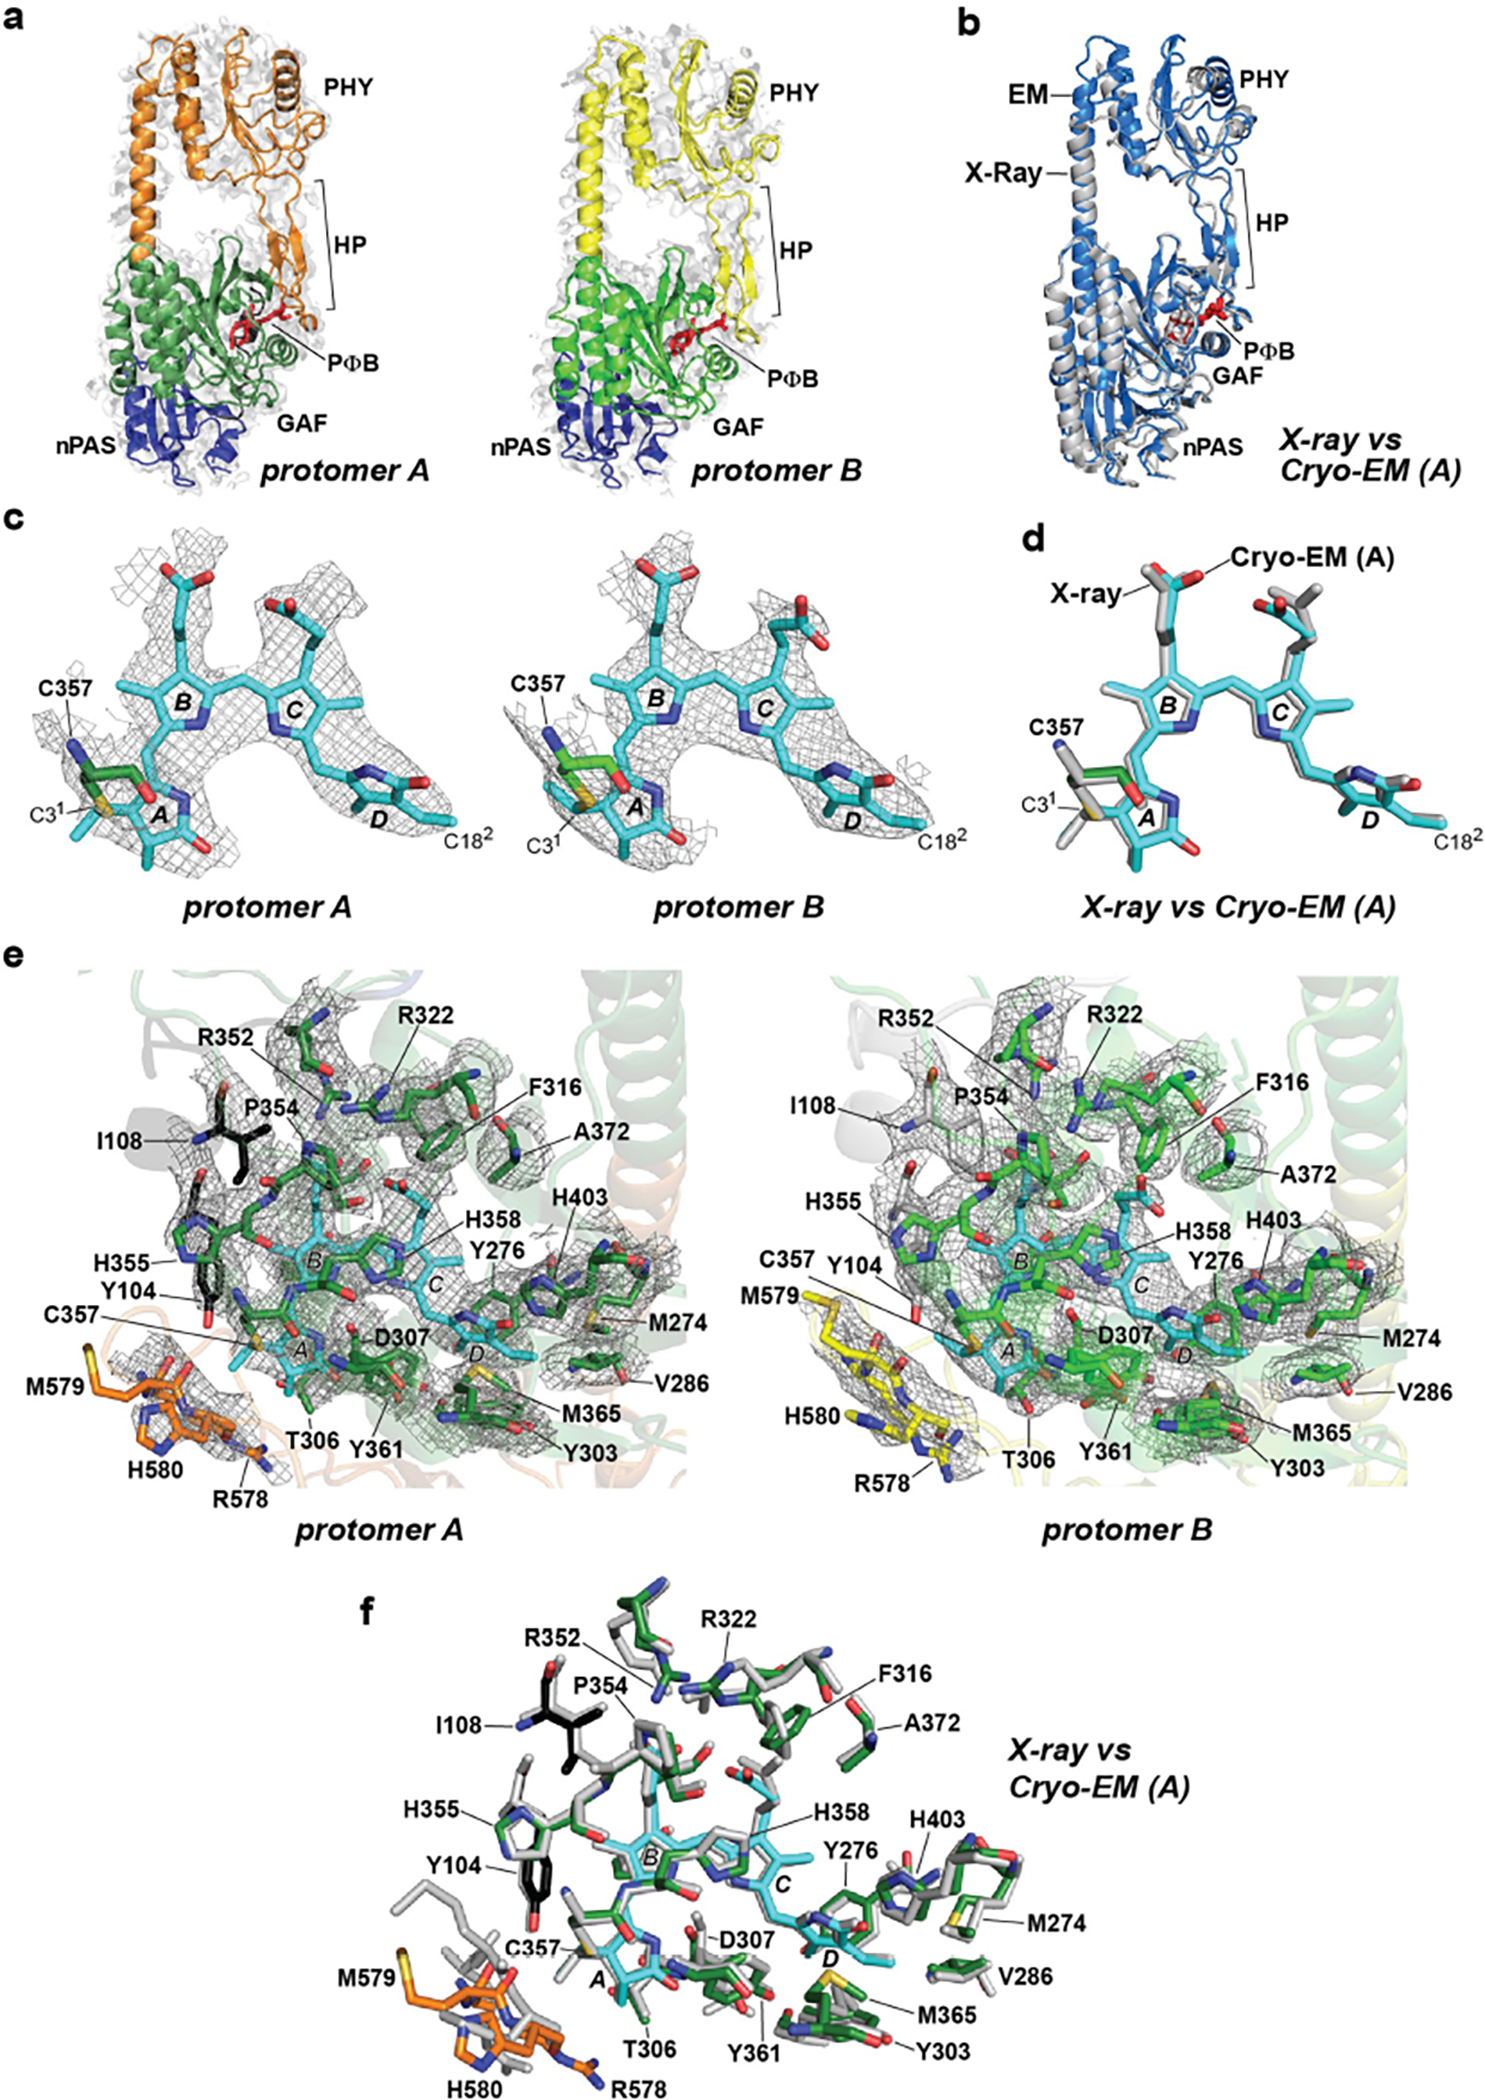
Motifs/residues are colored as in Fig. 1b. a, Fitting of the nPAS, GAF and PHY domains, and the hairpin (HP) motif within the EM map density (light grey surface) of protomer A and protomer B. PΦB is shown in red. b, Superposition of the PhyB PSM determined by cryo-EM of the full-length PhyB (protomer A; slate blue) and by X-ray crystallography of the PhyB PSM (grey; residues 90–624, PDB ID code, 4OUR32). c, PΦB conformations (in sticks) in protomers A and B modeled within the EM map density (grey mesh). The A-D pyrrole rings are labeled along with Cys357 that forms a thioether linkage to the C31 carbon of PΦB. The D ring C182 carbon is indicated. d, Superposition of the PΦB structures determined by cryo-EM of the full-length PhyB protomer A (colored) and by X-ray crystallography of the PhyB PSM (grey). e, The bilin-binding pockets of protomers A and B highlighting neighboring amino acids (sticks) and superposed in the EM map density (grey mesh). f, Superposition of the bilin-binding pocket determined from the cryo-EM structure of full-length PhyB protomer A with the X-ray crystallographic structure of the PhyB PSM.
Extended Data Fig. 3 |. Superposition of the cryo-EM map densities of various PhyB motifs with the cryo-EM model.
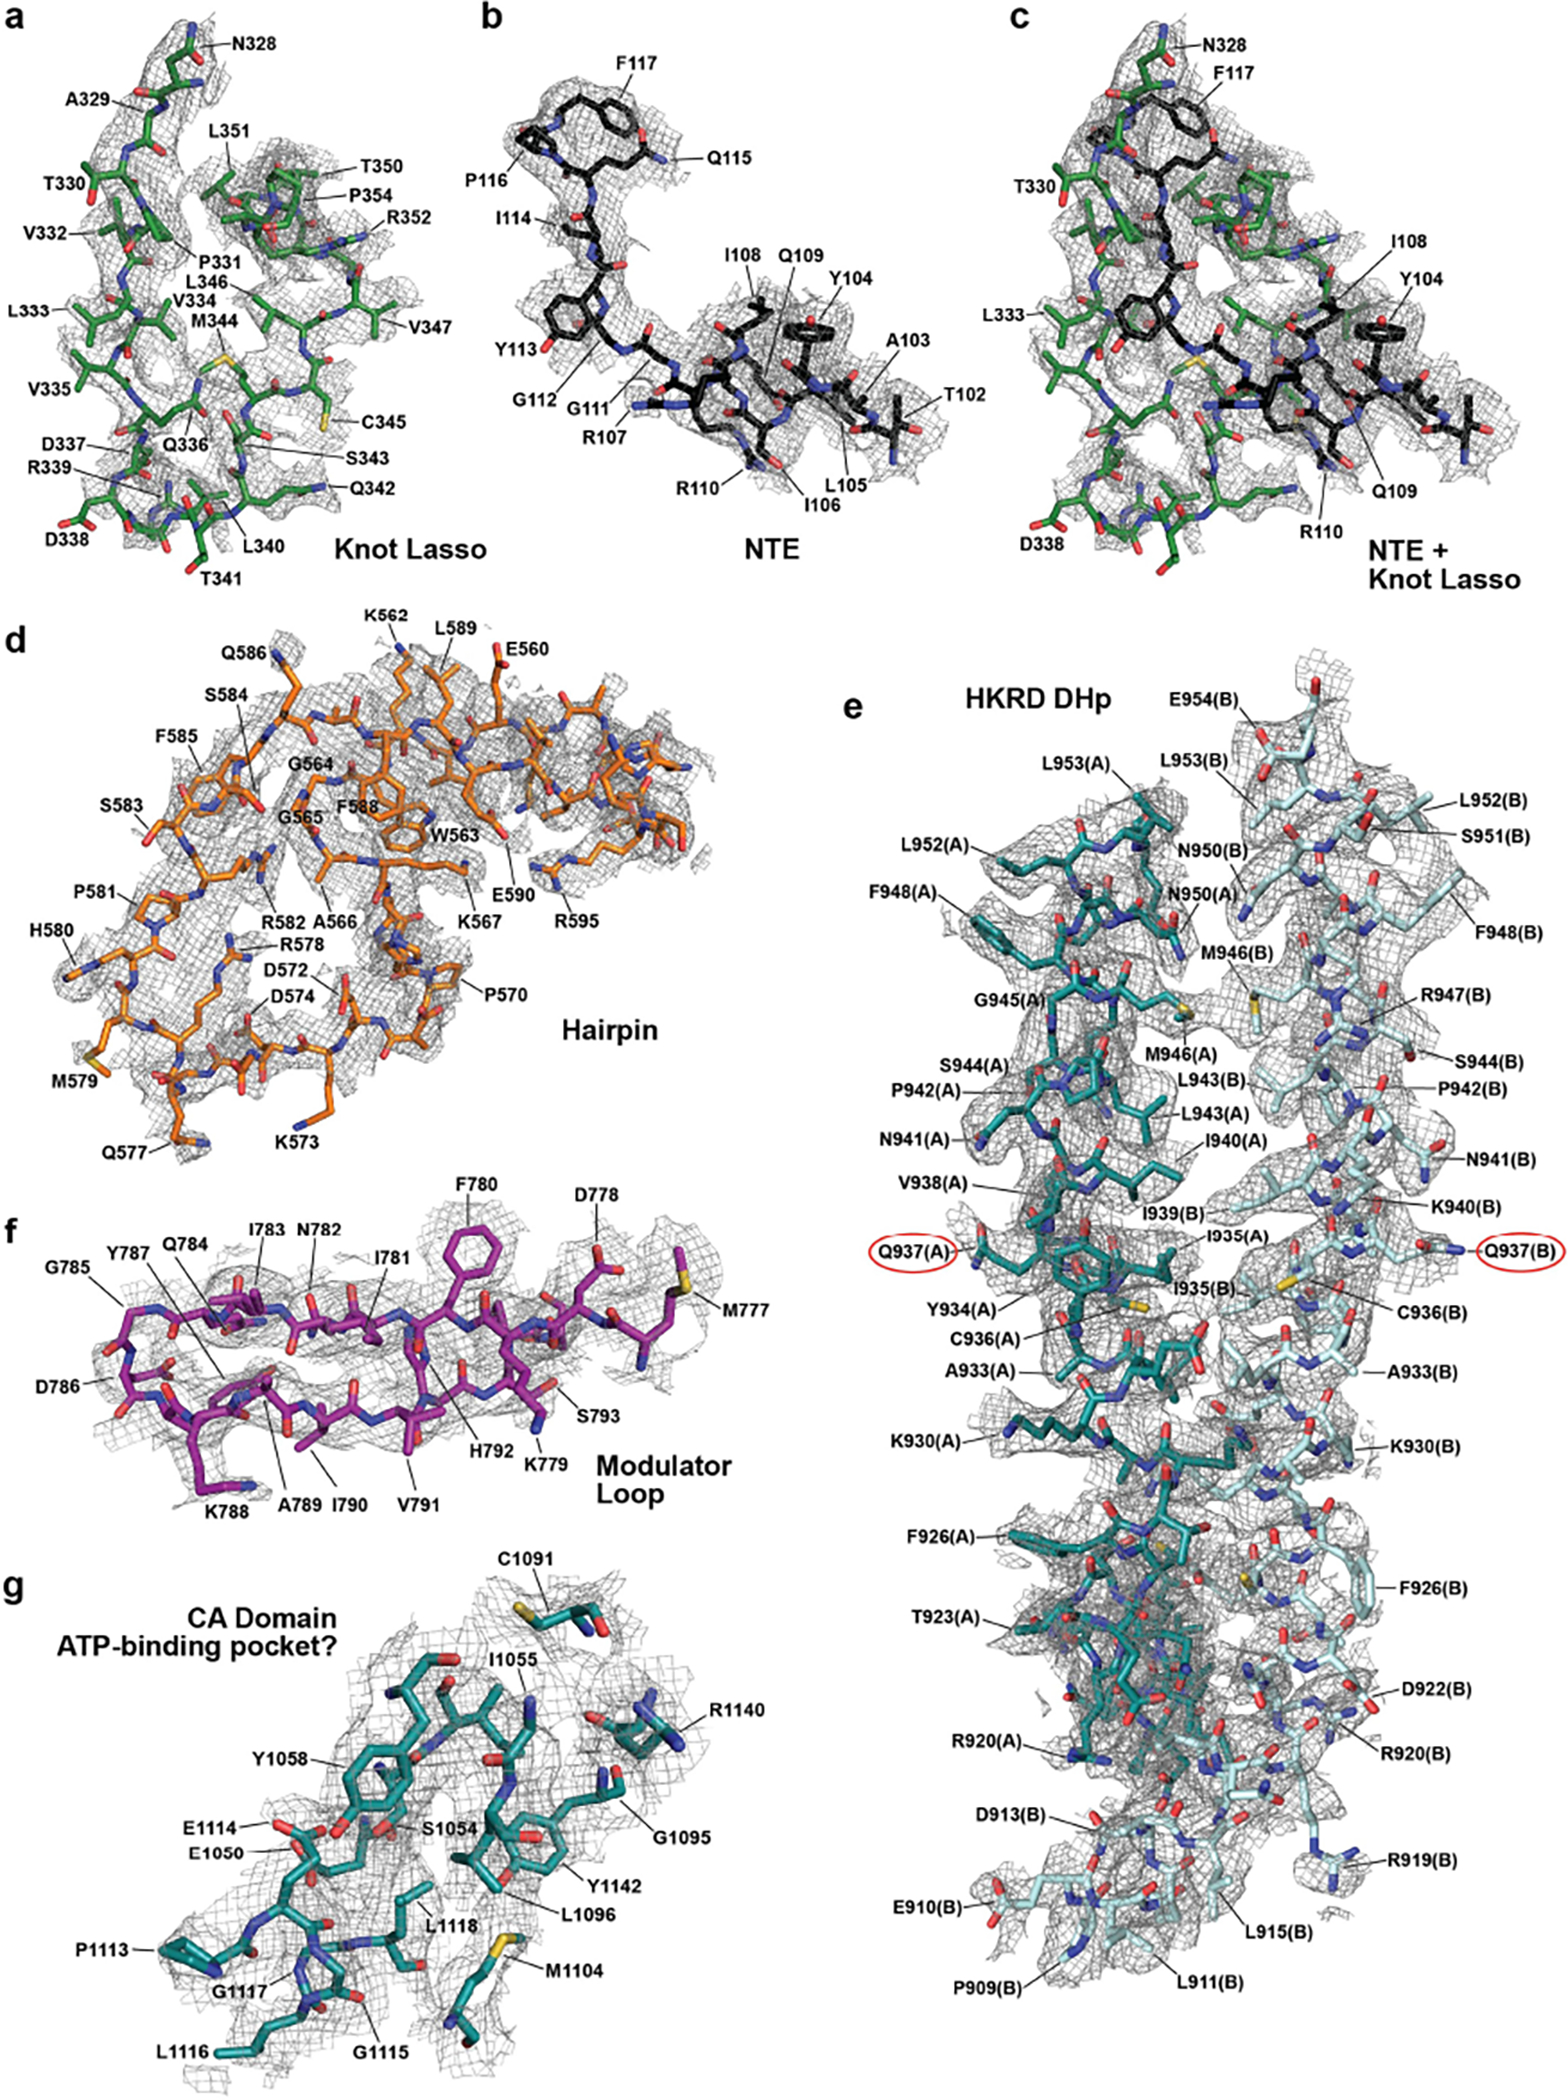
Shown in sticks are various amino acids modeled within the EM densities (grey mesh). Domains/residues are colored as in Fig. 1b. a–c, The NTE and knot lasso region of protomer A showing the knot lasso (a) and NTE separately (b), and combined (c). d, The hairpin loop extending from the PHY domain in protomer A. e, Portions of the DHp regions within the HKRD from protomers A and B. Gln937, which positionally corresponds to the conserved phosphoacceptor histidine found in prokaryotic transmitter histidine kinases, is circled in red. f, The modulator loop extending from between the PAS1 and PAS2 domains within protomer A. g, Residues within the CA domain of the HKRD in protomer A surrounding a possible ATP-binding pocket.
Extended Data Fig. 4 |. Topology of PhyB generated from the cryo-EM 3D model and structural predictions of the three PAS domains.
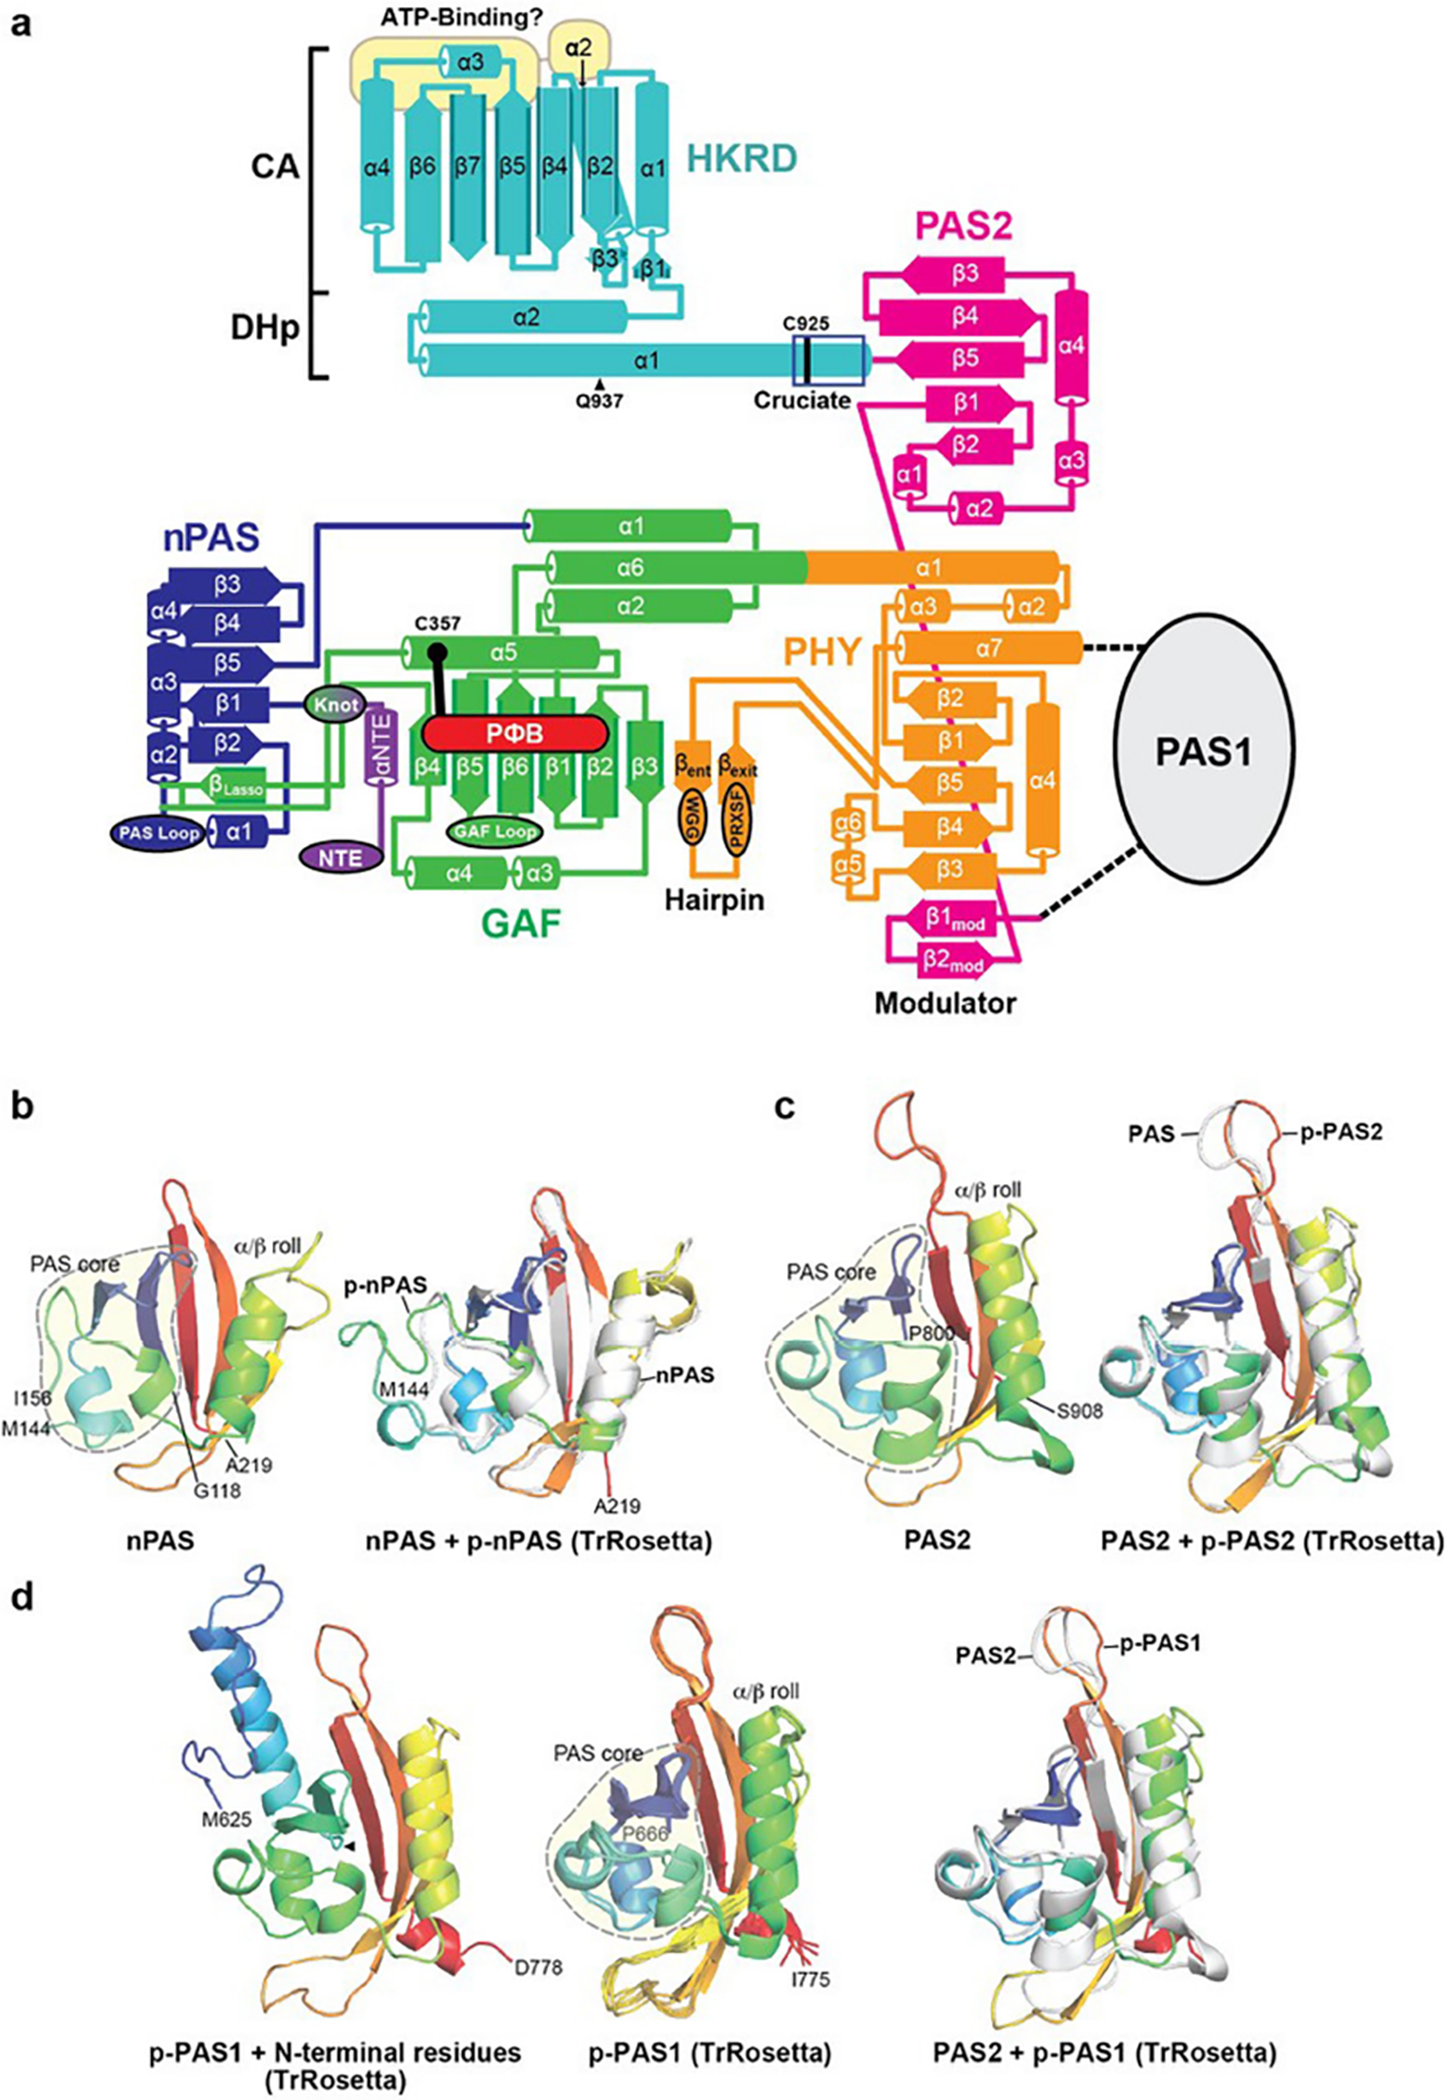
a, Topological schematic of PhyB. Shown are the NTE, nPAS, GAF, PHY and PAS2 domains, and the DHp and CA domains within the HKRD highlighting the positions, lengths, and contacts of the α-helices and β-strands, and the contacts for the knot lasso, hairpin, and modulator loop features. The position of PΦB within the GAF domain β-sheet is indicated. The entry and exit points of the poorly resolved PAS1 domain between the PHY and PAS2 domains are shown. The GAF and nPAS loops unique to plant Phys and the PHY domain hairpin residues (WGG and PRXSF) involved in a predicted β-strand to α-helical transformation during photoconversion are identified in the ellipsoids32,33. The predicted ATP-binding region is highlighted by the yellow ovals. The H1a cruciate region within the helix α1 of the DHp, which provides the head-to-tail to head-to-head crossover point with Cys925 at its center, is located by the dark blue box. Gln937 is the residue that replaces the phosphoacceptor histidine found in prokaryotic two-component HKs. Amino acid sequence conservation of each feature can be found in Extended Data Fig. 6. b–d, Structural predictions of the three PAS domains in PhyB using TrRosetta62. The PAS domain cores are circled by the dashed grey line, which is followed by an α/β roll64. Terminal amino acids are indicated. b and c, Superposition of 3D models of the nPAS and PAS2 domains determined by cryo-EM with those predicted (p) by TrRosetta. The cartoons on the left are the cryo-EM models and those on the right are superpositions of the models (grey) with those calculated (rainbow) (rmsd = 1.1 Å for nPAS and 1.0 Å for PAS2). d, Predicted models of the PAS1 region by TrRosetta. The left cartoon is a prediction for the PAS1 domain plus 31 additional N-terminal residues not found in the cryo-EM model. The middle cartoon includes the top five predictions for the PAS1 domain alone. The right cartoon is a superposition of the predicted PAS1 domain with the PAS2 cryo-EM model (rmsd = 1.3 Å).
Extended Data Fig. 5 |. Limited protease sensitivity is consistent with the cryo-EM model of PhyB.
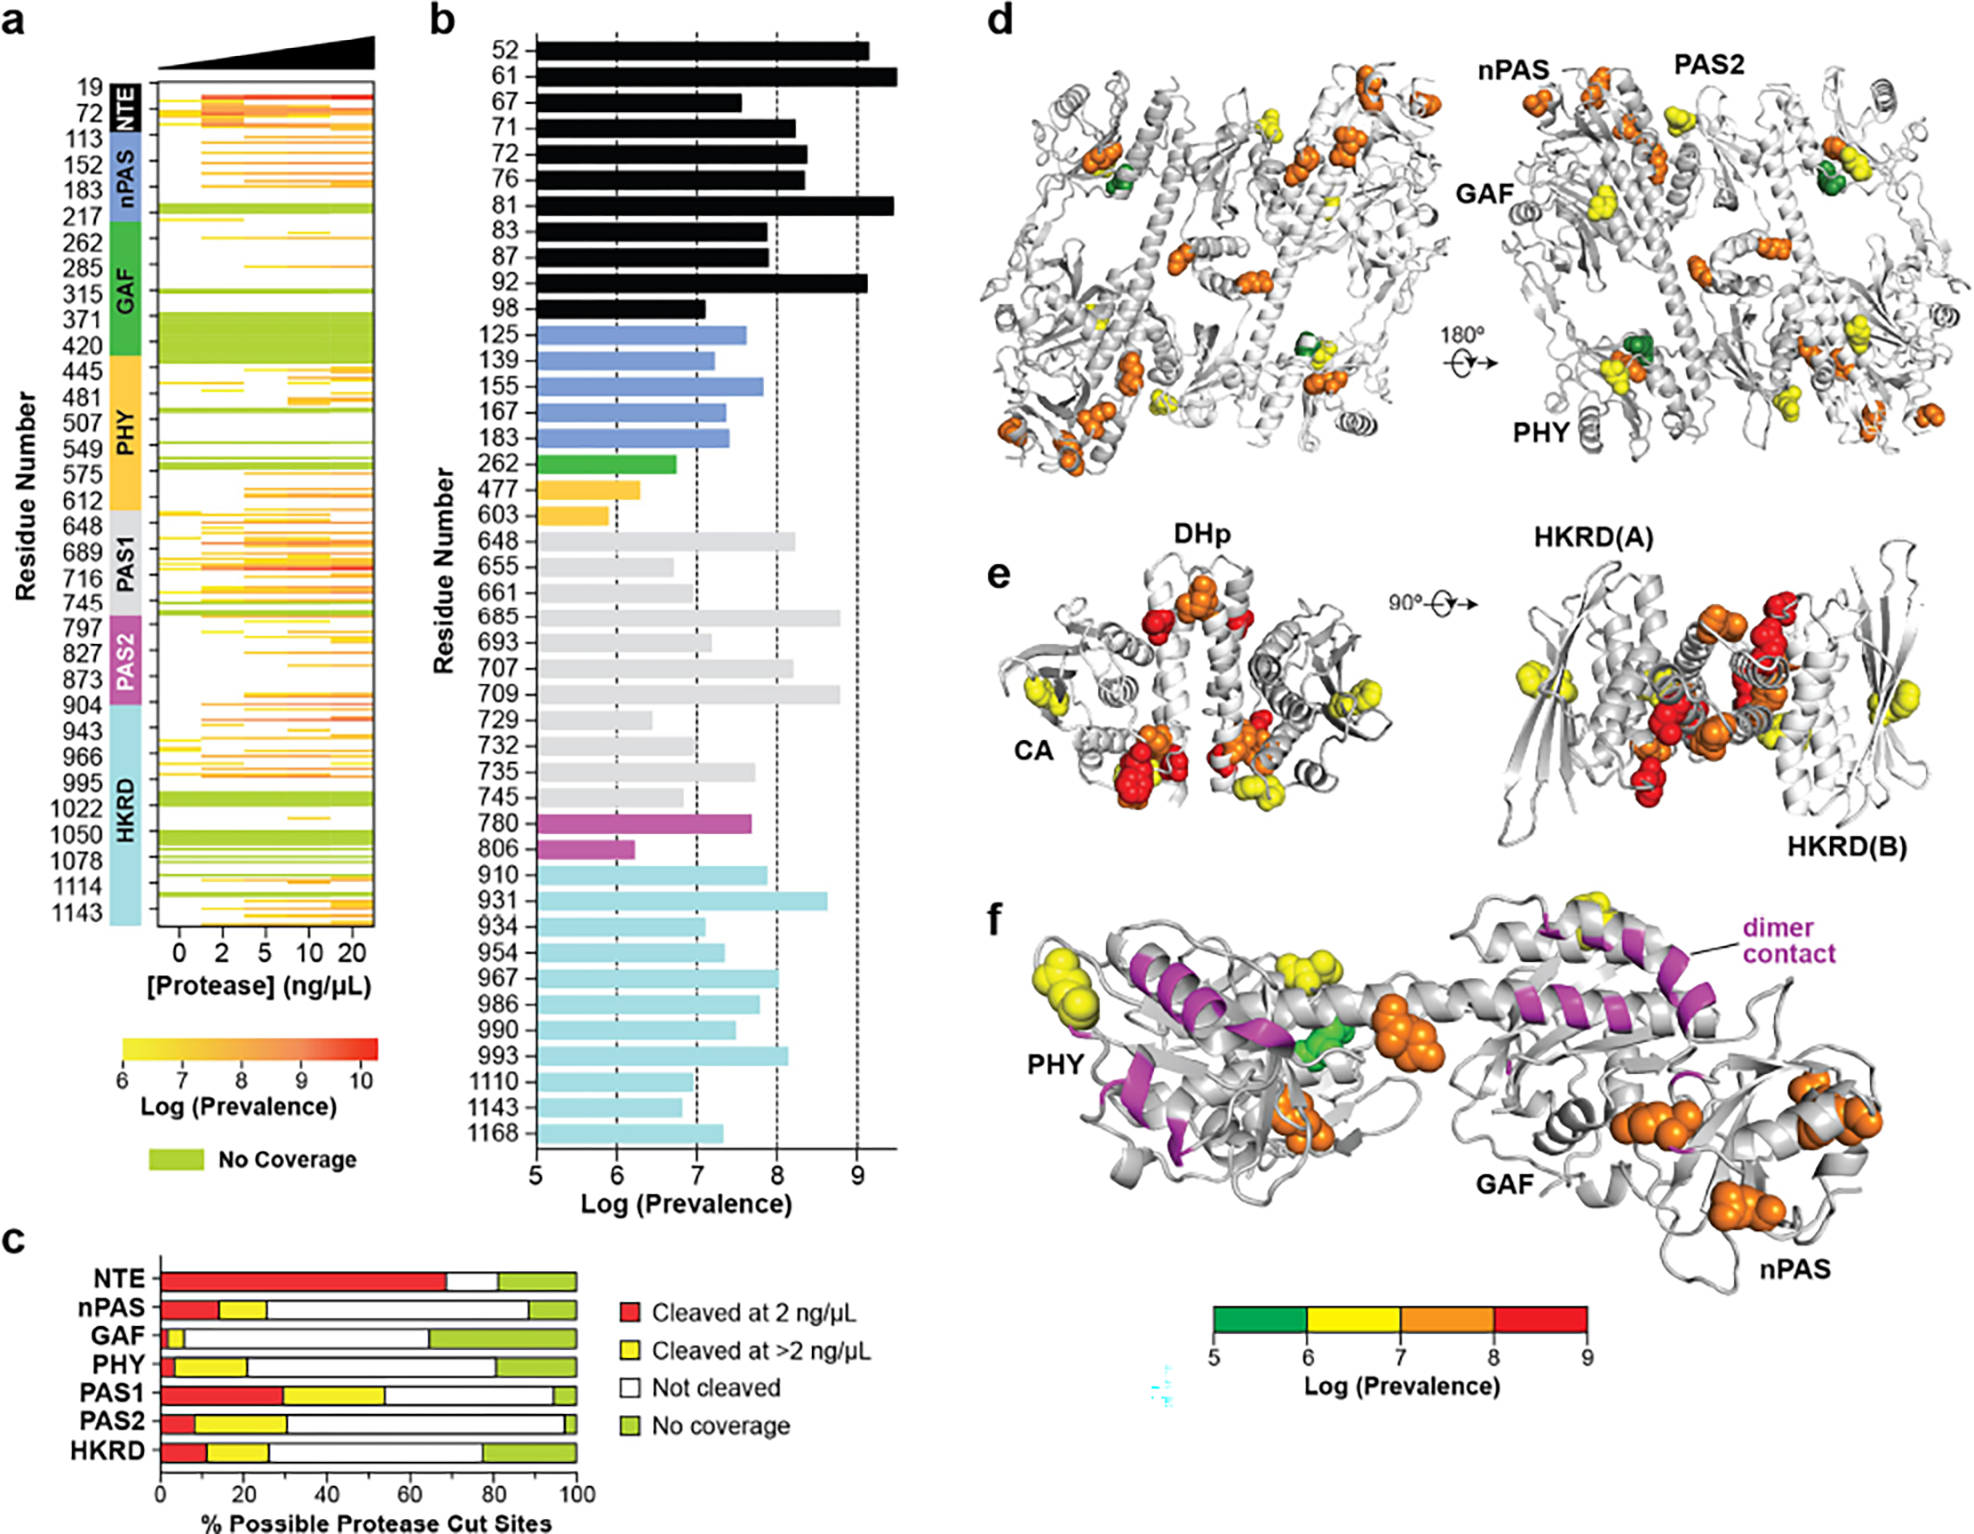
a, Concentration-dependent cleavage of PhyB by chymotrypsin and GluC. Purified full-length PhyB was incubated for 15 min with increasing amounts of each protease and then subjected to complete digestion with trypsin followed by tandem MS identification of peptides generated by each protease. Peptides that ended in chymotrypsin or GluC cut sites were quantified from the MS1 scans. Each row represents a potential cleavage site; white bars indicate no cleavage whereas green boxes represent regions without detectable peptides. All MS data represent the means of four technical replicates. The digestions were aligned with the domain architecture of PhyB (see Fig. 1a). b, Relative susceptibility to proteolysis for all cleaved sites at 2 ng/μL chymotrypsin or GluC. Bars are colored by domain as in (a). c, Proportion of cleavage sites within each domain that were either susceptible to high or low concentrations of both proteases, not cleaved, or not detected. d–f, 3D views of the protease-sensitive sites in PhyB highlighting: (d) the NTE-nPAS-GAF-PHY-PAS2, (e) HKRD, and (f) PSM regions. The PhyB structure is shown in cartoon while the cleavage sites are highlighted in spheres and color-coded based on protease sensitivity. Protomers A and B are presented in grey and white, respectively. Residues involved in dimerization are highlighted in magenta in (f).
Extended Data Fig. 6 |. Amino acid sequence alignment of the PhyA, PhyB, PhyC and PhyE subfamilies within angiosperms.
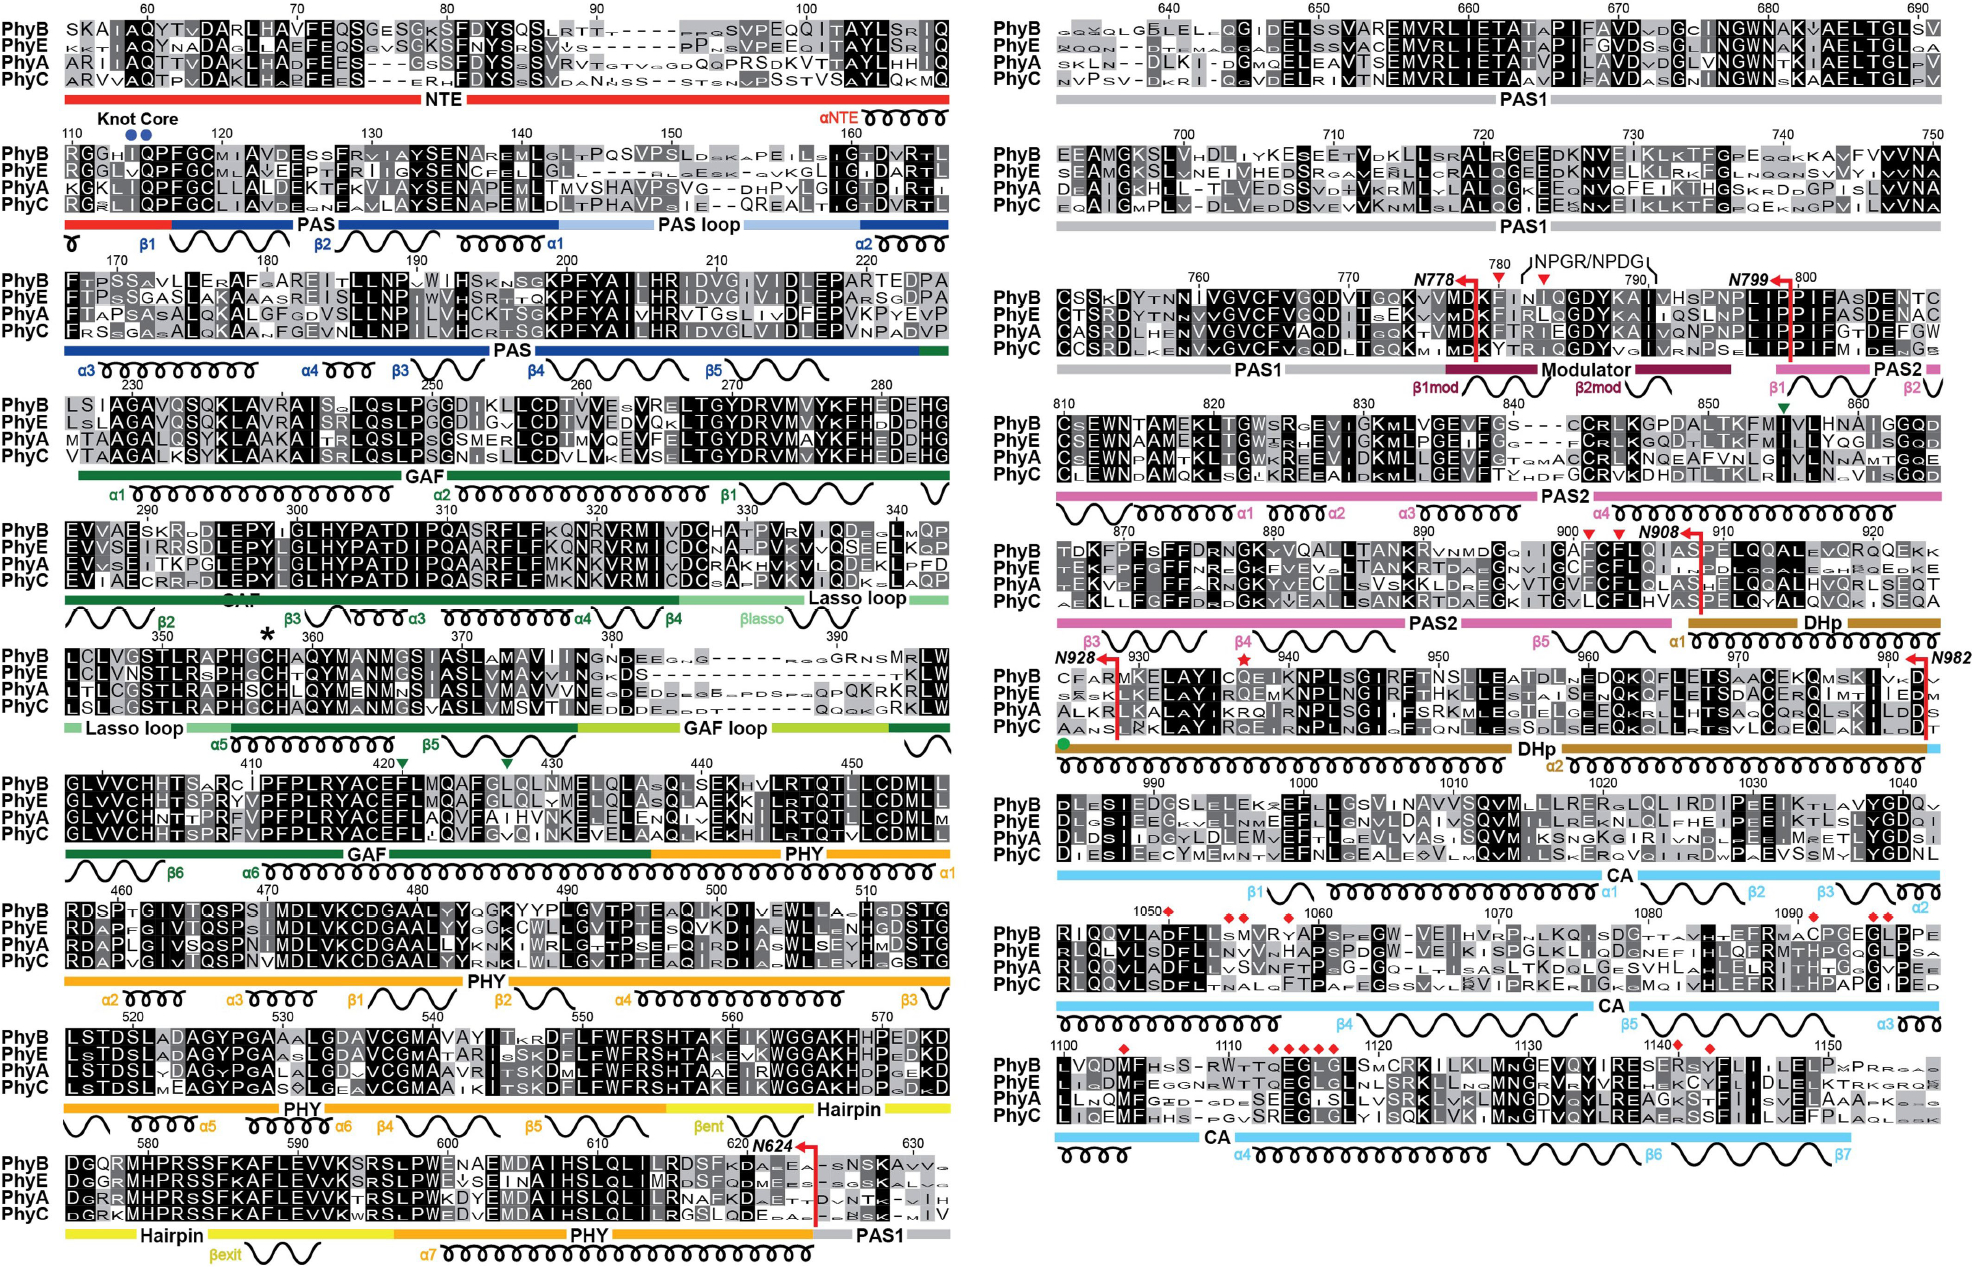
See ref. 8 for full description of the sequence list. The font height of each amino acid is proportional to its percent homology within each Phy isoform subfamily. The positions of the NTE, nPAS, GAF, PHY, PAS1, PAS2, and DHp and CA domains of the HKRD are located by the red, blue, green, orange, gray, magenta, brown and cyan bars, respectively. The PAS and GAF loops, the knot lasso, and the hairpin and modulator features are located by light blue, light green, turquoise, yellow, and dark red bars, respectively. The α-helices and β-strands, along with their numbering within each domain, are shown below the sequence by the coiled and wavy lines, respectively. The red star locates the position that commonly contains the phosphoacceptor histidine within prokaryotic transmitter HK domains. The blue circles indicate the core amino acids within the N-terminal knot. Red arrows locate the end point for the six N-terminal truncations of PhyB analyzed in this study (N624, N778, N799, N908, N928, and N982). Green arrowheads locate the residues shown experimentally to promote GAF-PAS2 contacts within the dimer. Red diamonds locate residues predicted to form the ATP-binding pocket in the CA domain based on prokaryotic transmitter HKs. A green circle locates Cys925 that is at the center of the cruciate crossover that transitions the PhyB protomers from head-to-tail to head-to-head arrangements.
Extended Data Fig. 7 |. Structural and enzymatic analyses of PhyB reveal its homology to transmitter HKs but with a compromised phosphotransferase activity.
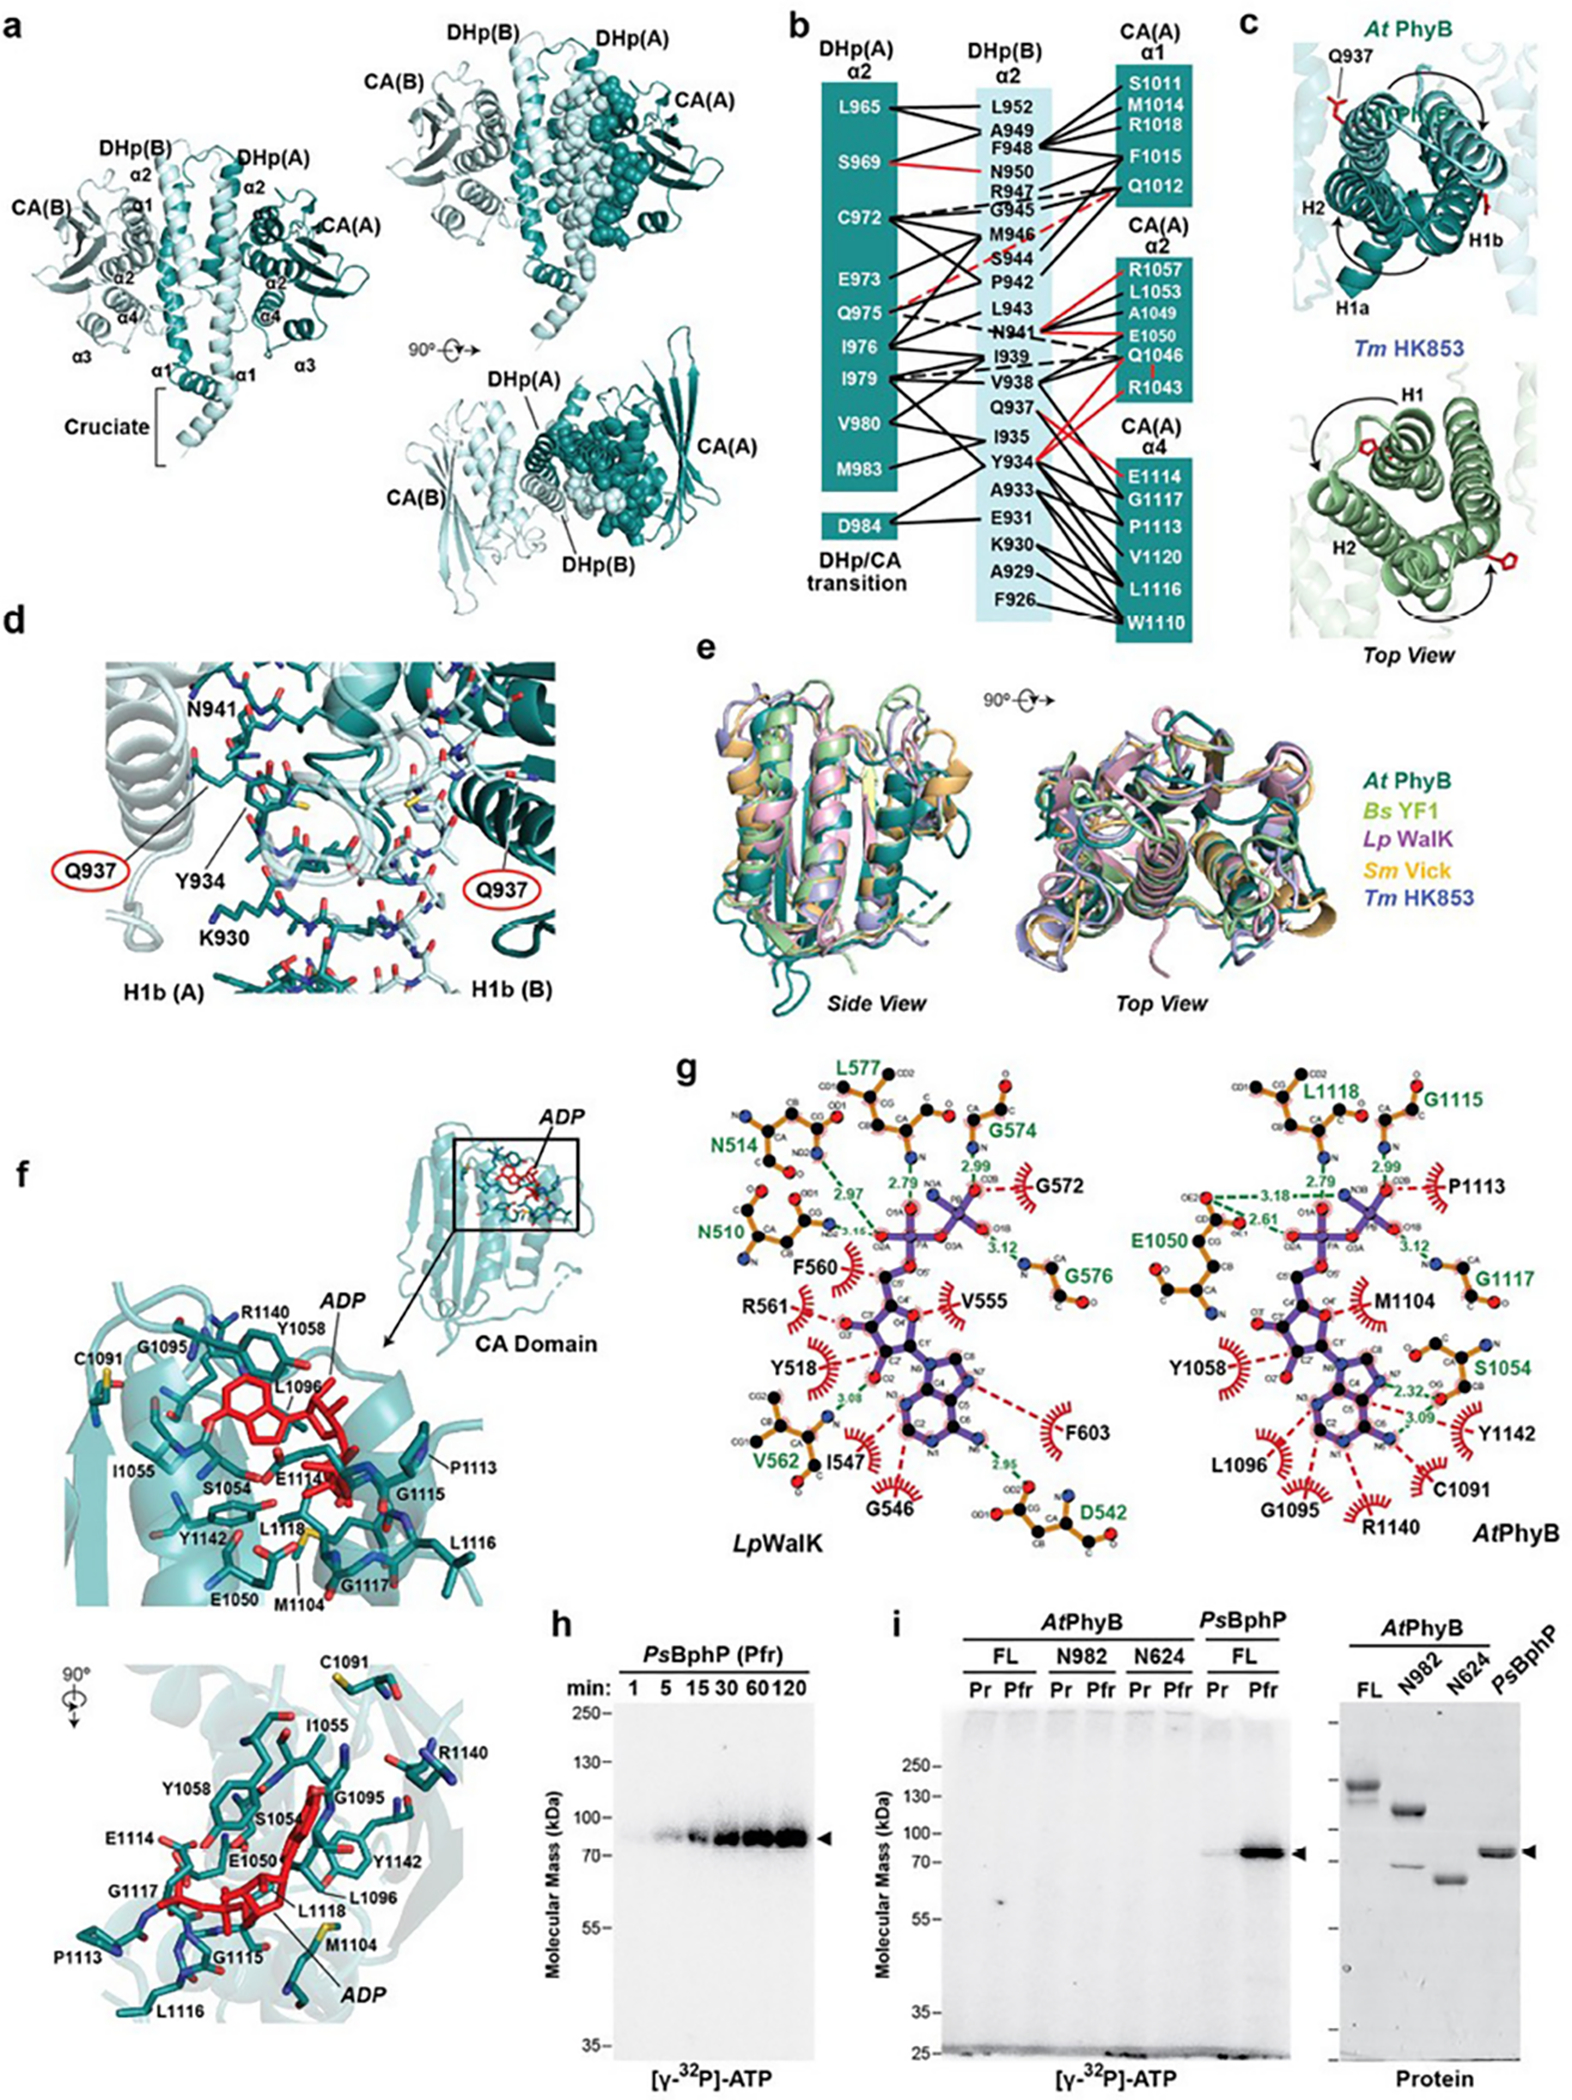
a, Cartoon 3D structure of the paired HKRDs from Arabidopsis (At) PhyB showing the structures and inter-molecular interfaces between the CA and DHp domains. Images on the right show a pair of orthlogonal views with residues within one half of the HKRD dimer interface shown as spheres. These residues were contributed by helix α1 from the DHp of protomer B, and helix α2 of DHp and helices α1, α2 and α4 from the CA domain of protomer A. b, The network of intermolecular contacts between the DHp and CA domains in (a) illustrated for simplicity. c, Top views of the DHp regions of the HKRDs for At PhyB as compared to the same region in the prokaryotic HK853 transmitter HK from Thermotoga maritima (PDB ID 3DGE37). Gln937 in At PhyB and the phosphoacceptor histidine in Tm HK853 are shown in red sticks. d, Closeup 3D views of the DHp domains in At PhyB corresponding to the region surrounding phosphoacceptor histidine in transmitter HKs. Gln937 in PhyB, which is a histidine in transmitter kinases, is circled. e, 3D superposition of the CA domain in At PhyB shown in cartoon with those from several bacterial two-component HKs illustrating its HK ancestry. Representatives include YF1 from Bacillus subtilis (Bs) (PDB ID 4GCZ), WalK from Lactobacillis plantarum (Lp) (PDB ID 4U7O), HK853 from Thermotoga maritima (Tm) (PDB ID 3DGE), and Vick from Streptococcus mutans (Sm) (PDB ID 4I5S). f, Model showing the predicted position of ADP (red) in the AtPhyB CA domain when modeled after that for LpWalK. Residues that might participate in binding are indicated. ADP clashes with multiple residues in the pocket of this predicted AtPhyB model, suggesting that conformational shifts in AtPhyB induced by ATP or upon photoactivation would be necessary for binding. g, Schematic of binding interactions between the ADP analogue adenylyl-imidodiphosphate (AMPPNP) and CA domain from the Lp WalK determined by X-ray crystallography (left; PDB ID 4U7O36) and that predicted for AtPhyB when modelled after the LpWalK structure (right). Hydrogen bonds and representative hydrophobic interactions are indicated with green and red dashed lines, respectively. Analogous residues are depicted in similar positions in schematics, except for LpAsn514 and AtSer1054. h and i, AtPhyB is a poor protein kinase as compared to Pseudomonas syringae (Ps) BphP based on autophosphorylation assays. The recombinant biliproteins were incubated at ambient temperature (~24°C) with 150 μM ATP supplemented with 10 μCi of [γ-32P]-ATP, quenched with SDS-PAGE sample buffer, and subjected to SDS-PAGE. Shown are the SDS-PAGE gels assayed for bound 32P by autoradiography or stained for protein with Coomassie blue. h, Time course for autophosphorylation of PsBphP as Pfr. i, Comparisons of autophosphorylation activities of AtPhyB as Pr and Pfr with those of PsBphP. Reactions containing equal mass amounts of biliprotein were terminated after 2 hr. (left) Autoradiography of the kinase reactions. (right) SDS-PAGE gel showing the biliprotein preparations used. Arrowheads locate PsBphP. The phosporimager scans are representative of 3 independent experiments. Full gels can be found in Supplementary Fig. 1.
Extended Data Fig. 8 |. SDS-PAGE analyses and absorption spectra of the PhyB truncations and point mutations studied here.
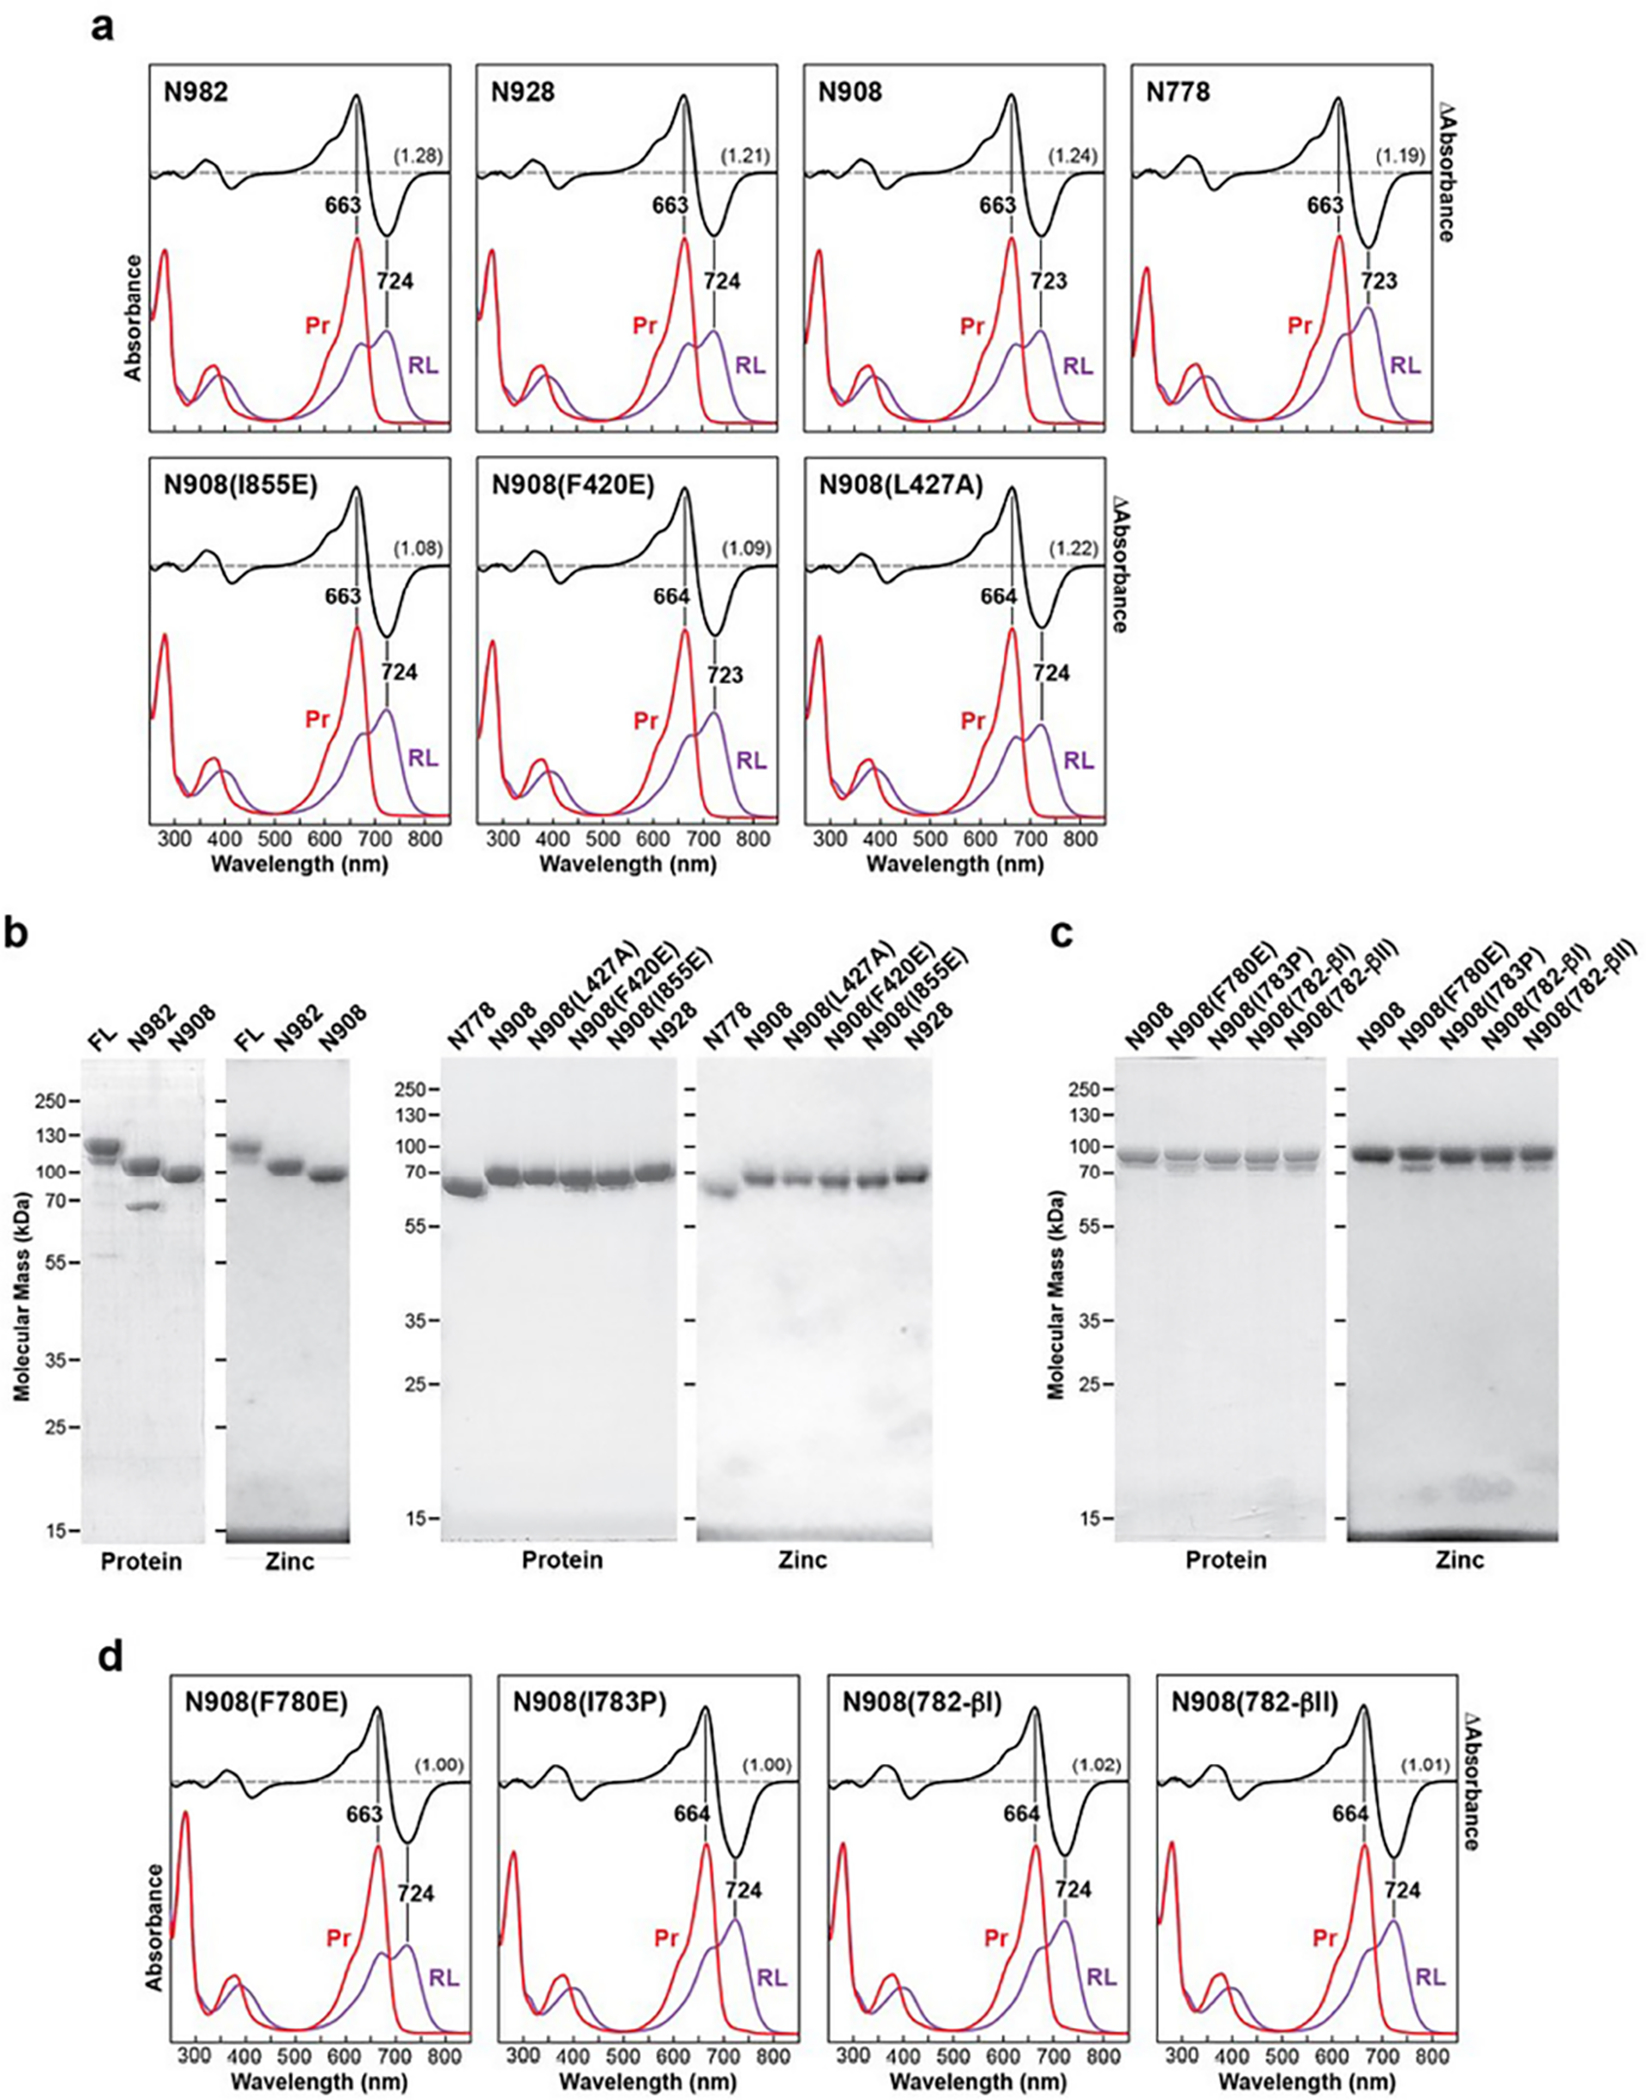
a and d, UV-vis absorbance spectra. The absorption spectra were collected from dark-adapted samples (Pr) or after saturating irradiation with 660-nm red light (RL, mostly Pfr). Absorption maxima were determined from the difference spectrum shown at 70% amplitude. SCR values are indicated in parentheses. Spectra represent the mean of three technical replicates. b and c, SDS-PAGE analysis of the purified PhyB proteins described in (a) and (d). After electrophoresis, the biliproteins were either stained for protein with Coomassie blue or imaged for the bound PΦB by zinc-induced fluorescence under UV light. Full gels can be found in Supplementary Fig. 1.
Extended Data Table 1 |.
Data collection, processing, model refinement, and validation statistics for the Arabidopsis PhyB dimer
| Data Collection and Processing | |
| Microscope | Titan Krios (ThermoFischer Scientific) |
| Magnification | 130,000 |
| Voltage (kV) | 300 |
| Electron exposure (e−/Å2) | 54.4 |
| Underfocus range (−μm) | 0.8 – 2.2 |
| Pixel size (Å) | 1.029 |
| Symmetry imposed | C1 |
| Initial particle images | 902,965 |
| Final particle images | 154,901 |
| Map resolution (Å) | 3.3 |
| FSC threshold | 0.143 |
| Map resolution range (Å) | 2.5 – 5 |
| Refinement | |
| Model resolution (Å) | 3.5 |
| FSC threshold | 0.5 |
| Model resolution range (Å) | 2.5 – 5 |
| Map sharpening B factor (Å2) | −84.83 |
| Model composition | |
| Non-hydrogen atoms | 13,616 |
| Protein residues | 1,723 |
| Ligands | 2 |
| B factors (Å2) | |
| Protein | 45.5 |
| Ligand | 28.7 |
| R.m.s. deviations | |
| Bond lengths (Å) | 0.005 |
| Bond angles (°) | 0.998 |
| Validity | |
| Molprobity score | 1.80 |
| Clash score | 7.39 |
| Poor rotamers (%) | 0.88 |
| Ramachandran plot | |
| Favored (%) | 94.24 |
| Allowed (%) | 5.76 |
| Disallowed (%) | 0 |
Extended Data Table 2 |.
Comparisons of sister domains in PhyB by superposition of all matching Ca atoms
| Domain or Region | RMSD (Å) | # of Atoms | Residue Range |
|---|---|---|---|
|
| |||
| nPAS | 0.82 | 91 | 117–143, 156–218 |
| GAF | 0.70 | 191 | 227–378, 393–433 |
| PHY | 0.83 | 177 | 444–620 |
| PAS2 | 0.99 | 107 | 800–907 |
| DHp (all) | 6.65 | 74 | 908–981 |
| DHp (after bend) | 0.73 | 54 | 928–981 |
| CA | 1.12 | 156 | 996–1151 |
| Parallelogram platform | 1.07 | 616 | 102–144,
156–220 227–378, 393–620 778–907 |
Extended Data Table 3 |.
Thermal reversion rate constants for the Arabidopsis PhyB mutant collection
| Phy | Amp1 (%) | k1 (min−1) | k2 (min−1) |
|---|---|---|---|
|
| |||
| PSM (N624)b | 96 | 1.61 (0.01) × 10−2 | 2 (1) × 10−3 |
| N778 | 96 | 1.83 (0.05) × 10−2 | 1.8 (0.8) × 10−3 |
| N799 | 97 | 1.90 (0.01) × 10−2 | 2.4 (0.6) × 10−3 |
| N908 | |||
| WT | 99 | 4.1 (0.4) × 10−1 | 1.7 (0.4) × 10−2 |
| F420E | 84 | 1.41 (0.01) × 10−1 | 1.13 (0.03) × 10−2 |
| L427A | 97 | 5.35 (0.04) × 10−1 | 3.7 (0.02) × 10−2 |
| F780E | 68 | 2.3 (0.1) × 10−2 | 1.2 (0.2) × 10−3 |
| 782-βI | 90 | 2.21 (0.01) × 10−2 | 5.2 (0.2) × 10−3 |
| 782-βII | 63 | 2.5 (0.3) × 10−2 | 1.0 (0.2) × 10−2 |
| 1783P | 94 | 2.45 (0.02) × 10−2 | 4.5 (0.9) × 10−3 |
| 1855E | 86 | 1.25 (0.01) × 10−1 | 1.5 (0.1) × 10−2 |
| N928 | 98 | 4.4 (0.1) × 10−1 | 1.9 (0.4) × 10−2 |
| N982 | 94 | 3.8 (0.1) × 10−1 | 2.9 (0.4) × 10−2 |
| FLb | 28 | 4.7 (0.1) × 10−1 | 5.3 (0.2) × 10−2 |
Parameters represent the mean and standard deviation calculated from three technical replicates.
Data from ref. 8.
Supplementary Material
Acknowledgements
Cryo-EM data were collected using the Titan Krios system at the David Van Andel Cryo-Electron Microscopy Suite at the Van Andel Institute. We thank G. Zhao and X. Meng for help with data collection; J. Zhang for the mass spectrometry analysis; H. Zaher for help with the kinase assays; and C. Sherman and K. McLoughlin for technical assistance. This work was funded by the US National Institutes of Health R01 grants GM127892 (to R.D.V.) and GM131754 (to Huilin Li), and funds provided by the Van Andel Institute (to Huilin Li) and Washington University in St Louis (to R.D.V.).
Footnotes
Competing interests The authors declare no competing interests.
Reporting summary
Further information on research design is available in the Nature Research Reporting Summary linked to this paper.
Additional information
Supplementary information The online version contains supplementary material available at https://doi.org/10.1038/s41586-022-04529-z.
Peer review information Nature thanks Jorge Casal, Elizabeth Getzoff and the other, anonymous, reviewer(s) for their contribution to the peer review of this work.
Reprints and permissions information is available at http://www.nature.com/reprints.
Data availability
Full versions of all SDS–PAGE gels and blots are provided in Supplementary Fig. 1. The 3D cryo-EM map of the full-length Arabidopsis PhyB at 3.3 Å resolution has been deposited in the Electron Microscopy Data Bank database under accession code EMD-24780. The corresponding atomic model has been deposited in the RCSB Protein Data Bank under accession code 7RZW. This study made use of several publicly available protein structures obtained from the RCSB Protein Data Bank (http://www.rcsb.org) under accession codes 4OUR, 6TC5, 3DGE, 4GCZ, 4U7O and 4I5S. Source data are provided with this paper.
References
- 1.Legris M, Ince YC & Fankhauser C Molecular mechanisms underlying phytochrome-controlled morphogenesis in plants. Nat. Commun. 10, 5219 (2019). [DOI] [PMC free article] [PubMed] [Google Scholar]
- 2.Burgie ES & Vierstra RD Phytochromes: an atomic perspective on photoactivation and signaling. Plant Cell 26, 4568–4583 (2014). [DOI] [PMC free article] [PubMed] [Google Scholar]
- 3.Auldridge ME & Forest KT Bacterial phytochromes: more than meets the light. Crit. Rev. Biochem. Mol. Biol. 46, 67–88 (2011). [DOI] [PubMed] [Google Scholar]
- 4.Rockwell NC, Su YS & Lagarias JC Phytochrome structure and signaling mechanisms. Annu. Rev. Plant Biol. 57, 837–858 (2006). [DOI] [PMC free article] [PubMed] [Google Scholar]
- 5.Franklin KA & Quail PH Phytochrome functions in Arabidopsis development. J. Exp. Bot. 61, 11–24 (2010). [DOI] [PMC free article] [PubMed] [Google Scholar]
- 6.Jung JH et al. Phytochromes function as thermosensors in Arabidopsis. Science 354, 886–889 (2016). [DOI] [PubMed] [Google Scholar]
- 7.Legris M et al. Phytochrome B integrates light and temperature signals in Arabidopsis. Science 354, 897–900 (2016). [DOI] [PubMed] [Google Scholar]
- 8.Burgie ES et al. Differing biophysical properties underpin the unique signaling potentials within the plant phytochrome families. Proc. Natl Acad. Sci. USA 118, e2105649118 (2021). [DOI] [PMC free article] [PubMed] [Google Scholar]
- 9.Essen LO, Mailliet J & Hughes J The structure of a complete phytochrome sensory module in the Pr ground state. Proc. Natl Acad. Sci. USA 105, 14709–14714 (2008). [DOI] [PMC free article] [PubMed] [Google Scholar]
- 10.Wagner JR, Brunzelle JS, Forest KT & Vierstra RD A light-sensing knot revealed by the structure of the chromophore-binding domain of phytochrome. Nature 438, 325–331 (2005). [DOI] [PubMed] [Google Scholar]
- 11.Yang X, Kuk J & Moffat K Crystal structure of Pseudomonas aeruginosa bacteriophytochrome: photoconversion and signal transduction. Proc. Natl Acad. Sci. USA 105, 14715–14720 (2008). [DOI] [PMC free article] [PubMed] [Google Scholar]
- 12.Takala H et al. Signal amplification and transduction in phytochrome photosensors. Nature 509, 245–248 (2014). [DOI] [PMC free article] [PubMed] [Google Scholar]
- 13.Burgie ES, Zhang J & Vierstra RD Crystal structure of Deinococcus phytochrome in the photoactivated state reveals a cascade of structural rearrangements during photoconversion. Structure 24, 448–457 (2016). [DOI] [PubMed] [Google Scholar]
- 14.Burgie ES et al. Photoreversible interconversion of a phytochrome photosensory module in the crystalline state. Proc. Natl Acad. Sci. USA 117, 300–307 (2020). [DOI] [PMC free article] [PubMed] [Google Scholar]
- 15.Isaksson L et al. Signaling mechanism of phytochromes in solution. Structure 29, 151–160 (2021). [DOI] [PubMed] [Google Scholar]
- 16.Anders K, Daminelli-Widany G, Mroginski MA, von Stetten D & Essen LO Structure of the cyanobacterial phytochrome 2 photosensor implies a tryptophan switch for phytochrome signaling. J. Biol. Chem. 288, 35714–35725 (2013). [DOI] [PMC free article] [PubMed] [Google Scholar]
- 17.Bhoo SH, Davis SJ, Walker J, Karniol B & Vierstra RD Bacteriophytochromes are photochromic histidine kinases using a biliverdin chromophore. Nature 414, 776–779 (2001). [DOI] [PubMed] [Google Scholar]
- 18.Yeh KC, Wu SH, Murphy JT & Lagarias JC A cyanobacterial phytochrome two-component light sensory system. Science 277, 1505–1508 (1997). [DOI] [PubMed] [Google Scholar]
- 19.Li FW et al. Phytochrome diversity in green plants and the origin of canonical plant phytochromes. Nat. Commun. 6, 7852 (2015). [DOI] [PMC free article] [PubMed] [Google Scholar]
- 20.Rockwell NC & Lagarias JC Phytochrome evolution in 3D: deletion, duplication, and diversification. New Phytol. 225, 2283–2300 (2020). [DOI] [PMC free article] [PubMed] [Google Scholar]
- 21.Yeh KC & Lagarias JC Eukaryotic phytochromes: light-regulated serine/threonine protein kinases with histidine kinase ancestry. Proc. Natl Acad. Sci. USA 95, 13976–13981 (1998). [DOI] [PMC free article] [PubMed] [Google Scholar]
- 22.Boylan MT & Quail PH Are the phytochromes protein kinases? Protoplasma 195, 12–17 (1996). [Google Scholar]
- 23.Elich TD & Chory J Phytochrome: if it looks and smells like a histidine kinase, is it a histidine kinase? Cell 91, 713–716 (1997). [DOI] [PubMed] [Google Scholar]
- 24.Ni W et al. A mutually assured destruction mechanism attenuates light signaling in Arabidopsis. Science 344, 1160–1164 (2014). [DOI] [PMC free article] [PubMed] [Google Scholar]
- 25.Buckley CE et al. Reversible optogenetic control of subcellular protein localization in a live vertebrate embryo. Dev. Cell 36, 117–126 (2016). [DOI] [PMC free article] [PubMed] [Google Scholar]
- 26.Chernov KG, Redchuk TA, Omelina ES & Verkhusha VV Near-infrared fluorescent proteins, biosensors, and optogenetic tools engineered from phytochromes. Chem. Rev. 117, 6423–6446 (2017). [DOI] [PubMed] [Google Scholar]
- 27.Levskaya A, Weiner OD, Lim WA & Voigt CA Spatiotemporal control of cell signalling using a light-switchable protein interaction. Nature 461, 997–1001 (2009). [DOI] [PMC free article] [PubMed] [Google Scholar]
- 28.Shimizu-Sato S, Huq E, Tepperman JM & Quail PH A light-switchable gene promoter system. Nat. Biotechnol. 20, 1041–1044 (2002). [DOI] [PubMed] [Google Scholar]
- 29.Krall L & Reed JW The histidine kinase-related domain participates in phytochrome B function but is dispensable. Proc. Natl Acad. Sci. USA 97, 8169–8174 (2000). [DOI] [PMC free article] [PubMed] [Google Scholar]
- 30.Matsushita T, Mochizuki N & Nagatani A Dimers of the N-terminal domain of phytochrome B are functional in the nucleus. Nature 424, 571–574 (2003). [DOI] [PubMed] [Google Scholar]
- 31.Burgie ES et al. Photosensing and thermosensing by phytochrome B require both proximal and distal allosteric features within the dimeric photoreceptor. Sci. Rep. 7, 13648 (2017). [DOI] [PMC free article] [PubMed] [Google Scholar]
- 32.Burgie ES, Bussell AN, Walker JM, Dubiel K & Vierstra RD Crystal structure of the photosensing module from a red/far-red light-absorbing plant phytochrome. Proc. Natl Acad. Sci. USA 111, 10179–10184 (2014). [DOI] [PMC free article] [PubMed] [Google Scholar]
- 33.Nagano S et al. Structural insights into photoactivation and signalling in plant phytochromes. Nat. Plants 6, 581–588 (2020). [DOI] [PubMed] [Google Scholar]
- 34.Diensthuber RP, Bommer M, Gleichmann T & Moglich A Full-length structure of a sensor histidine kinase pinpoints coaxial coiled coils as signal transducers and modulators. Structure 21, 1127–1136 (2013). [DOI] [PubMed] [Google Scholar]
- 35.Wang C et al. Mechanistic insights revealed by the crystal structure of a histidine kinase with signal transducer and sensor domains. PLoS Biol. 11, e1001493 (2013). [DOI] [PMC free article] [PubMed] [Google Scholar]
- 36.Cai Y et al. Conformational dynamics of the essential sensor histidine kinase WalK. Acta Crystallogr. D 73, 793–803 (2017). [DOI] [PMC free article] [PubMed] [Google Scholar]
- 37.Casino P, Rubio V & Marina A Structural insight into partner specificity and phosphoryl transfer in two-component signal transduction. Cell 139, 325–336 (2009). [DOI] [PubMed] [Google Scholar]
- 38.Lagarias JC & Mercurio FM Structure function studies on phytochrome. Identification of light-induced conformational changes in 124-kDa Avena phytochrome in vitro. J. Biol. Chem. 260, 2415–2423 (1985). [PubMed] [Google Scholar]
- 39.Jones AM, Vierstra RD, Daniels SM & Quail P The role of separate molecular domains in the structure of phytochrome from etiolated Avena sativa L. Planta 164, 501–516 (1985). [DOI] [PubMed] [Google Scholar]
- 40.Li H, Zhang J, Vierstra RD & Li H Quaternary organization of a phytochrome dimer as revealed by cryoelectron microscopy. Proc. Natl Acad. Sci. USA 107, 10872–10877 (2010). [DOI] [PMC free article] [PubMed] [Google Scholar]
- 41.Gourinchas G et al. Long-range allosteric signaling in red light-regulated diguanylyl cyclases. Sci. Adv. 3, e1602498 (2017). [DOI] [PMC free article] [PubMed] [Google Scholar]
- 42.Etzl S, Lindner R, Nelson MD & Winkler A Structure-guided design and functional characterization of an artificial red light-regulated guanylate/adenylate cyclase for optogenetic applications. J. Biol. Chem. 293, 9078–9089 (2018). [DOI] [PMC free article] [PubMed] [Google Scholar]
- 43.Mechaly AE, Sassoon N, Betton JM & Alzari PM Segmental helical motions and dynamical asymmetry modulate histidine kinase autophosphorylation. PLoS Biol. 12, e1001776 (2014). [DOI] [PMC free article] [PubMed] [Google Scholar]
- 44.Shin AY et al. Evidence that phytochrome functions as a protein kinase in plant light signalling. Nat. Commun. 7, 11545 (2016). [DOI] [PMC free article] [PubMed] [Google Scholar]
- 45.Klose C, Nagy F & Schafer E Thermal reversion of plant phytochromes. Mol. Plant 13, 386–397 (2020). [DOI] [PubMed] [Google Scholar]
- 46.Klose C et al. Systematic analysis of how phytochrome B dimerization determines its specificity. Nat. Plants 1, 15090 (2015). [DOI] [PubMed] [Google Scholar]
- 47.Rensing SA, Sheerin DJ & Hiltbrunner A Phytochromes: more than meets the eye. Trends Plant Sci. 21, 543–546 (2016). [DOI] [PubMed] [Google Scholar]
- 48.Kikis EA, Oka Y, Hudson ME, Nagatani A & Quail PH Residues clustered in the light-sensing knot of phytochrome B are necessary for conformer-specific binding to signaling partner PIF3. PLoS Genet. 5, e1000352 (2009). [DOI] [PMC free article] [PubMed] [Google Scholar]
- 49.Ni W et al. PPKs mediate direct signal transfer from phytochrome photoreceptors to transcription factor PIF3. Nat. Commun. 8, 15236 (2017). [DOI] [PMC free article] [PubMed] [Google Scholar]
Associated Data
This section collects any data citations, data availability statements, or supplementary materials included in this article.
Supplementary Materials
Data Availability Statement
Full versions of all SDS–PAGE gels and blots are provided in Supplementary Fig. 1. The 3D cryo-EM map of the full-length Arabidopsis PhyB at 3.3 Å resolution has been deposited in the Electron Microscopy Data Bank database under accession code EMD-24780. The corresponding atomic model has been deposited in the RCSB Protein Data Bank under accession code 7RZW. This study made use of several publicly available protein structures obtained from the RCSB Protein Data Bank (http://www.rcsb.org) under accession codes 4OUR, 6TC5, 3DGE, 4GCZ, 4U7O and 4I5S. Source data are provided with this paper.


