ABSTRACT
In recent days, COVID-19 pandemic has affected several people's lives globally and necessitates a massive number of screening tests to detect the existence of the coronavirus. At the same time, the rise of deep learning (DL) concepts helps to effectively develop a COVID-19 diagnosis model to attain maximum detection rate with minimum computation time. This paper presents a new Residual Network (ResNet) based Class Attention Layer with Bidirectional LSTM called RCAL-BiLSTM for COVID-19 Diagnosis. The proposed RCAL-BiLSTM model involves a series of processes namely bilateral filtering (BF) based preprocessing, RCAL-BiLSTM based feature extraction, and softmax (SM) based classification. Once the BF technique produces the preprocessed image, RCAL-BiLSTM based feature extraction process takes place using three modules, namely ResNet based feature extraction, CAL, and Bi-LSTM modules. Finally, the SM layer is applied to categorize the feature vectors into corresponding feature maps. The experimental validation of the presented RCAL-BiLSTM model is tested against Chest-X-Ray dataset and the results are determined under several aspects. The experimental outcome pointed out the superior nature of the RCAL-BiLSTM model by attaining maximum sensitivity of 93.28%, specificity of 94.61%, precision of 94.90%, accuracy of 94.88%, F-score of 93.10% and kappa value of 91.40%.
KEYWORDS: COVID-19, machine learning, deep learning, feature extraction, Chest-X-Ray
1. Introduction
In present times, the 2019 novel coronavirus commonly termed as COVID-19 has become a severe communal health issue globally. The illness which is the reason for COVID-19 universal disease was known as Severe Acute Respiratory Syndrome Coronavirus 2 (SARS-CoV-2) [22]. Coronaviruses (CoV) are big families of the virus which is the reason for COVID-19 followed by cold like SARS-CoV and Middle East Respiratory Syndrome (MERS-CoV). COVID-19 is a novel kind that was exposed in 2019 and has not been formerly deducted in human beings. Coronaviruses are zoonotic because the germs are infected among animals and people. Researchers identified that the SARS-CoV virus is evolved from decayed cats which spread over human beings, and the MERS-CoV virus is defilement from dromedaries which is spread from the Arabian camel to humans. COVID-19 virus is supposed to be spread from bats to human beings. This kind of virus is transmitted by respiratory organs from one to another human being resulting in the fast multiplication of this virus. This disease provokes mild signs around 82% of patients and the rest are either rigorous or crucial [22]. Even as ninety-five percent of the infected case count survives the virus slightly, the remaining five percent has put around in a severe or crucial state.
Symptoms of infectivity have dyspnea (i.e. shortness of breath), fever, cough, and respiratory sign. In other severe victims, the infectivity leads to pneumonia, organ failure, septic shock, severe acute respiratory syndrome, as well as mortality. It has been computed that males are highly infectious than females and that the kids under the age group of (0–9) kids also have a certain probability of infection. The person already suffering respiratory issues are easily infected by COVID-19 pneumonia compared to healthier humans. Although in several countries, the health infrastructure has moved towards failing because of rising requisition for Intensive Care Units (ICU) at. ICU is fully occupied by the COVID-19 cases that are in serious stage along with pneumonia. The allotment of this patient observed globally among the times of 16th February and 21st March 2020.
From March 2020, a greater number of open access C-ray images of COVID-19 patients is available. This paved a way to analyze the medicinal imagery and recognize the all probable prototype which might result in the automated disease diagnoses. At present, the trails of this virus are challenging work due to the inaccessibility of the COVID-19 disease identification model all over the world, leads to anxiety. Due to the insufficient accessibility of coronavirus test kits, it is necessary to depend on another diagnostic method. As the corona virus affects the epithelial cells in the respiratory region, the physicians could utilize X-rays for diagnosing the lungs of the patients.
The physicians often utilized X-ray photographs for pneumonia diagnosis, lung inflammation, abscesses, and/or enlarged lymph nodes. Since every hospital contains X-ray imaging equipment; it can be probable to conduct an X-rays test for COVID-19 with no use of specialized testing kits. The disadvantages of X-ray analysis involve a radiology specialist and time-consuming process, which is costly when the public is ill around worldwide. Thus, creating an automated analysis method is essential to reduce the workload of medicinal experts. Moreover, positive findings must attain from X-ray and CT photographs. An additional diagnosing model of COVID-19 is to inspect the RNA series of the pandemic. But it is found to be ineffective because of the elongated diagnosis time. The exact diagnostics rate of this model differs from thirty to fifty percent. Therefore, a greater number of repetitive tests should be done for proper results. The radiological imaging method is important for COVID-19 detection. Though it represents a spherical allotment inside the images, it might show the same features with an alternate viral pandemic lung infection.
In the existing condition of the rapid multiplication of coronavirus, several types of investigations have been carried out on. DL is one of the recent methods relevant to the healthcare field for diagnostics usage [4]. DL is an integration of Machine Learning (ML) techniques and is highly concentrated on the automatic feature extractor and image classifiers, which has its applicability in object detection and medical image classification processes. Both ML and DL models have become well-recognized models for mining, analyzing, and identifying patterns from images [19,15,10]. Recovering the advancement of medicinal decision making and CAD becomes non-trivial, as novel data gets generated [4]. DL frequently referred to a process where deep convolutional neural networks (DCNN) are used for automated feature extraction, which makes use of the convolution process and the layers operate on non-linear data [16]. Every layer contains a data transformation to a high and further abstract level. The deep entered into the networks, the complexity data can be studied. Generally, DL indicates new deep networks compared to traditional ML models using big data [2,18].
This paper presents a new Residual Network (ResNet) based Class Attention Layer with Bidirectional LSTM called RCAL-BiLSTM for COVID-19 Diagnosis. The presented RCAL-BiLSTM model performs a series of steps namely bilateral filtering (BF) based preprocessing, RCAL-BiLSTM based feature extraction, and softmax (SM) based classification. At the earlier stage, the input image is preprocessed by the BF technique to remove the artifacts and raise the supremacy of the input image. Followed by, RCAL-BiLSTM based feature extraction process takes place using three modules, namely ResNet based feature extraction, CAL, and Bi-LSTM modules. Finally, the SM layer is applied to categorize the feature vectors into corresponding feature maps. The experimental validation of the presented RCAL-BiLSTM model is tested against the Chest-X-Ray dataset and the results are determined under several aspects. In short, the contribution of the paper is listed as follows.
Performs image preprocessing using BF technique for noise removal
Propose a feature extraction model using RCAL-BiLSTM model
Perform image classification using SM layer
Validate the performance of the proposed model on Chest X-ray dataset
The remaining part of the study is organized in the following. Section 2 reviews some of the works relevant to the proposed method. Section 3 introduces the RCAL-BiLSTM model and experimental validation is carried out in Section 4. At last, the work is ended up in Section 5.
2. Related works
ML models are defined as a sub-section of Artificial Intelligence (AI), which is applied frequently for clinical applications in the feature extraction as well as image analysis processes. Sorensen et al. [20] computed the dissimilarities among the set of Regions of Interest (ROI). Followed by, it categorized the features through a standard vector space-based classification model. Zhang and Wang [29] provided a CT classifier with 3 traditional features namely, grayscale values, shape, and texture, as well as symmetric features. It is accomplished by the application of the radial basis function neural network (RBFNN) for the classification of image features. Homem et al. [7] projected a relative study under the employment of JeffriesñMatusita (JñM) distance as well as KarhunenñLoËve transformation feature extraction models. Albrecht et al. [1] presented a classification approach with an average grayscale value of images for multiple image classification. Yang et al. [28] recommended an automated classification model for classifying breast CT images under the application of morphological features. Performance is reduced while a similar process is computed with alternate datasets. Additionally, hand-crafted methods are initialized to decline the deployment of CNN and automatic feature extraction models. CNN structure is a DL structure that filters and classifies the images automatically.
Ozyurt et al. [13] applied a hybrid approach named as fused perceptual hash relied CNN for reducing the classifying duration of liver CT images and retain the working function. Xu et al. [25] employed a transfer learning principle to resolve the medical image imbalance issue. Next, the GoogleNet, ResNet101, Xception, and MobileNetv2 performances were compared and provide better outcomes. Lakshmanaprabu et al. [10] examined the CT scan of lung images with the help of the best DNN as well as linear discriminate analysis (LDA). Gao et al. [3] transformed actual CT images to minimum attenuation, original images, and maximum attenuation pattern rescale. Finally, the images are re-sampled 3 samples and categorized using CNN.
Shan et al. [17] have introduced a DL centric system for automated segmentation of lung and infected regions with the application of chest CT. Xu et al. [27] focused on developing primary screening methods to differentiate COVID-19 pneumonia and Influenza-A viral pneumonia from normal cases using pulmonary CT images and DL methods. Wang et al. [23] depends upon COVID-19 radiographic alterations from CT images and established a DL technique to extract graphical features of COVID-19 to offers medical analysis before reaching pathogenic state and prevent the fatal condition of the patient. MERS-CoV and SARS-CoV are considered to be the neighbors of COVID-19. It contains technical publications with the help of chest X-ray images in diagnosing MERS-CoV and SARSCoV. From Hamimi [5], MERSCoV showcased that features in chest X-ray and CT are representations of pneumonia. Xie et al. [24] applied data mining (DM) methods to classify SARS and pneumonia using X-ray images.
Though several models are available for the COVID-19 diagnosis, there is still a need to identify COVID-19 from Chest X-ray images. The X-ray machines finds useful for scanning the infected body like fractures, bone displacements, lung disease, pneumonia, and tumors. CT scanning is an extended version of X-ray which examines the soft tissues present in the inner organs of human body. With the application of X-ray, then scanning might be a rapid, simple, inexpensive and less harmful model when compared to CT. The delay in predicting COVID-19 pneumonia leads to a fatal situation. Therefore, an effective COVID-19 diagnosis model has been employed to detect and classify the disease.
3. The proposed RCAL-BiLSTM model
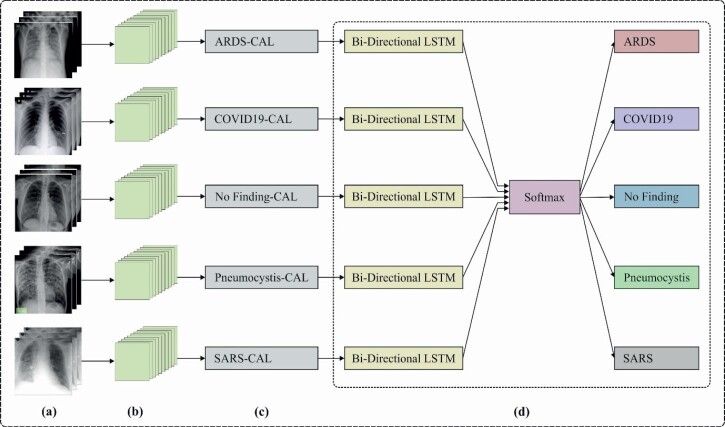
The workflow of the presented RCAL-BiLSTM model is depicted in Figure 1. As depicted, the input image is preprocessed to remove the noise that exists in it. Once the BF technique produces the preprocessed image, RCAL-BiLSTM based feature extraction process takes place using three modules, namely ResNet 152 based feature extraction, CAL, and Bi-LSTM modules. Firstly, the ResNet model extracts the fine grained semantic feature map, whereas the CAL intends to capture the discriminative class based features. Thirdly, the Bi-LSTM module defines the class dependencies in both directions and generates structured multiple object labels. Finally, the SM layer is applied to categorize the feature vectors into corresponding feature maps.
Figure 1.
Overall process of RCAL-BiLSTM: (a) Training images, (b) ResNet-152 based feature extraction, (c) Class attention layer, (d) Classification process.
3.1. Image preprocessing
The BF is a non-linear, edge-conserving, and noise-removing image smoothening filtering method. BF technique is preferred due to the advantages such as robust, simplicity and flexibility. It can be executed for replacing the intensities of every pixel with a weighted average of intensity values from nearby pixel values. The weight depends on the Gaussian distribution. Basically, the weights do not solely depend on the Euclidean distance of pixels; it can also rely on radiometric variations and maintains sharp edges. Essentially, the BF method is illustrated as follows.
| (1) |
where denotes the normalization term that is expressed by
| (2) |
where indicates filtered image, signifies actual input image, is the coordinate of occur pixel, is the window centered in , is other pixel, is the series kernel to smoothen difference in intensity levels and is the spatial (or domain) kernel to smoothen the difference in coordinate points. The weight is assigned to the spatial closeness and the intensity differences. Consider a pixel that occurs at the coordinate that is needed to be denoised in the image with the utilization of closer pixels and one of the near pixels is located at . Next, the series, as well as spatial kernels, are regarded as the Gaussian kernels, and after that the weight assigned for pixel for denoising the pixel is expressed as
| (3) |
where and are smoothing variables, and and means pixel intensities and respectively. Once the weights are computed, normalization procedures occur as follows.
| (4) |
Where is the denoised intensity of pixel .
3.2. RCAL-BiLSTM based feature extraction
The feature extraction process comprises three subunits namely ResNet152 based feature extractor, CAL, and Bi-LSTM modules. These processes are discussed in the subsequent sections.
3.2.1. ResNet 152 based feature extractor
CNN is an individual structural design of artificial neural networks (ANN). CNN employs various features of the visual cortex. An important role of image classification is computing the class label of the input image. The images are accepted in the sequence of convolutional (Conv), nonlinear, pooling layers, and fully connected (FC) layers, after that it creates an outcome. The Conv layer is consistently the initial layer of CNN [12]. An image is represented as a matrix through pixel values. After that, the system chooses a lesser matrix that is known as a filter (neuron or core). Next, the filter creates convolution where the input image is developed. The main aim of a filter is to enhance the values with actual pixel values and every multiplication is added. As the filters have interpreted the image from the upper left corner, it goes additional right with 1 unit executing the same function. Behind passing the filter, a matrix is achieved; however, it is minimal when compared to the input matrix. At this point, it becomes analogous for recognizing edges and colors on the image.
The network is consisting of various Conv networks varied by nonlinear as well as pooling layers. If the image exceeds in 1 Conv layer, the result of the initial layer became the input to the second layer. Also, it occurs with all furthers Conv layer. The nonlinear layer is further following all convolution functions. It is comprised of an activation function that consumes nonlinear property. Followed by, it applies the pooling layer. It is operated using the width as well as the height of the image and executes a downsampling function on them. Because of the outcome, the image volume is diminished. It is implied that when few features are examined in the existing Conv function, a definite image is no longer required the extra procedure, and it can be reduced to lesser definite pictures. In the FC layer, the resultant data is obtained from Conv. networks. Connecting an FC layer to the final stage of a system provides dimensional vector, where N denotes the number of classes from which the desired classes can be developed.
ResNet is developed by Kaiming [6]. With respect to Residual Unit, it offers training for DNN system to achieve the ILSVRC 2015 ownership and obtain minimum error rate classification for the first 5 classes that are effective though the count of parameters is lower than VGGNet. The main aim of ResNet, HighWay Nets, applies the skip connection to provide input for the layer indiscriminately to combine the data flow to eliminate data loss as well as gradient vanishing issues. Also, reducing noise refers to averaging the method, and it maintains training accuracy and generalization. The proficient way is to enhance maximum label data, to attain better training accuracy and approximate level of traversal.
The ResNet architecture is productive which stimulates training of ultra DNN and enhances the accuracy of. The ResNet function evolves from the depth of CNN and results in degradation issues. The accuracy is increased and it is considered as one of the disadvantages at the time of improving the depth and reduces the accuracy. When a shallow network suffers the accuracy of saturation and comprised of congruent mapping layers, and to the minimum, the error would be discarded which is deeper the network and does not offers maximum training samples error. The basic idea to convey the existing result to the upcoming layer with the help of congruent mapping. ResNet applies the residual block for resolving the degradation as well as gradient vanishing issues in CNNs. These blocks in ResNet execute the remaining under the inclusion of input and output of the residual block. The expression of residual function is given in the following:
| (5) |
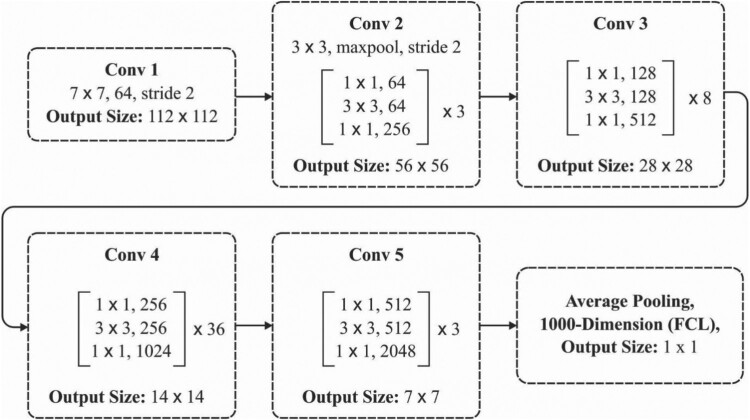
where x defines the input of residual block; W implies the weight of residual block; y refers output of the residual block. ResNet network is composed of various residual blocks where convolution kernel size is varied. Some of the traditional architecture of ResNet has RetNet18, RestNet50, and RestNet101. The fundamental structure of ResNet152 is provided in Figure 2. There are 2 types of residual connections as shown in Figure 3 and is defined below.
- The identity shortcuts (x) could be applied directly to the input and outputs have similar dimensions.
(6) - While there is a change in dimensions, the shortcut identifies mapping, with additional zero entries padded with the enhanced dimension. Then, the projection shortcut is applied to match the dimension with the help of the given function:
(7)
Figure 2.
Architecture of ResNet-152 layer.
Figure 3.
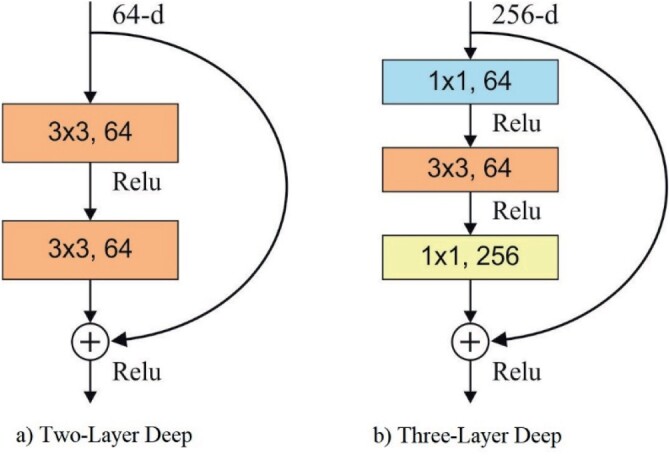
Types of residual connections.
Initially, there are no additional parameters, secondly, it is added in the form of . Though the layer network is a subspace in 34 layer network, it is still effective. ResNet performs quite-well by a significant margin. Every ResNet block is 2 layers deep or 3 layers deep (ResNet 50, 101, 152). In this study, ResNet 152 model has been employed.
3.2.2. Class attention learning (CAL) layer
The features extracted from ResNets are highly effective which has been induced directly to the FC layer and finally it tends to produce massive estimates. Thus, the extraction of discriminative class-wise features is a major task for class dependencies and efficiently bridging CNN as well as RNN for multi-label classifications. In this model, a class attention learning layer has been deployed for searching features interms of category, and the projected layer comprises of 2 stages: (1) producing class attention maps by a convolutional layer with stride 1, and (2) vectorizing all class attention map to acquire class based features [9]. Then, the applied feature maps were obtained from the feature extraction module, with a size of , and suppose is the l-th convolutional filter in the class attention learning layer. The attention map for class is accomplished with the help of given notion:
| (8) |
where grades from 1 to many classes which shows convolution task. Assume the size of convolutional filters is , a class attention map Ml is a linear integration of channels in . Using the deployment, the projected class attention learning layer is able to learn discriminative class attention maps. The X-ray chest image is induced into feature extraction module, obtained from ResNet101, and provides a final convolutional block named the feature maps X in Equation (8). Therefore, X is dense in high-level semantic data, and size of X is .
Followed by, the numbers of filters are the same as the number of classes which is appended to produce class-based feature using all classes. It is monitored that, class attention maps pointed out the discriminative regions for diverse classes and showcases absent classes. Consequently, class attention maps are converted into class-wise feature vectors of W2 dimensions using vectorization. Regardless, FC layers of class attention map to all hidden unit in the layer develops class-wise connections among class attention maps and concerned hidden units, such that corresponding time steps in LSTM layer. Similarly, features that are provided should be trained for class-specific discriminative and exploits the dynamic class dependency in the subsequent Bi-LSTM layer.
3.2.3. Bi-LSTM layer
An LSTM is dependable with the classic RNN structure, although it utilizes various methods to compute the hidden state. It solves the issue of Recurrent ANN which could not manage long-distance dependence. An LSTM method involves frequent memory units all that have 3 gates with various functions. Utilizing the feature vector as input and the tth word as an instance, the values of the particular conditions of the LSTM unit of tth words are provided in the following. A particular computation expression is applied, where signifies sigmoid function, indicates dot multiplication.
The shows the forget gate:
| (9) |
The is the input gate:
| (10) |
The takes the candidate memory cell condition at recent time step, where tanh denotes the tangent hyperbolic function;
| (11) |
The signifies the state value of recent time in the memory cell. The value of and ranged from 0 to 1. The computation of denoting that novel information is saved in from the candidate unit . The computation of denoting that information is preserved and that is unnecessary in the preceding memories .
| (12) |
The is output gate:
| (13) |
is the hidden layer state at time :
| (14) |
The LSTM only has the historical data of the series, although it is frequently not enough. When it can use future data, it will be extremely useful to the series of roles. The bidirectional LSTM has a forward as well as backward LSTM layer, as given in Figure 4. The forward layer takes the previous data of the series and the backward layer takes the upcoming data of the series. Hence, these layers are attached to a similar resultant layer [11]. A massive highlight of this design is that the series of context data is completely considered. Since the input of time is the feature , at time , the outcome of the forward hidden unit is , and the outcome of the backward hidden unit is ,
Figure 4.
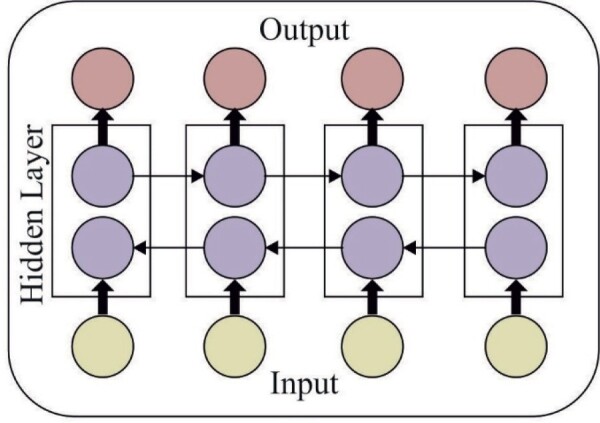
Architecture of BiLSTM.
After that, the outcome of the backward as well as a hidden unit at time is equivalent as follows:
| (15) |
| (16) |
where indicates the hidden layer function. A forward resultant vector is and backward output vector is , and it must be joined to achieve the text feature. indicates the number of hidden layer cells:
| (17) |
3.3. SM layer based classification
SM layer is attached to the final layer to classify the feature vectors generated in the previous layer to the appropriate class label. The SM classification model performs mapping of the input vector from an N-dimensional space to required classes as defined below.
| (18) |
where θk = [θk1, θk2, … , θkN]T are the weights which need to be optimally tuned.
4. Performance validation
The experimental analysis of the presented RCAL-BiLSTM model is done on a PC with Intel i5, 8 generation PC with 16GB RAM, MSI L370 Apro, Nividia 1050 Ti4 GB. Python 3.6.5 tool along with pandas, sklearn, Keras, Matplotlib, TensorFlow, opencv, Pillow, seaborn and pycm is used for simulation. For experimentation, 10 fold cross-validation technique is used.
4.1. Dataset description
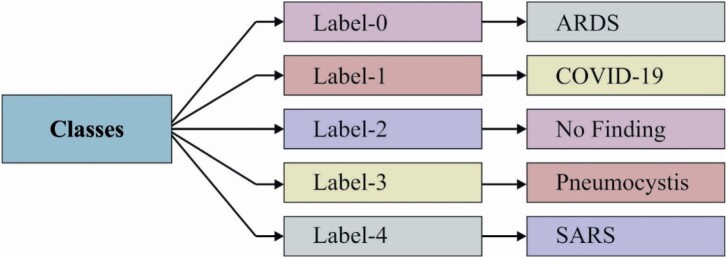
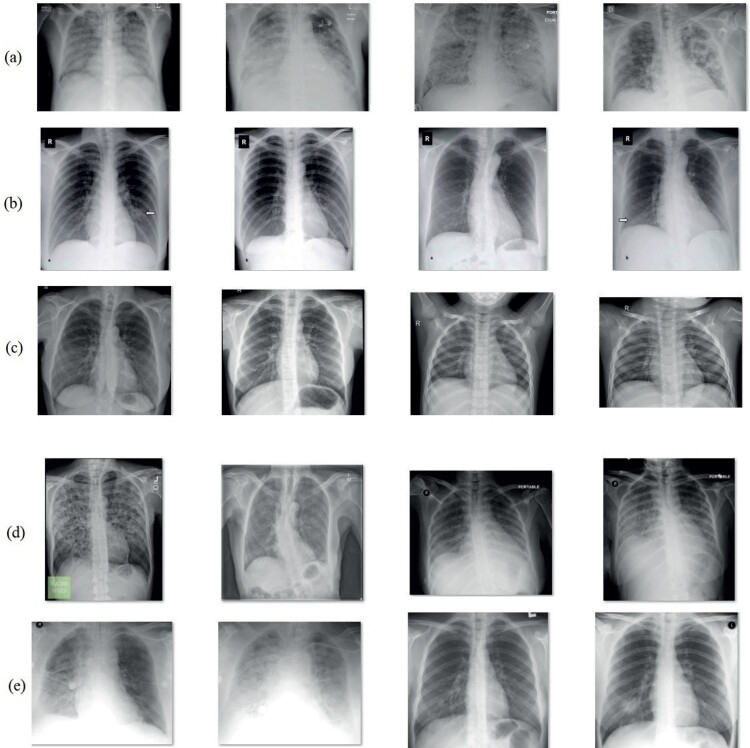
The efficiency of the proposed RCAL-BiLSTM approach in diagnosing COVID-19 is performed using Chest-X-Ray dataset [21]. It comprises images with five classes ranging from labels 0 to 5 namely ARDS, COVID-19, No Finding, Pneumocystis, and SAR, as depicted in Figure 5. Some of the sample test images are depicted in Figure 6.
Figure 5.
Dataset description.
Figure 6.
Sample test images: (a) ARDS, (b) COVID-19, (c) No Finding, (d) Pneumocystis, (e) SARS.
4.2. Results analysis
In this section, a detailed results analysis of RCAL-BiLSTM model is made with the existing methods [8,14] namely CNN, Deep Transfer Learning (DTL), Multi-Layer Perceptron (MLP), Logistic Regression (LR), XGBoost, K-Nearest Neighbour (KNN), Decision Tree (DT) and Xiaowei Xu et al. [26] models.
Table 1 and Figure 7 showcases the classification outcome of the RCAL-BiLSTM model in COVID-19 diagnosis interms of different performance metrics. From the table values, it is observed that the RCAL-BiLSTM model has effectively classified the images under ARDS class label with the higher sensitivity of 92.83%, specificity of 94.76%, precision of 94.90%, accuracy of 96.86%, F-score of 92.58% and kappa value of 90.49% respectively. At the same time, the images under the COVID-19 class label are classified with the higher sensitivity of 93.56%, specificity of 94.31%, precision of 94.62%, accuracy of 95.96%, F-score of 93.90% and kappa value of 91.30% respectively. Similarity, under the No Finding class label, the images are classified with the maximum sensitivity of 93.21%, specificity of 94.87%, precision of 94.89%, accuracy of 93.91%, F-score of 92.80% and kappa value of 91.74% respectively. Along with that, the images in Pneumocystis class label are categorized with the higher sensitivity of 93.30%, specificity of 94.84%, precision of 95.17%, accuracy of 93.06%, F-score of 92.64% and kappa value of 91.40% respectively. Finally, the images in the SARS class label are categorized with the higher sensitivity of 93.50%, specificity of 94.28%, precision of 94.92%, accuracy of 94.59%, F-score of 93.59% and kappa value of 92.06% respectively.
Table 1.
Result analysis of RCAL-BiLSTM model in terms of different performance measures.
| Classes | Sensitivity | Specificity | Precision | Accuracy | F-score | Kappa |
|---|---|---|---|---|---|---|
| ARDS | 92.83 | 94.76 | 94.90 | 96.86 | 92.58 | 90.49 |
| COVID-19 | 93.56 | 94.31 | 94.62 | 95.96 | 93.90 | 91.30 |
| No Finding | 93.21 | 94.87 | 94.89 | 93.91 | 92.80 | 91.74 |
| Pneumocystis | 93.30 | 94.84 | 95.17 | 93.06 | 92.64 | 91.40 |
| SARS | 93.50 | 94.28 | 94.92 | 94.59 | 93.59 | 92.06 |
| Average | 93.28 | 94.61 | 94.90 | 94.88 | 93.10 | 91.40 |
Figure 7.
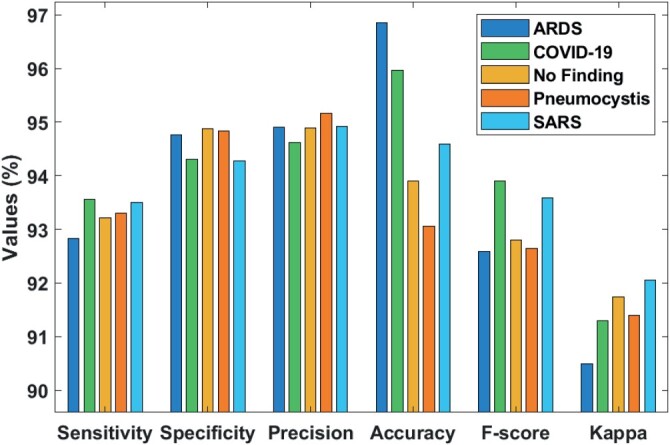
Classifier results analysis of RCAL-BiLSTM model.
Figure 8 shows the average the classifier results analysis of RCAL-BiLSTM model on the applied Chest X-ray dataset. The figure ensured that the RCAL-BiLSTM model has attained a maximum average sensitivity of 93.28%, specificity of 94.61%m precision of 94.90%, accuracy of 94.88%, F-score of 93.10% and kappa of 91.40% respectively.
Figure 8.
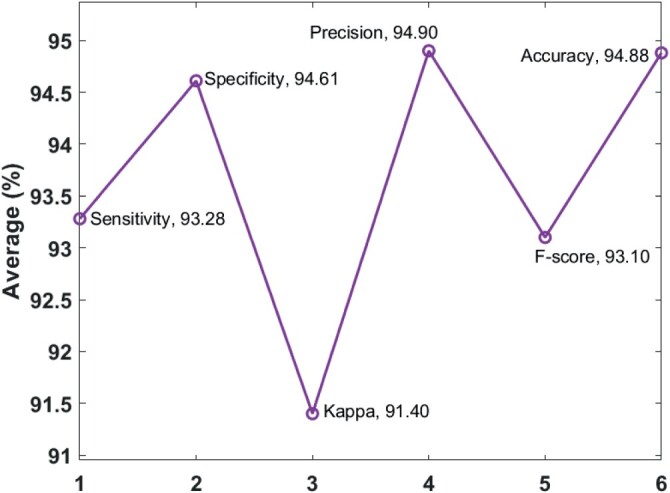
Classifier results analysis of RCAL-BiLSTM model.
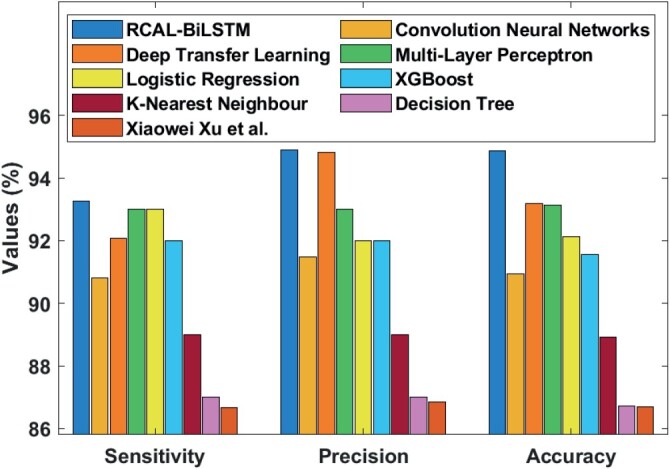
Table 2 and Figures 9 and 10 show the comparative analysis of the RCAL-BiLSTM model with existing methods. The figure portrayed that the method devised by Xiaowei Xu et al. is found to be an ineffective performance and attained a minimum sensitivity of 86.67%. Then, the DT model has showcased slightly better sensitivity value of 87% whereas even higher sensitivity value of 89% is achieved by the KNN model. Along with that, the CNN model has tried to show better results and ended up with the sensitivity value of 90.80%. Besides, the XGBoost model has depicted fairly high sensitivity value of 92%. In addition, the DTL model has demonstrated satisfactory results to a certain extent with the sensitivity value of 92.08%. Also, the MLP and LR models have exhibited better results over the earlier models by attaining a same sensitivity value of 93%. However, the presented RCAL-BiLSTM model has displayed effective classification outcome by attaining maximum sensitivity value of 93.28%.
Table 2.
Result analysis of existing methods with proposed methods.
| Models | Sensitivity | Specificity | Precision | Accuracy | F-score |
|---|---|---|---|---|---|
| RCAL-BiLSTM | 93.28 | 94.61 | 94.90 | 94.88 | 93.10 |
| CNN | 90.80 | 91.08 | 91.48 | 90.94 | – |
| DTL | 92.08 | 94.44 | 94.81 | 93.20 | – |
| MLP | 93.00 | – | 93.00 | 93.13 | 93.00 |
| LR | 93.00 | – | 92.00 | 92.12 | 92.00 |
| XGBoost | 92.00 | – | 92.00 | 91.57 | 92.00 |
| KNN | 89.00 | – | 89.00 | 88.91 | 89.00 |
| DT | 87.00 | – | 87.00 | 86.71 | 87.00 |
| Xiaowei Xu et al. | 86.67 | – | 86.86 | 86.70 | 86.70 |
Figure 9.
Comparative results analysis of RCAL-BiLSTM model.
Figure 10.
F-score analysis of RCAL-BiLSTM model.
The specificity analysis of the RCAL-BiLSTM with related techniques exposed that the CNN technique has shown poor results and get a particularly low specificity of 91.08%. Besides, the DTL method has aimed to exhibit improved outcome and obtained a sensitivity of 94.44%. On the other hand, the proposed RCAL-BiLSTM technique has shown better classifier results with the accuracy of 94.61%.
The precision analysis of the RCAL-BiLSTM with related techniques is exhibited that the technique invented by Xiaowei Xu et al. produces minimum efficiency and obtained 86.86% as precision rate. Next, the DT method has exposed little betterment in precision value of 87% while a high precision value of 89% is accomplished by KNN technique. Besides, the CNN technique has offered enhanced result and completed with the 91.48% precision value. Along with that, the XGBoost and LR technique have described quietly higher and same 92% of precision values. Moreover, the MLP technique has established an acceptable outcome to a definite precision of 93%. Furthermore, the DTL technique has shown a reasonable outcome compared to the previous technique by obtaining a 94.81% precision. At last, the proposed RCAL-BiLSTM technique has portrayed efficient classifier results by getting high precision of 94.90%.
The accuracy analysis of the RCAL-BiLSTM technique with other models demonstrated that the technique developed by Xiaowei Xu et al. established a low accuracy of 86.70%. In that case, the DT technique has exhibited an accuracy of 86.71% where the maximum accurate rate of 88.91% is got by the KNN technique. Besides, the CNN technique has aimed to give good outcome and finalized with 90.94% accuracy. Moreover, the XGBoost technique has illustrated reasonably maximum accuracy of 91.57%. Additionally, the LR method has confirmed better results to an assured amount with the 92.12% accuracy. Moreover, the MLP and DTL techniques have displayed satisfactory outcomes compared to former methods. On the other hand, the projected RCAL-BiLSTM technique has represented higher classifier results by achieving maximum accuracy of 94.88%.
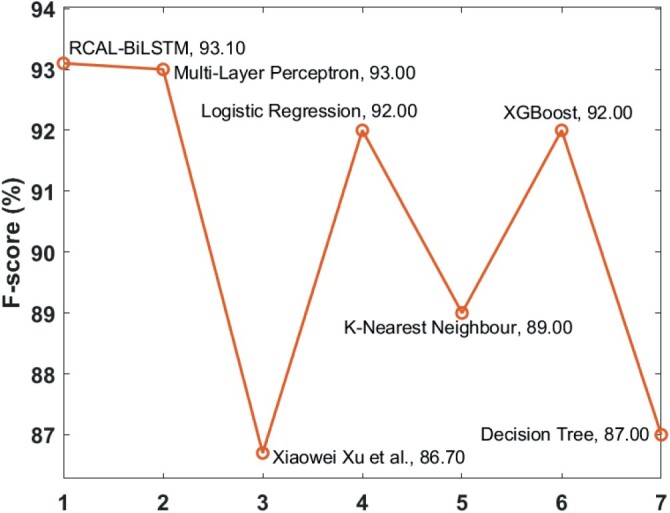
The F-score analysis of the RCAL-BiLSTM model and existing models in the COVID-19 diagnosis is shown in Figure 10. As depicted, the worse performed model is developed by Xiaowei Xu et al., which has obtained the least F-score of 86.70%. Also, the DT model has encountered high F-score value of 87% whereas an even higher F-score value of 89% is offered by the KNN model. Moreover, the XGBoost and LR models have portrayed a legitimately high and comparable F-score value of 92%. Furthermore, the MLP model has established reasonable performance to a particular level with the F-score value of 93%. But the presented RCAL-BiLSTM model has revealed effective classification result by reaching to a higher F-score value of 93.10%.
By observing the above-mentioned tables and figures, it is evident that the RCAL-BiLSTM model has outperformed all the other existing models in the diagnosis of COVID-19. The advantages of BF technique are robust, simplicity and flexibility. Followed by, RCAL-BiLSTM based feature extraction process takes place using three modules, namely ResNet based feature extraction, CAL, and Bi-LSTM modules. The application of CAL intends to capture the discriminative class-specific features whereas the Bi-LSTM module defines the class dependencies in both directions and generates structured multiple object labels. The choice of these techniques finds a way to achieve effective COVID-19 diagnosis performance.
5. Conclusion
This paper has developed a novel DL based RCAL-BiLSTM model for COVID-19 Diagnosis. The presented RCAL-BiLSTM model performs a series of steps namely BF based preprocessing, RCAL-BiLSTM based feature extraction, and SM based classification. The RCAL-BiLSTM based feature extraction process takes place using three modules, namely ResNet 152 based feature extraction, CAL, and Bi-LSTM modules. Primarily, ResNet model abstracts the fine grained semantic feature map, whereas the CAL anticipates capturing the discriminative class-based features. Thirdly, the Bi-LSTM module describes the class dependencies in both directions and generates structured object labels. Lastly, the SM layer is applied to sort the feature vectors into equivalent feature maps. The presented RCAL-BiLSTM model is tested on the Chest-X-Ray dataset and the results indicated that the RCAL-BiLSTM model has attained maximum sensitivity of 93.28%, specificity of 94.61%, precision of 94.90%, accuracy of 94.88%, F-score of 93.10% and kappa value of 91.40%. In the future, the presented method can be incorporated in real-time hospitals to predict and classify COVID-19 pandemic.
Acknowledgments
The authors would like to thank the anonymous reviewers for their critical and constructive comments, their thoughtful suggestions have helped improve this paper substantially. Irina V. Pustokhina is thankful to the Department of Entrepreneurship and Logistics, Plekhanov Russian University of Economics, Moscow, Russia. K. Shankar would like to thank RUSA PHASE Dept. of Edn. Govt. of India.
Disclosure statement
The authors declare that they have no conflict of interest. The manuscript was written through contributions of all authors. All authors have given approval to the final version of the manuscript.
References
- 1.Albrecht A., Hein E., Steinhöfel K., Taupitz M., and Wong C.K., Bounded-depth threshold circuits for computer-assisted CT image classification. Artif. Intell. Med. 24 (2002), pp. 179–192. [DOI] [PubMed] [Google Scholar]
- 2.Chen C.L., Yang T.T., Deng Y.Y., and Chen C.H., A secure IoT medical information sharing and emergency notification system based on non-repudiation mechanism. Trans. Emer. Telecom. Technol. (2020), pp. 1–21. [Google Scholar]
- 3.Gao M., Bagci U., Lu L., Wu A., Buty M., Shin H.C., Roth H., Papadakis G.Z., Depeursinge A., Summers R.M., Xu Z., and Mollura D.J., Holistic classification of CT attenuation patterns for interstitial lung diseases via deep convolutional neural networks. Comp. Methods Biomech. Biomed. Eng. Imag. Visual. 6 (2018), pp. 1–6. [DOI] [PMC free article] [PubMed] [Google Scholar]
- 4.Greenspan H., Van Ginneken B., and Summers R.M., Guest editorial deep learning in medical imaging: Overview and future promise of an exciting new technique. IEEE Trans. Med. Imag. 35 (2016), pp. 1153–1159. [Google Scholar]
- 5.Hamimi A., MERS-CoV: Middle East respiratory syndrome corona virus: Can radiology be of help? Initial single center experience. The Egyptian J. Radiol. Nucl. Med. 47 (2016), pp. 95–106. [Google Scholar]
- 6.He K., Zhang X., Ren S., and Sun J., Deep Residual Learning for Image Recognition. arXiv.org, 2015.
- 7.Homem M.R.P., Mascarenhas N.D.A., and Cruvinel P.E., The linear attenuation coefficients as features of multiple energy CT image classification. Nucl. Instrum. Methods Phys. Res., Sect. A 452 (2000), pp. 351–360. [Google Scholar]
- 8.Hossain Mondal M.R., Bharati S., Podder P., and Podder P., Data analytics for novel coronavirus disease. Informatics in Medicine Unlocked (2020). doi: 10.1016/j.imu.2020.100374. [DOI] [PMC free article] [PubMed] [Google Scholar]
- 9.Hua Y., Mou L., and Zhu X.X., Recurrently exploring class-wise attention in a hybrid convolutional and bidirectional LSTM network for multi-label aerial image classification. ISPRS. J. Photogramm. Remote. Sens. 149 (2019), pp. 188–199. [DOI] [PMC free article] [PubMed] [Google Scholar]
- 10.Lakshmanaprabu S.K., Mohanty S.N., Shankar K., Arunkumar N., and Ramirez G., Optimal deep learning model for classification of lung cancer on CT images. Future Gener. Comput. Syst. 92 (March 2019), pp. 374–382. [Google Scholar]
- 11.Long F., Zhou K., and Ou W., Sentiment analysis of text based on bidirectional LSTM with multi-head attention. IEEE. Access. 7 (2019), pp. 141960–141969. [Google Scholar]
- 12.Lu Z., Bai Y., Chen Y., Su C., Lu S., Zhan T., Hong X., and Wang S., The classification of Gliomas based on a pyramid dilated convolution ResNet model. Pattern Recognit. Lett. 133 (2020), pp. 173–179. [Google Scholar]
- 13.Ozyurt F., Tuncer T., Avci E., Koc M., and Serhatlioglu I., A novel liver image classification method using perceptual hash-based convolutional neural network. Arab. J. Sci. Eng. 44 (2019), pp. 3173–3182. [Google Scholar]
- 14.Pathak Y., Shukla P.K., Tiwari A., Stalin S., Singh S., and Shukla P.K., Deep transfer learning based classification model for COVID-19 disease. IRBM (2020), pp. 1–6. [DOI] [PMC free article] [PubMed] [Google Scholar]
- 15.Pustokhina I.V., Pustokhin D.A., Gupta D., Khanna A., Shankar K., and Nguyen G.N., An effective training scheme for deep neural network in edge computing enabled internet of medical things (IoMT) systems. IEEE. Access. 8 (December 2020), pp. 107112–107123. [Google Scholar]
- 16.Raj J.S., Jeya Shobana S., Pustokhina I.V., Pustokhin D.A., Gupta D., and Shankar K., Optimal feature selection based medical image classification using deep learning model in internet of medical things. IEEE. Access. 8 (December 2020), pp. 58006–58017. [Google Scholar]
- 17.Shan F., Gao Y., Wang J., Shi W., Shi N., Han M., Xue Z., and Shi Y., Lung Infection Quantification of COVID-19 in CT Images with Deep Learning. arXiv preprint arXiv:2003.04655, pp. 1–19, 2020.
- 18.Shankar K., Elhoseny M., Lakshmanaprabu S.K., Ilayaraja M., Vidhyavathi R.M., and Alkhambashi M., Optimal Feature Level Fusion Based ANFIS Classifier for Brain MRI Image Classification, Concurrency and Computation: Practice and Experience – Wiley, August 2018, in press: doi: 10.1002/cpe.4887 [DOI] [Google Scholar]
- 19.Shankar K., Lakshmanaprabu S.K., Khanna A., Tanwar S., Rodrigues J.J.P.C., and Roy N.R., Alzheimer detection using group grey wolf optimization based features with convolutional classifier. Comput. Electr. Eng. 77 (July 2019), pp. 230–243. [Google Scholar]
- 20.Sorensen L., Loog M., Lo P., Ashraf H., Dirksen A., Duin R.P., and De Bruijne M., Image Dissimilarity-Based Quantification of Lung Disease from CT, International Conference on medical image computing and Computer-Assisted Intervention (pp. 37–44), Springer, Berlin, Heidelberg, 2010, September. [DOI] [PubMed] [Google Scholar]
- 21.Source: Available at https://github.com/ieee8023/covid-chestxray-dataset.
- 22.Stoecklin S.B., Rolland P., Silue Y., Mailles A., Campese C., Simondon A., Mechain M., Meurice L., Nguyen M., Bassi C., Yamani E., Behillil S., Ismael S., Nguyen D., Malvy D., Lescure F.X., Georges S., Lazarus C., Tabaï A., Stempfelet M., Enouf V., Coignard B., Levy-Bruhl D., and Team I., First cases of coronavirus disease 2019 (COVID-19) in France: Surveillance, investigations and control measures. Eurosurveillance 25 (January 2020), p. 2000094. [DOI] [PMC free article] [PubMed] [Google Scholar]
- 23.Wang S., Kang B., Ma J., Zeng X., Xiao M., Guo J., Cai M., Yang J., Li Y., Meng X., and Xu B., A Deep Learning Algorithm using CT Images to Screen for Corona Virus Disease (COVID-19). medRxiv preprint. 10.1101/2020.02.14.20023028, pp. 1–26, 2020. [DOI] [PMC free article] [PubMed]
- 24.Xie X., Li X., Wan S., and Gong Y., Mining X-ray images of SARS patients, in Data Mining: Theory, Methodology, Techniques, and Applications, Williams G.J., Simoff S.J., eds., ISBN: 3540325476, Springer-Verlag, Berlin, Heidelberg, 2006. pp. 282–294. [Google Scholar]
- 25.Xu G., Cao H., Udupa J.K., Yue C., Dong Y., Cao L., and Torigian D.A., A novel exponential loss function for pathological lymph node image classification, in MIPPR 2019: Parallel Processing of Images and Optimization Techniques; and Medical Imaging, International Society for Optics and Photonics, Wuhan, China, 2020, February, Vol. 11431, p. 114310A. [Google Scholar]
- 26.Xu X., Jiang X., Ma C., Du P., Li X., Lv S., Yu L., Chen Y., Su J., and Lang G., Deep Learning System to Screen Coronavirus Disease 2019 Pneumonia. arXiv 2020. arXiv preprint arXiv:2002.09334. [DOI] [PMC free article] [PubMed]
- 27.Xu X., Jiang X., Ma C., Du P., Li X., Lv S., Yu L., Chen Y., Su J., Lang G., Li Y., Zhao H., Xu K., Ruan L., and Wu W., Deep Learning System to Screen Coronavirus Disease 2019 Pneumonia. arXiv preprint arXiv:2002.09334, pp. 1–29, 2020. [DOI] [PMC free article] [PubMed]
- 28.Yang X., Sechopoulos I., and Fei B., Automatic tissue classification for high-resolution breast CT images based on bilateral filtering, in Medical Imaging 2011: Image Processing, International Society for Optics and Photonics, Florida, USA, 2011, March, Vol. 7962, p. 79623H. [DOI] [PMC free article] [PubMed] [Google Scholar]
- 29.Zhang W.L. and Wang X.Z., Feature Extraction and Classification for Human Brain CT Images, 2007 International Conference on Machine learning and Cybernetics (Vol. 2, pp. 1155–1159). IEEE, 2007, August. [Google Scholar]


