Abstract
A strategy was proposed to analyze bovine milk oligosaccharides using p-aminobenzoic ethyl ester (ABEE) closed-ring labeling and C18 capillary liquid chromatography negative ion electrospray tandem mass spectrometry. Linkage specific fragment ions were used to identify oligosaccharide isomers. By constructing the mass chromatograms using linkage specific fragment ions, isomers were differentiated based on m/z values as well as temporal separation provided by liquid chromatography. In addition to disialyllactose and the single isomer lacto-N-neohexaose, four pairs of linkage isomers including 3′/6′-sialyllactose (3′/6′-SL), 3′/6′-sialyllactosamine (3′/6′-SLN), 3′/6′-sialylgalactosyl-lactose (3′/6′-SGL), and lacto-N-tetraose/lacto-N-neotetraose (LNT/LNnT) in bovine milk were investigated. Variations of bovine milk oligosaccharides in a lactation period of 72 h after calving were studied. Sialylated oligosaccharide was found to be distinctively more abundant in milk of the first 24 h, decreasing in successive milkings. For the first time, the variation of lacto-N-tetraose in bovine milk was reported.
Keywords: Bovine milk, Closed-ring labeling, Mass spectrometry, Oligosaccharides, p-aminobenzoic ethyl ester
1. Introduction
Milk is produced by the mammary glands as the primary source of nutrition for young mammals. Being a dominant component in milk, milk oligosaccharides have been recognized for their significant biological roles. The bioactive properties include the prebiotic activity to establish the intestinal flora by stimulating the growth of beneficial bacteria, and the act as free receptors that bind to pathogenic organisms in the gastrointestinal tract of the newborns [1–3].
Bovine milk is composed of a complex mixture of isomeric oligosaccharides. Compared to human milk, they are less abundant but have been reported with the structural similarity [4]. Therefore, bovine milk could be a reasonable source of milk oligosaccharides for infants, and they have been common ingredients in infant formula. To characterize oligosaccharides in bovine milk, high performance anion exchange chromatography (HPAEC) [5] and high performance liquid chromatography (HPLC) using NH2 or amide normal phase [6,7], porous graphitized carbon material [4] have been utilized in the analysis of bovine milk oligosaccharides. Coupling HPLC with the conventional optical detector, oligosaccharide could be detected in its native form [6]. Derivatization using an ultraviolet-absorbing or fluorescent molecule has been utilized to increase the optical detection sensitivity of sialylated and neutral oligosaccharides [7,8]. However, ambiguity in identification might occur if structural standards were not available.
Mass spectrometry (MS) offers the advantages of structure characterization and high confidence confirmation. A MS based technique has been developed using a nano-LC chip coupled with high resolution time-of-flight MS detector (HPLC-chip/TOF MS) to rapidly profile oligosaccharides from bovine milk [4]. The reproducible nano-chip LC separation and TOF MS exact mass measurement provided the identification of a total of 40 oligosaccharides.
In addition to high resolution MS, tandem MS analysis is also very powerful in elucidating oligosaccharide structures [4,8]. Information about isomeric structures could be obtained when native oligosaccharides were subject to negative ion ESI-MS. For example, Fong et al. has developed a HPLC/MS/MS method using hydrophilic interaction chromatography (HILIC) [8]. Based on separation and the specific fragment ions, six oligosaccharides in bovine milk were studied, including the two well-discussed sialylated isomer pairs: 3′- and 6′-sialyllactose (3SL and 6SL) and 3′- and 6′-sialyllactosamine (3SLN and 6SLN). In addition to native oligosaccharides, reducing-end labeled oligosaccharides have also been studied by tandem MS [9–13]. In addition to the increasing detection sensitivity when using an optical detector, the chromophore-labeled derivatives simultaneously enhance HPLC separation efficiency and MS ionization efficiency. Several derivatives including 2-aminopyridine (2-AP) [9], p-aminobenzoic acid ethyl ester (ABEE) [14,15] and trimethyl ( p-aminophenyl) amino (TMAPA) [10] have been reported. In structural analysis of oligosaccharides using ABEE derivative, we have shown that closed-ring derivatives (glycosylamines) provided greater structural information than the popular opened-ring approach (reductive amination) [11]. The ABEE closed-ring labeling has successfully differentiated linkage and branch structures of disaccharides and a variety of linear and branched oligosaccharides [11,13].
Characterization of variations in oligosaccharides might gain important insights in defining its biological roles. To characterize variations in oligosaccharides, bovine milk oligo-saccharides at different lactation stage after calving have been studied by MS based techniques [9,16,17]. Significant variation was observed at different stage of lactation. In this report, bovine milk oligosaccharides were closed-ring labeled with ABEE and analyzed using capillary LC-negative ion ESI tandem MS. Linkage specific fragment ions were detected for different structural isomers. As a result, isomer differentiation was achieved based on HPLC separation and linkage specific fragment ions. The analytical strategy was demonstrated and changes in bovine milk oligosaccharides collected within 72 h postpartum were studied.
2. Materials and methods
2.1. Materials and reagents
6′-Sialyllactose (6SL), disialyllactose (DSL), Glcα1–6Glcα1–4Glcα1–4Glc (Glc4), ethanol, trifluoroacetic acid (TFA), ammonium bicarbonate (ABC) and p-aminobenzoic ethyl ester (ABEE) were purchased from Sigma-Aldrich (St. Louis, MO, USA). 3′-Sialyllactose (3SL), lacto-N-tetraose (LNT) and lacto-N-hexaose (LNH) were purchased from ProZyme (Hayward, CA). 3′-Sialyllactosamine (3SLN) and 6′- sialyllactosamine (6SLN) were purchased from Dextra Laboratories (Reading, UK). Methyl sulfoxide (DMSO) was purchased from Acros (Geel, Belgium). Glacial acetic acid was purchased from Fisher Scientific (Loughborough, UK). Acetonitrile (ACN) was purchased from J.T. Baker (Philipsburg, NJ, USA). Deionized water (Milli-Q water system, Millipore, Bedford, MA, USA) was used in the preparation of all samples and buffer solution.
2.2. Samples
Commercial mature milk was bought from a supermarket. Postpartum colostrum was collected at 24, 48 and 72 h of milking after calving from a single Friesian cow (Experimental Farm, National Taiwan University, Taiwan). Colostrum samples were frozen at −80 °C after collection.
2.3. Extraction and purification of oligosaccharides in bovine milk
The extraction and purification of oligosaccharides in bovine milk was conducted using a previously described method with slight modifications [18]. After the milk sample was completely thawed, 100 μL bovine milk was diluted by adding 2 vol of deionized water. The sample was defatted by centrifugation at 5000×g for 30 min at 4 °C. The upper layer was carefully transferred and added with two volumes of ethanol. The mixture was incubated at 4 °C overnight, followed by centrifugation at 5000×g for 30 min at 4 °C to remove the precipitated proteins. The supernatant containing oligosaccharides were dried and purified by solid-phase extraction using a graphitized carbon cartridge (250 mg bed weight, 3-mL tube capacity, Restek, Bellefonte, PA). Each cartridge was conditioned with 3 mL 80% ACN with 0.5% TFA and 1.5 mL H2O before sample loading. The sample was dissolved in 200 μL H2O and applied to the cartridge for two times. Salts were removed by washing the cartridge with 10 mL H2O. Oligosaccharides were eluted with 3 mL 5% ACN and 1.5 mL 40% ACN. The 5% ACN portion was discarded to remove lactose, and the 40% ACN of oligosaccharide portion was collected and lyophilized.
2.4. Preparation of closed-ring chromophore labeled derivatives
Extracted bovine milk oligosaccharides were ABEE closed-ring labeled using the glycosylamine approach [19]. Dried oligosaccharides were added to 50 μL of 0.35 M ABEE solution in a 3:7 mixture of glacial acetic acid and DMSO (vol/vol). The solution was incubated at 65 °C for 10 h. The derivatives were purified by passing through an Oasis HLB cartridge (Waters, Milford, MA). Briefly, the cartridge rinsed with 1 mL of ACN, and equilibrated with 1 mL of ddH2O. Then, the ABEE closed-ring labeled sample (dissolved in 200 μL ddH2O) was added into the cartridge with <1 mL/min of flow rate. This step was repeated twice. After that, the cartridge desalted with 1 mL of ddH2O, and eluted with 15% ACN, followed by lyophilization.
2.5. LC-MS
The capillary LC (Cap LC) system was set up based on a published method [20]. The system consisted of two model LC-10AD pumps (Shimadzu, Kyoto, Japan), two six-port switching valves (Rheodyne, Cotati, CA), a precolumn (100 μm i.d. × 1.5 cm C18 fused-silica capillary) and a separation column (75 μm i.d. × 10 cm C18 fused-silica capillary). The separation column was tapered and served as the ESI emitter. The oligosaccharide sample (5 μL) was injected into the pre-column under a flow rate of 5 μL/min in 100% solvent A (20 mM ABC) for 5 min to wash out excessive salts. The separation was performed using a linear gradient from 0 to 50% solvent B (ACN) in 20 min, and washed with 85% B for 20 min. The separation flow rate was 300 nL/min from HPLC pumps with a split ratio of ~350:1. All the mass spectrometry experiments were performed on a LTQ linear ion trap mass spectrometer (Finnigan Corp., San Jose, CA). The heated capillary was maintained at 225 °C to reduce oligosaccharide in source fragmentation. For collision induced dissociation (CID), precursor ion isolation window was 5 m/z and normalized collision energy was in the range of 15%–30%. The MRM transitions used were m/z 779 → 408, 494, 536 for 3SL; m/z 779 → 350, 380, 410 for 6SL; m/z 820 → 408, 494, 536 for 3SLN; m/z 820 → 350, 380, 410 for 6SLN; m/z 941 → 570, 656, 698 for 3SGL; m/z 941 → 674, 716 for 6SGL; m/z 853 → 382 → 202 for LNT; m/z 853 → 382 → 263, 281 for LNnT; m/z 1218 → 526, 951 for LNnH; m/z 1070 → 779 for DSL.
3. Results and discussion
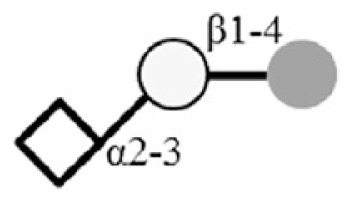
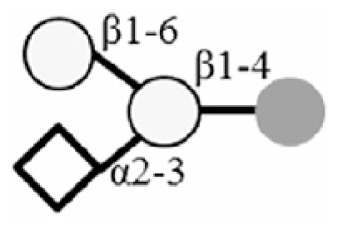
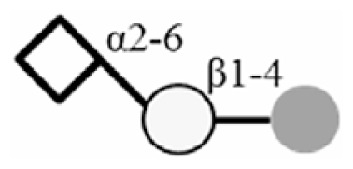
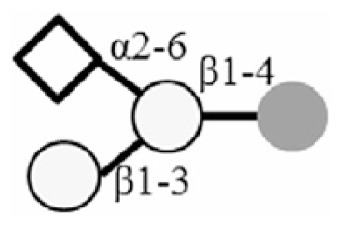
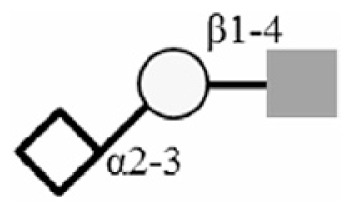
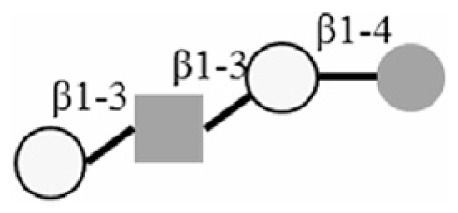
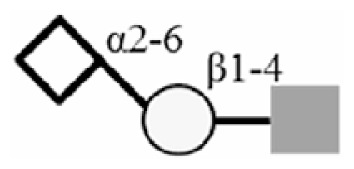
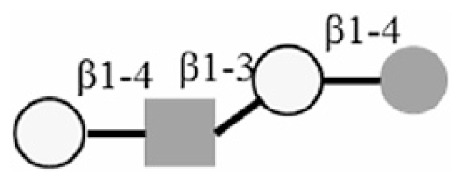
Sialylated oligosaccharides are the most abundant oligosaccharides in bovine milk and have been given great interest. Among the sialylated sugars, 3′/6′-sialyllactose (3SL/6SL), 3′/6′-sialyllactosamine (3SLN/6SLN), and disialyllactose (DSL) received the most attention. It was not only because of the higher abundances, but also the evidences involving in the pathogen to host adhesion [21,22]. Another abundant sialylated isomer pair was 3′/6′-sialylgalactosyllactose (3SGL/6SGL). In addition to sialylated oligosaccharide, neutral oligosaccharide containing N-acetylhexosamine (HexNAc) was the other main class oligosaccharide. Because of the link between bovine milk and human milk, Lacto-N-tetraose/Lacto-N-neotetraose (LNT/LNnT) and lacto-N-hexoase/lacto- N-neohexoase (LNH/LNnH) isomer series have been discussed. In this study, among the oligosaccharides described above, except LNH, ten oligosaccharides (Table 1) were detected in bovine milk collected within 72 h postpartum.
Table 1.
Oligosaccharide structures.
| Structure | Structure | ||
|---|---|---|---|
| 3SL |
|
3SGL |
|
| 6SL |
|
6SGL |
|
| 3SLN |
|
LNT |
|
| 6SLN |
|
LNnT |
|
| DSL |
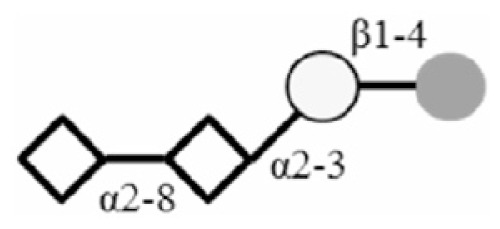
|
LNnH |
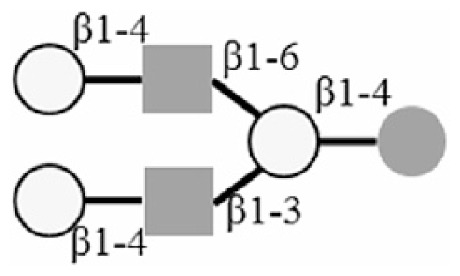
|
 : Glc
: Glc
 : Gal
: Gal
 : GlcNAc
 : Neu5Ac.
3.1. Method development with standard samples
3.1.1. The analysis of 3SL, 6SL, 3SLN and 6SLN
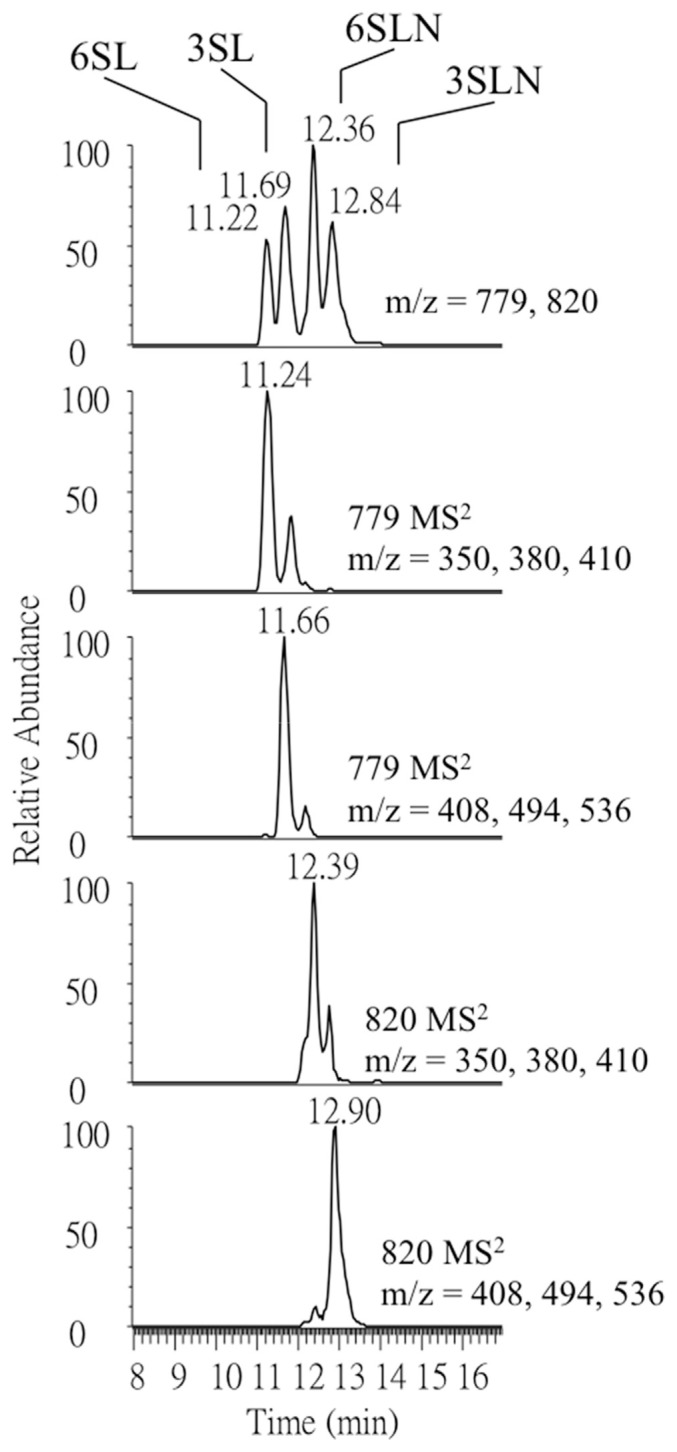
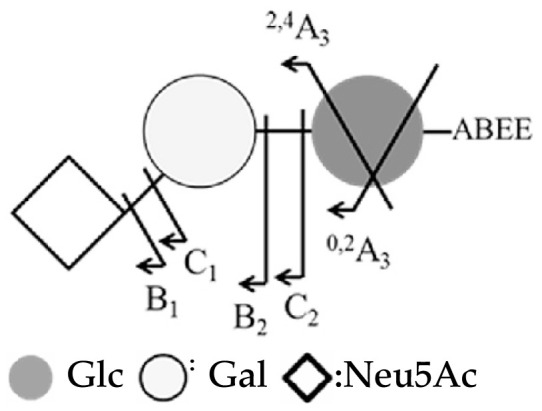
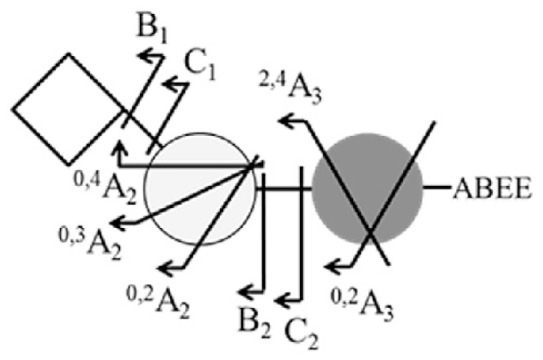
Sialic acid typically existed in two kinds of linkage arrangements, α2–3 and α2–6. To distinguish the sialic acid linkage by MS, the isomer standards 3SL, 6SL, 3SLN, 6SLN were ABEE-labeled and analyzed using negative ion ESI-MS2. The fragment ions are summarized in Table 2. The assignment was based on the fragmentation pathways proposed by Wheeler and Harvey [23]. The fragment ion 0,2A3 - 18 (m/z 554) indicated that the linkage on reducing end was a 1–4 linkage. For the terminal linkage, a set of linkage fragment ions 0,4A2 (m/z 350), 0,3A2 (m/z 380), 0,2A2 (m/z 410) indicated a 2–6 linkage. Whereas, fragment ions B2–CO2 (m/z 408), 2,4A3 - H2O (m/z 494), 0,2A3 - 2H2O (m/z 536) indicated a 2–3 linked sialic acid.
Table 2.
Summaries of fragment ions of ABEE-labeled 3, 6SL and 3, 6SLN using negative ion ESI-MS2. aDomon and Costello nomenclature for carbohydrate fragmentation was used [28].
| Structure | 3SL (3SLN) | 6SL (6SLN) | |
|---|---|---|---|
|
|
|
||
|
|
||
| MS2 fragment | m/z | ||
| 0,2 A 3 | 572 | ||
| 0,2A3 − H2O | 554 | ||
| 0,2A3 − 22H2O | 536 | ||
| 2,4 A 3 | 512 | ||
| 2,4A3 − H2O | 494 | ||
| C 2 | 470 | ||
| 2,4A3 − CO2 | 468 | ||
| B 2 | 452 | ||
| B2 − H2O | 434 | ||
| 0,2 A 2 | 410 | ||
| B2 − CO2 | 408 | ||
| 0,3 A 2 | 380 | ||
| 0,4 A 2 | 350 | ||
| C 1 | 308 | ||
| 0,4A2 − CO2 | 306 | ||
| B 1 | 290 | ||
| B1 − H2O | 272 |
In this study, a C18 reversed phase column was used for the separation and the result in the analysis of SL and SLN isomers is shown in Fig. 1. By constructing the mass chromatogram using linkage specific fragment ions, isomers were differentiated based on compound specific fragments in addition to temporal separation provided by LC. This method provides good precision. The relative standard deviation (RSD) for SL and SLN was found all under 10% (5%–9%). Because the labeling reaction was a closed ring approach, a minor peak was detected for each compound [24] as shown in Fig. 1. The satellite peaks may affect the absolute quantitation but is believed to have minimal effect in study the relative change of each oligo-saccharide after calving.
Fig. 1.
Negative ion ESI-MS1 and MS2 mass chromatograms of ABEE-labeled SL and SLN standards.
3.1.2. The analysis of 3SGL and 6SGL
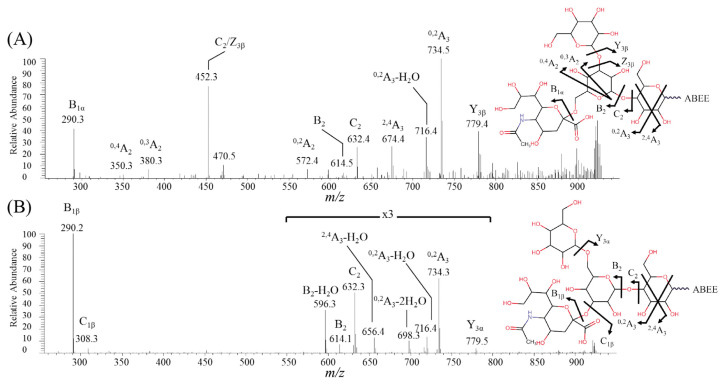
Isomers 3SGL and 6SGL share a core structure of lactose but differ by the branch sugars, α2–3Neu5Ac, β1–6Gal in 3SGL and α2–6Neu5Ac, β1–3Gal in 6SGL [25]. SGL have been reported in bovine milk [4,26,27]. Unlike SLs and SLNs, SGLs standards were not commercially available. Therefore, ions corresponding to the molecule ion of SGL were used for isomer assignment. Two peaks corresponding to the molecule ion of SGL (m/z 941) were observed in the analysis of oligosaccharides in bovine milk. The product ion mass spectra of these two peaks are shown in Fig. 2. The detection of the B2 (m/z 614), C2 (m/z 632), and 0,2A3 - H2O (m/z 716) ions in both spectra (Fig. 2A and B) suggested that the reducing sugar was a 1–4 linked Hex. The loss of a hexose (Y3α or Y3β, m/z 779) and observation of a terminal sialic acid (B1α or B1β, m/z 290) suggested that a Hex and a Neu5Ac were connected to the branch sugar. In MS2 spectrum of the early eluting isomer (Fig. 2A), fragment ions 0,4A2 (m/z 350) and 0,3A2 (m/z 380) indicated a α2–6 linked sialic acid. This suggested that the first peak has the structure of 6SGL. Ions related to α2–3 linked sialic acid, 2,4A3 - H2O (m/z 656) and 0,2A3 - 2H2O (m/z 698) were observed in the MS2 spectrum of the late eluting peak (Fig. 2B). As a result, the second peak in the pair was assigned as 3SGL.
Fig. 2.
Negative ion ESI-MS2 spectra of (A) the early eluting isomer (6SGL) and (B) the late eluting isomer (3SGL) in bovine milk.
3.1.3. The analysis of LNT and LNnT
In the analysis of oligosaccharides in bovine milk, two oligo-saccharides consisting of three hexoses and one hexosamine (m/z 853) were observed. The negative ion ESI-MS2 (data not shown) of these two oligosaccharides suggested the sequence of Hex-HexNAc-Hex-Hex. Linkage specific fragment ions proposed for ABEE-labeled neutral oligosaccharides [13] were used in the structural assignment. The observation of 0,2A4 - 18 (m/z 628) ion and the absence of closed-ring cleavage ions between C3 (m/z 544) and C2 (m/z 382) suggested that the first and second linkage was a 1–4 and 1–3 linkage, respectively. To differentiate LNT and LNnT, the C2 (m/z 382) ion was subjected to MS3 analysis and the spectra are shown in Fig. S1. In Fig. S1A, the fragment ions 0,2A2 - H2O (m/z 263) and 0,2A2 (m/z 281) suggested that the terminal linkage was a 1–4 linkage. This assignment suggested that the first peak has the structure of LNnT. The observation of a terminal 1–3 linked fragment ion (Z1, m/z 202) in Fig. S1B suggested that the second peak has the structure of LNT. The fragment ion were the same as LNT standard (Fig. S1C). LNnT was the only isomer reported in bovine milk. The observation of Z1 ion at m/z 202 suggested that the isomer LNT might also present in bovine milk.
3.1.4. The analysis of LNH and LNnH
Only one peak corresponding to the molecule ion of LNH/LNnH (m/z 1218) was detected. Negative ion ESI-MS2 of m/z 1218 and MS3 spectra of the C2 (m/z 382) ion are shown in Fig. S2. The detection of 0,2A2 (m/z 281) and 0,2A2 - H2O (m/z 263) ions in MS3 spectra of the C2 ion suggested that the terminal was 1–4 linked. This assignment was consistent with the structure of LNnH. Because of the absence of 1–3 linked ions C3/Z3β (m/z 729) and C3/Y3β (m/z 747) in the MS2 spectra and the absence of Z1 (m/z 202) ion in MS3 spectra of C2 ion, the other isomer, LNH was not detected in bovine milk.
3.2. Real sample analysis
3.2.1. Oligosaccharides in bovine milk
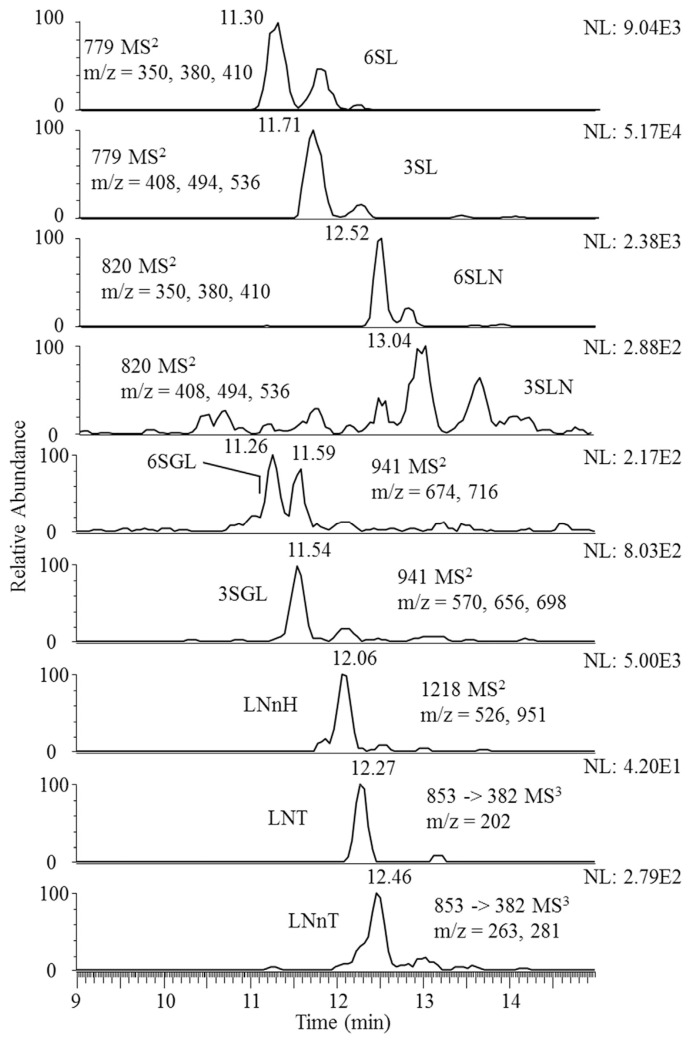
Oligosaccharides in commercial mature bovine milk were analyzed using this approach. The result is shown in Fig. 3. Oligosaccharides 3SL, 6SLN and 3SGL were found to be the dominant isomer in the pair (SLs, SLNs, SGLs), with 3SL being the most abundant oligosaccharide in bovine milk. The difference in abundance appeared to be quite substantial. To improve the detection of the minor isomer 6SGL, the high abundance fragment ions 2,4A3 and 0,3A3 - H2O were used to construct the mass chromatogram of 6SGL. For the detection of LNnT and LNT, linkage specific ions from MS3 (0,2A2 - H2O, 0,2A2 for LNnT and Z1 for LNT) were used. For LNnH, because only one isomer was detected, the high abundance fragment ions C3/Z2β and 2,4A4 were used to construct the mass chromatogram.
Fig. 3.
Mass chromatograms of oligosaccharides in bovine milk.
3.2.2. Variations of oligosaccharide concentrations after calving
Oligosaccharides were extracted from the milk samples before labeling and LC-MS analysis. Initial dilution of milk sample was found to greatly facilitate the separation of top lipid layer and bottom protein and debris during the centrifugation, resulting in a clear middle layer [18]. We therefore eliminated chloroform/methanol liquid-liquid extraction step that was normally carried out after the remove of lipid layer [4,7,8,16,17]. This modified extraction procedure resulted in a 5 to 7-fold extraction efficiency improvement compared to the undiluted milk (Fig. S3). Using bovine milk spiked with milk-free oligosaccharide Glc4, the repeatability (relative standard deviation) of the sample pretreatment was found to be about 8%.
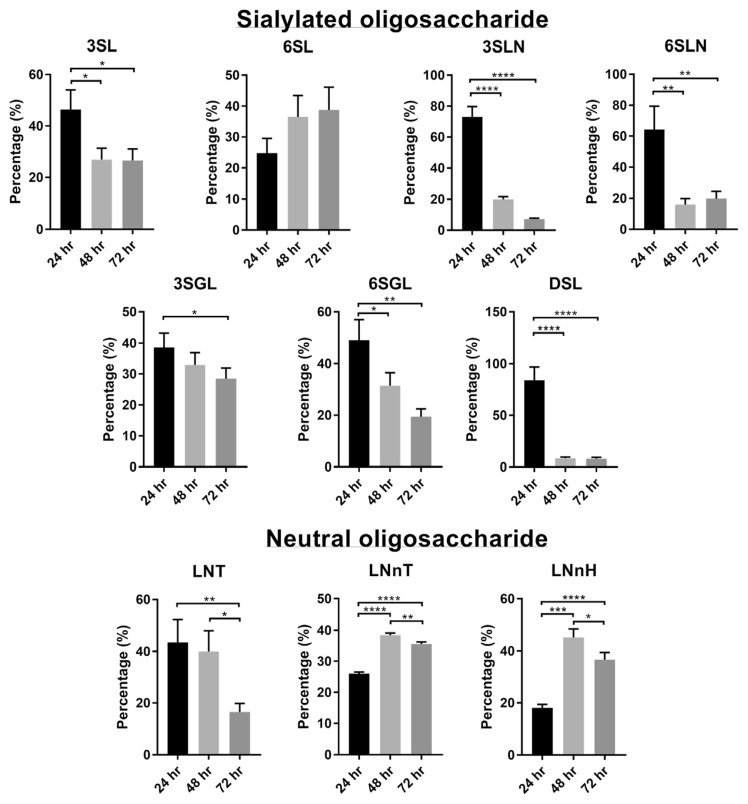
Variation of oligosaccharide in lactation period was investigated based on oligosaccharide’s percentages. The disialylated oligosaccharide DSL that has 2 Neu5Ac connected linearly was studied using the high abundance fragment ion Z3. The results of these oligosaccharides in 24, 48 and 72 h of colostrum samples with technical triplicates are shown in Fig. 4, and their mass chromatograms are illustrated in Fig. S4. The mass chromatograms in SIM mode showing the curve combining all carbohydrates together are illustrated in Fig. S5. We found that sialylated oligosaccharide was distinctively more abundant in milk of the first 24 h, decreasing in successive milkings. The most drastic decrease was observed on DSL, which dropped to about 10% after the first day. For most sialylated oligosaccharides, a decrease in abundance was clearly observed through the 72 h. This observation was in consistent with studies reported earlier [5,7,8,17]. The only sialylated oligosaccharide without a clear trend of decreasing was 6SL. The variation trend of 6SL was not conclusive [7,17]. This deviation has been suggested resulting from individual animal variation such as breed, nutrition, lactation number and accommodation [17].
Fig. 4.
Variation of oligosaccharides after 24, 48, and 72 h of lactation.
Compared to sialylated oligosaccharides, there were fewer studies on variation of neutral oligosaccharides in bovine milk. We found that both LNnT and LNnH increased slightly after 72 h postpartum. Our observation is consistent with a previous report [17]. These neutral oligosaccharides didn’t present in significant abundance in early day of lactation, and the abundance didn’t decrease greatly along lactation.
We reported first time the variation of LNT in bovine milk. Possibly due to its very low abundance, LNT hasn’t been re-ported in bovine milk. The abundance was found to decrease slightly after calving.
In this work, linkage specific fragment ions were used to detect oligosaccharide isomers in bovine milk. Closed-ring labeled with an ABEE group provided the advantage not only in facilitating isomer separation on C18 LC column, but also in structural assignment of the isomers. By using the linkage fragment ions, the detection was largely improved especially for the minor isomer. The study of oligosaccharides after calving indicated that sialylated oligosaccharides were distinctively more abundant in milk of the first 24 h. The concentration of the sialylated oligosaccharides decreased rapidly in successive days.
Acknowledgments
Thiswork was financially supported by theMinistry of Science and Technology and the Advanced Plant Biotechnology Center from The Featured Areas Research Center Program within the framework of the Higher Education Sprout Project by the Ministry of Education (MOE) in Taiwan, R.O.C. The authors declare no financial or commercial conflict of interest.
Abbreviations
- 2-AP
2-aminopyridine
- 3′/6′-SGL
3′/6′-sialylgalactosyl-lactose
- 3′/6′-SL
3′/6′-sialyllactose
- 3′/6′-SLN
3′/6′-sialyllactosamine
- 3SL
3′-sialyllactose
- 3SLN
3′-sialyllactosamine
- 6SL
6′-sialyllactose
- 6SLN
6′-sialyllactosamine
- ABC
ammonium bicarbonate
- ABEE
p-aminobenzoic ethyl ester
- ACN
acetonitrile
- Cap
LC capillary LC
- CID
collision induced dissociation
- DMSO
methyl sulfoxide
- DSL
disialyllactose
- Glc4
Glcα1–6Glcα1–4Glcα1–4Glc
- HexNAc
N-acetylhexosamine
- HILIC
hydrophilic interaction chromatography
- HPAEC
high performance anion exchange chromatography
- HPLC
high performance liquid chromatography
- HPLC-chip/TOF MS
nano-LC chip coupled with high resolution time-of-flight MS detector
- LNH
lacto-N-hexaose
- LNnT
lacto-N-neotetraose
- LNT
lacto-N-tetraose
- MS
Mass spectrometry
- RSD
relative standard deviation
- TFA
trifluoroacetic acid
- TMAPA
trimethyl(p-aminophenyl)amino
Appendix A.
Negative ion ESI-MS3 spectra of C2 fragment (m/z 382) of (A) the late eluting isomer (LNnT) and (B) the early eluting isomer (LNT) in bovine milk, and (C) LNT standard.
Negative ion ESI-MS2 spectra of the m/z 1218 ion (LNnH/LNH) in bovine milk. The inset shows the MS3 spectrum of the C2 fragment.
The full-scan spectra of oligosaccharide extraction procedures of (A) no sample dilution, (B) sample dilution with 1× volume of water, and (C) 2× volume of water.
Mass chromatograms of oligosaccharides in 48 h of colostrum sample.
Mass chromatograms in SIM mode of oligosaccharides in 48 h of colostrum sample.
Funding Statement
This work was financially supported by the Ministry of Science and Technology and the Advanced Plant Biotechnology Center from The Featured Areas Research Center Program within the framework of the Higher Education Sprout Project by the Ministry of Education (MOE) in Taiwan, R.O.C.
Footnotes
Conflicts of interest
The authors declare that they have no conflict of interest.
References
- 1. Kunz C, Rudloff S, Baier W, Klein N, Strobel S. Oligosaccharides in human milk: structural, functional, and metabolic aspects. Annu Rev Nutr. 2000;20:699–722. doi: 10.1146/annurev.nutr.20.1.699. [DOI] [PubMed] [Google Scholar]
- 2. Newburg DS, Ruiz-Palacios GM, Morrow AL. Human milk glycans protect infants against enteric pathogens. Annu Rev Nutr. 2005;25:37–58. doi: 10.1146/annurev.nutr.25.050304.092553. [DOI] [PubMed] [Google Scholar]
- 3. Boehm G, Stahl B. Oligosaccharides from milk. J Nutr. 2007;137:847S. 9S. doi: 10.1093/jn/137.3.847S. [DOI] [PubMed] [Google Scholar]
- 4. Tao N, DePeters E, Freeman S, German J, Grimm R, Lebrilla CB. Bovine milk glycome. J Dairy Res. 2008;91:3768–78. doi: 10.3168/jds.2008-1305. [DOI] [PubMed] [Google Scholar]
- 5. McJarrow P, van Amelsfort-Schoonbeek J. Bovine sialyl oligosaccharides: seasonal variations in their concentrations in milk, and a comparison of the colostrums of Jersey and Friesian cows. Int Dairy J. 2004;14:571–9. [Google Scholar]
- 6. Martin-Sosa S, Martín M-J, García-Pardo L-A, Hueso P. Sialyloligosaccharides in human and bovine milk and in infant formulas: variations with the progression of lactation. J Dairy Res. 2003;86:52–9. doi: 10.3168/jds.S0022-0302(03)73583-8. [DOI] [PubMed] [Google Scholar]
- 7. Nakamura T, Kawase H, Kimura K, Watanabe Y, Ohtani M, Arai I, et al. Concentrations of sialyloligosaccharides in bovine colostrum and milk during the prepartum and early lactation. J Dairy Res. 2003;86:1315–20. doi: 10.3168/jds.S0022-0302(03)73715-1. [DOI] [PubMed] [Google Scholar]
- 8. Fong B, Ma K, McJarrow P. Quantification of bovine milk oligosaccharides using liquid chromatography–selected reaction monitoring–mass spectrometry. J Agric Food Chem. 2011;59:9788–95. doi: 10.1021/jf202035m. [DOI] [PubMed] [Google Scholar]
- 9. Gu J, Hiraga T, Wada Y. Electrospray ionization mass spectrometry of pyridylaminated oligosaccharide derivatives: sensitivity and in-source fragmentation. Biol Mass Spectrom. 1994;23:212–7. doi: 10.1002/bms.1200230405. [DOI] [PubMed] [Google Scholar]
- 10. Okamoto M, Takahashi KI, Doi T. Sensitive detection and structural characterization of trimethyl (p-aminophenyl)- ammonium-derivatized oligosaccharides by electrospray ionization–mass spectrometry and tandem mass spectrometry. Rapid Commun Mass Spectrom. 1995;9:641–3. doi: 10.1002/rcm.1290090804. [DOI] [PubMed] [Google Scholar]
- 11. Li D, Her G. Structural analysis of chromophore-labeled disaccharides and oligosaccharides by electrospray ionization mass spectrometry and high-performance liquid chromatography/electrospray ionization mass spectrometry. J Mass Spectrom. 1998;33:644–52. doi: 10.1002/(SICI)1096-9888(199807)33:7<644::AID-JMS667>3.0.CO;2-F. [DOI] [PubMed] [Google Scholar]
- 12. Harvey DJ. Electrospray mass spectrometry and fragmentation of N-linked carbohydrates derivatized at the reducing terminus. J Am Soc Mass Spectrom. 2000;11:900–15. doi: 10.1016/S1044-0305(00)00156-2. [DOI] [PubMed] [Google Scholar]
- 13. Cheng HL, Her GR. Determination of linkages of linear and branched oligosaccharides using closed-ring chromophore labeling and negative ion trap mass spectrometry. J Am Soc Mass Spectrom. 2002;13:1322–30. doi: 10.1016/S1044-0305(02)00528-7. [DOI] [PubMed] [Google Scholar]
- 14. Yoshino K-i, Takao T, Murata H, Shimonishi Y. Use of the derivatizing agent, 4-aminobenzoic acid 2-(diethylamino) ethyl ester, for high-sensitivity detection of oligosaccharides by electrospray ionization mass spectrometry. Anal Chem. 1995;67:4028–31. doi: 10.1021/ac00117a034. [DOI] [PubMed] [Google Scholar]
- 15. Ohta M, Kobatake M, Matsumura A, Matsuura F. Separation of Asn-linked sialyloligosaccharides labeled with p-aminobenzoic acid ethyl ester by high-performance liquid chromatography. Agric Biol Chem. 1990;54:1045–7. [PubMed] [Google Scholar]
- 16. Tao N, DePeters E, German J, Grimm R, Lebrilla CB. Variations in bovine milk oligosaccharides during early and middle lactation stages analyzed by high-performance liquid chromatography-chip/mass spectrometry. J Dairy Res. 2009;92:2991–3001. doi: 10.3168/jds.2008-1642. [DOI] [PubMed] [Google Scholar]
- 17. Barile D, Marotta M, Chu C, Mehra R, Grimm R, Lebrilla CB, et al. Neutral and acidic oligosaccharides in Holstein-Friesian colostrum during the first 3 days of lactation measured by high performance liquid chromatography on a microfluidic chip and time-of-flight mass spectrometry. J Dairy Res. 2010;93:3940–9. doi: 10.3168/jds.2010-3156. [DOI] [PMC free article] [PubMed] [Google Scholar]
- 18. Robinson RC, Colet E, Tian T, Poulsen NA, Barile D. An improved method for the purification of milk oligosaccharides by graphitised carbon-solid phase extraction. Int Dairy J. 2018;80:62–8. doi: 10.1016/j.idairyj.2017.12.009. [DOI] [PMC free article] [PubMed] [Google Scholar]
- 19. Cheng H-L, Pai P-J, Her G-R. Linkage and branch determination of N-linked oligosaccharides using sequential degradation/closed-ring chromophore labeling/negative ion trap mass spectrometry. J Am Soc Mass Spectrom. 2007;18:248–59. doi: 10.1016/j.jasms.2006.09.007. [DOI] [PubMed] [Google Scholar]
- 20. Lee H, Eugene CY, Wen B, Reily TP, Pohl L, Nelson S, et al. Optimization of reversed-phase microcapillary liquid chromatography for quantitative proteomics. J Chromatogr B. 2004;803:101–10. doi: 10.1016/j.jchromb.2003.09.005. [DOI] [PubMed] [Google Scholar]
- 21. Lane JA, Mari~no K, Rudd PM, Carrington SD, Slattery H, Hickey RM. Methodologies for screening of bacteria–carbohydrate interactions: anti-adhesive milk oligosaccharides as a case study. J Microbiol Methods. 2012;90:53–9. doi: 10.1016/j.mimet.2012.03.017. [DOI] [PubMed] [Google Scholar]
- 22. Simon P, Goode P, Mobasseri A, Zopf D. Inhibition of Helicobacter pylori binding to gastrointestinal epithelial cells by sialic acid-containing oligosaccharides. Infect Immun. 1997;65:750–7. doi: 10.1128/iai.65.2.750-757.1997. [DOI] [PMC free article] [PubMed] [Google Scholar]
- 23. Wheeler SF, Harvey DJ. Negative ion mass spectrometry of sialylated carbohydrates: discrimination of N-acetylneuraminic acid linkages by MALDI-TOF and ESI-TOF mass spectrometry. Anal Chem. 2000;72:5027–39. doi: 10.1021/ac000436x. [DOI] [PubMed] [Google Scholar]
- 24. Her G-R, Santikarn S, Reinhold V, Williams J. Simplified approach to HPLC precolumn fluorescent labeling of carbohydrates: N-(2-Pyridinyl)-glycosylamnes. J Carbohydr Chem. 1987;6:129–39. [Google Scholar]
- 25. Viverge D, Grimmonprez L, Solere M. Chemical characterization of sialyl oligosaccharides isolated from goat (Capra hircus) milk. Biochim Biophys Acta Gen Subj. 1997;1336:157–64. doi: 10.1016/s0304-4165(97)00021-4. [DOI] [PubMed] [Google Scholar]
- 26. Kuhn R, Gauhe A. Bestimmung der Bindungsstelle von Sialinsäureresten in Oligosacchariden mit Hilfe von Perjodat. Chem Ber. 1965;98:395–413. [Google Scholar]
- 27. Parkkinen J, Finne J. [22] Isolation of sialyl oligosaccharides and sialyl oligosaccharide phosphates from bovine colostrum and human urine. Methods Enzymol. 1987;138:289–300. doi: 10.1016/0076-6879(87)38024-3. Elsevier. [DOI] [PubMed] [Google Scholar]
- 28. Domon B, Costello CE. A systematic nomenclature for carbohydrate fragmentations in FAB-MS/MS spectra of glycoconjugates. Glycoconj J. 1988;5:397–409. [Google Scholar]
Associated Data
This section collects any data citations, data availability statements, or supplementary materials included in this article.
Supplementary Materials
Negative ion ESI-MS3 spectra of C2 fragment (m/z 382) of (A) the late eluting isomer (LNnT) and (B) the early eluting isomer (LNT) in bovine milk, and (C) LNT standard.
Negative ion ESI-MS2 spectra of the m/z 1218 ion (LNnH/LNH) in bovine milk. The inset shows the MS3 spectrum of the C2 fragment.
The full-scan spectra of oligosaccharide extraction procedures of (A) no sample dilution, (B) sample dilution with 1× volume of water, and (C) 2× volume of water.
Mass chromatograms of oligosaccharides in 48 h of colostrum sample.
Mass chromatograms in SIM mode of oligosaccharides in 48 h of colostrum sample.


